Adequacy of Milk Intake During Exclusive
Breastfeeding: A Longitudinal Study
WHAT’S KNOWN ON THIS SUBJECT: The World Health
Organization recommends exclusive breastfeeding to 6 months, but this practice is rare. Exclusive breastfeeding often ceases because of a perceived insufficient milk supply, and there are concerns over whether exclusive breastfeeding is adequate to fulfill energy requirements to 6 months.
WHAT THIS STUDY ADDS: When well supported mothers follow World Health Organization recommendations, infant milk intake is high and increases significantly over time, fulfilling infant energy requirements during normal growth. There was no evidence of insufficient milk supply during 6 months of exclusive
breastfeeding.
abstract
OBJECTIVE:To test whether and how human lactation and breastfeed-ing practices can adapt to fulfill infant energy requirements durbreastfeed-ing exclusive breastfeeding for 6 months.
METHODS:The First-Feed study was a longitudinal, observational field study to measure milk intake, energy intake (from the doubly labeled water method), anthropometry, and breastfeeding practices at 2 time points around 15 and 25 weeks of age. Fifty healthy exclusively breast-feeding mother-infant dyads were included from breastbreast-feeding sup-port groups in greater Glasgow, Scotland. Forty-seven completed (23 boys), and 41 were exclusively breastfed to 25 weeks of age.
RESULTS:Milk intakes were higher than literature values (923 [SD: 122] g/day,n⫽36; and 999 [SD: 146] g/day,n⫽33) at both 15 and 25 weeks of age (bothP⬍.001) and increased significantly between time points (mean increase: 61 g/day [95% confidence interval: 23–99];P⫽
.003). Infant growth was normal compared with World Health Organi-zation Child Growth Standards, and energy intakes were adequate compared with references for energy requirements. Behavioral data indicated no evidence of strain on breastfeeding practices.
CONCLUSIONS:Results of this prospective study reveal that when mothers are well supported and follow the World Health Organization recommendation on breastfeeding, milk intakes are high and increase over time, and there is adequate energy intake, normal infant growth, and no marked changes in breastfeeding practices. This new empirical evidence on adaptations during exclusive breastfeeding should help health professionals promote the initiation, duration, and exclusivity of breastfeeding.Pediatrics2011;128:e907–e914
AUTHORS:Susan B. Nielsen, MSc,aJohn J. Reilly, PhD,b
Mary S. Fewtrell, PhD,cSimon Eaton, PhD,dJames
Grinham, BSc,cand Jonathan C. K. Wells, PhDc
aCentre for Population and Health Sciences, School of Medicine,
University of Glasgow, Glasgow, United Kingdom;bPhysical
Activity and Health Research Group, School of Psychological Sciences and Health, University of Strathclyde, Glasgow, United Kingdom;cChildhood Nutrition Research Centre, UCL Institute of
Child Health, London, United Kingdom; anddDepartment of
Surgery, UCL Institute of Child Health, London, United Kingdom
KEY WORDS
exclusive breastfeeding, growth, human milk intake, infant feeding, infant nutrition
ABBREVIATIONS
WHO—World Health Organization EBF—exclusive breastfeeding
SIMD—Scottish Index of Multiple Deprivation CI—confidence interval
Drs Reilly and Wells developed the original concept; Ms Nielsen and Drs Reilly, Fewtrell, and Wells developed the study design and methods; Ms Nielsen conducted the research and collected all data; Dr Eaton and Mr Grinham performed isotope analyses; Ms Nielsen, Mr Grinham, and Drs Reilly and Wells analyzed isotope data and interpreted the results; Ms Nielsen prepared all drafts of the manuscript; and all the authors reviewed drafts of the manuscript. The authors had full access to all of the data, and Ms Nielsen takes responsibility for the integrity of the data and the accuracy of the data-analysis.
www.pediatrics.org/cgi/doi/10.1542/peds.2011-0914
doi:10.1542/peds.2011-0914
Accepted for publication Jun 28, 2011
Address correspondence to Susan B. Nielsen, MSc, School of Medicine, Centre of Population and Health Sciences, University of Glasgow, Yorkhill Hospitals, Tower 1st Floor, Glasgow G3 8SJ, Scotland, United Kingdom. E-mail: [email protected]
PEDIATRICS (ISSN Numbers: Print, 0031-4005; Online, 1098-4275).
Copyright © 2011 by the American Academy of Pediatrics
FINANCIAL DISCLOSURE:The authors have indicated they have no financial relationships relevant to this article to disclose.
(EBF) for 6 months,1with EBF defined
as giving only breast milk with allow-ance for oral rehydration, and vita-mins, minerals, and/or medicines.2
De-spite many benefits, EBF to 6 months remains rare.3 Even where initiation
rates have improved, duration and ex-clusivity have not followed.4
Breast-feeding in healthy dyads often meets problems,5and 1 common reason for
cessation of EBF is maternally per-ceived insufficient milk supply.6
A systematic review of studies mainly using the test-weighing method indi-cated a sufficient milk energy intake during EBF at 3 to 4 months,7but at 6
months of age energy intake from EBF seemed insufficient compared with references for energy requirements.8,9
The longitudinal studies indicated no marked increase in milk intake beyond 3 to 4 months of age. The test-weighing method involves weighing the infant before and after feeds and correcting for insensible water loss.10 This
method can be accurate, but impre-cise in situations with frequent feeds, where the amount of milk consumed is small relative to the sensitivity of the scale.11,12 There might be a risk of
under-reporting in field studies, where the mother records all weight mea-surements pertaining to each breast feed, whereas isotopic methods do not depend on the mother to record any measurements. The available evidence on EBF from the developed world at 6 months is scarce and only cross-sectional.7 Although studies in the
physiology of lactation13–15
demon-strate the lactational adaptive re-sponse to an increase in demand,13
this was not in infants EBF to 6 months. The energetic and behavioral means by which EBF is achieved to 6 months are therefore unclear. The aim of the present study was to use isotopic tech-niques in a longitudinal design to
follow the WHO recommendation by (1) quantifying milk and energy in-take for up to 6 months EBF, (2) test-ing if infant milk intake durtest-ing EBF to 6 months changes over time, (3) test-ing adequacy of energy intake and growth, and (4) exploring concomi-tant changes in breastfeeding prac-tices (breastfeeding frequency and duration of breastfeeds).
METHODS
Study Design and Participants
The First-Feed study was a longitudinal observational study with participants recruited from breastfeeding support groups in Glasgow, Scotland, from May 2007 to October 2008. Scottish EBF rates in 2008 were 37% at initiation (7–10 days postpartum) and 27% at 6 to 8 weeks postpartum,16 among the
lowest in Europe.17Sixty mothers were
recruited and given oral and written information on the study, if they were EBF, as defined by the WHO, and in-tended to continue with EBF to 6 months. Other eligibility criteria were born at⬎37 weeks’ gestation, single-tons with a birth weight of ⬎2500 g, and no significant disease in mother or infant. Exclusion criteria were any ill-ness in mother or infant that affected breastfeeding or infant growth. Mother-infant pairs were included for the first time point around 15 weeks, if they were still EBF (n⫽50), and fol-lowed up to 25 weeks (Fig 1). All mea-surements took place during home vis-its. The study was approved by the National Health Service Research Eth-ics Committee (ref No. 07/S0701/15), and all mothers gave written informed consent to participation.
Anthropometry
Infant growth was measured on a dig-ital scale (Seca 835 [Numed, Sheffield-,United Kingdom]) and expressed asz
sured to the last completed millimeter on a measuring board (Kiddimetre [Raven Equipment, Castlemead, United Kingdom]).
Lactational Energetic Measures: Milk and Energy Intake
The doubly labeled water method was used to measure milk intake, energy intake, and milk energy content.19The
method has been validated against in-direct calorimetry in hospitalized pre-term infants20 and postsurgical term
infants.21
Doubly labeled water was purchased as mixed sterilized⬎99.9 atom%2H
2O
and 10.40 atom% H218O (Rotem
Indus-tries Ltd, Beer Sheva, Israel) and dosed at 2.6 g/kg bodyweight. The measure-ment involved a predose visit (day ⫺1), a dosing visit (day 0), and a post-dose visit (day 7). At the dosing visit, doubly labeled water was adminis-tered to the infant orally through a 5 mL syringe, a feeding tube or in the infant’s feeding bottle.22The amount of
dose consumed was determined using preweighing and postweighing of dos-ing equipment on a precision scale (Sartorius Basic, model BA 310P [Sar-torius Goettingen, Germany]). Urine samples were collected by placing cot-ton wool in the nappies23on days⫺1
and 0 (predose) as well as days 1, 2, 6, and 7 (postdose). The researcher dem-onstrated the first predose urine sam-pling so that the mother could perform urine sampling subsequently. Urine samples were analyzed for back-ground abundance and isotope elimi-nation by isotope ratio mass spec-trometry.24 Isotope elimination rates
and carbon dioxide production rate (rCO2) were calculated by the plateau method25,26 by using a precoded
spreadsheet12as rCO
2 ⫽[(NO⫻kO)/
whereNOandNDare the oxygen and deuterium dilution spaces, respective-ly;kOandkDare the oxygen and deute-rium rate constants, respectively;f1is the fractionation factor for deuterium between vapor and liquid (0.93); f2is the fractionation factor for 18-oxygen between vapor and liquid (0.99); f3is the fractionation factor for 18-oxygen between carbon dioxide and water (1.04); andxis the proportion of water fractionated (assumed to be 0.15). Ox-ygen consumption was predicted from rCO2by using a respiratory quotient of 0.85. Total energy expenditure was
cal-culated using Weir’s equation.27To
en-sure that only high quality isotopic data were included in the results, iso-tope space ratio had to be between 1.010 and 1.090, and estimated total er-ror on energy expenditure had to be ⬍10% (Fig 1). Energy deposited in growth (kJ/day) was calculated from weight gain over the week of urine sampling, using the data on body com-position corrected for gender- and age-specific changes in body composi-tion and hydracomposi-tion of lean mass26as
described previously.28Total energy
in-take (kJ/day) was derived as total
en-ergy expenditure plus enen-ergy depos-ited in growth. The elimination rate of deuterium was used to determine milk intake (g/day), correcting for insensi-ble water influx10: milk intake (g/day)
⫽[0.88(ND⫻kD/f1)]/0.96. Milk energy content was calculated as total energy intake divided by milk intake (kJ/g).19
Behavioral Measures:
Breastfeeding Questionnaires and Infant Behavior Diaries
On day ⫺1, the mothers completed a 26-item questionnaire, adapted from the Infant Feeding Practices Study II,29
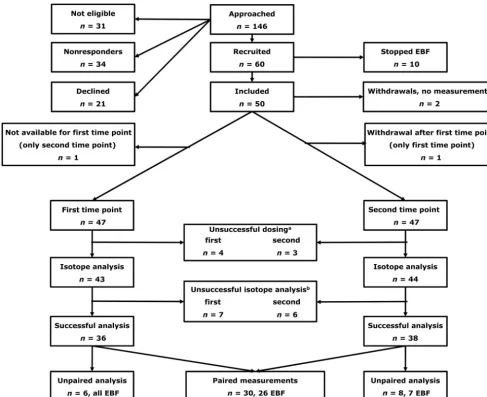
FIGURE 1
Flowchart of participants and samples.aUnsuccessful dose administration: dose could not be given because of infant uncooperativeness or infant had reflux and an unquantifiable amount of doubly labeled water was lost.bUnsuccessful isotope analysis: quality criteria of isotope space ratio within 1.010 and 1.090 and estimated error on total energy expenditure⬍10% were not fulfilled.
and support. On days 3 to 5, the moth-ers completed an infant behavior di-ary, previously validated by Barr et al.30
This diary consisted of 3 consecutive 24-hour periods, where mothers re-corded infant’s behavior to the nearest 5 minutes in categories (sleeping, feeding, fussy, crying, awake, and con-tent or awake and active). The ques-tionnaires and diaries were used to determine perceived and recorded breastfeeding frequencies and dura-tion of breastfeeds, respectively.
Statistical Methods and Study Power
Primary outcome measures were milk intakes and changes between the time points. A power calculation on the ba-sis of a systematic review of cross-sectional data7 suggested that 14
dy-ads with repeated measurements would be sufficient to detect a change in milk intake of 115 g/day (SD: 87) be-tween time points with power 0.90 at significanceP⬍.05. To allow for with-drawals/unsuccessful measurements, 60 dyads were recruited. Milk and en-ergy intakes were compared with liter-ature values using 1-sample t tests. Changes in milk intake between time points were assessed with a pairedt
test, and gender differences using in-dependentttests. All other outcomes were tested for change over time using pairedttests, or Wilcoxon tests, as ap-propriate. Participants were charac-terized for sociodemographic factors
prived), maternal age, height, and BMI.
RESULTS
Characteristics of Study Participants
A flowchart of participants is shown in Fig 1. The SIMD decile median was 8 (range: 2–10) for all included partici-pants (n⫽50). Thirty-five (70%) were primiparous, and the majority (45, 90%) were white European. Mean ma-ternal age was 33.7 (SD: 4.3) years and height and BMI were 165.0 (SD: 7.5) cm and 25.0 (SD: 3.9) kg/m2, respectively.
The mean interval between the first and second time points was 9.2 (SD: 1.7) weeks (n ⫽ 46). Forty-seven mother-infant dyads completed the study; 41 were still EBF as defined by WHO at the second time point. Four had just started introducing complemen-tary foods, mainly as puréed fruit (10 –25 g/day as measured from pre-weights and postpre-weights of food con-tainers and bibs on a digital scale by the mother), and 2 had introduced complementary foods when the in-fants were around 20 weeks of age. All mothers reported a perception of the infant “being ready for solids” as the reason to introduce complementary foods. No infants were receiving infant formula. These 6 dyads were not signif-icantly different from the EBF dyads in terms of SIMD decile, maternal age, height, BMI or infant birth weight, in-fant weight at the first or second time
ferences in milk intake, energy intake, or milk energy content between EBF in-fants and those who received comple-mentary foods at the second time point (allP⬎.1).
Infant growth data are listed in Table 1. The infants showed normal growth rel-ative to the WHO Child Growth Stan-dards. Mean infant age was 15.4 (SD: 1.3) and 24.5 (SD: 1.3) weeks at the first and second time point, respectively. Mean infant weight at the first time point was 6.72 (SD: 0.78) kg and 6.30 (SD: 0.64) kg for boys and girls, respec-tively. At the second time point, infant weight was 7.84 (SD: 0.91) kg for boys and 7.37 (SD: 0.75) kg for girls.
Energetic Measures: Intakes of Milk and Energy
As shown in Fig 1, 36 and 38 of 47 mea-surements were successful at the first and second time points, respectively, 7 data points were lost because of un-successful dosings (infants not able to consume the doubly labeled water or having reflux), and 13 data points were lost because of analytical problems. This resulted in 30 paired measure-ments. Four of these had introduced complementary foods at the second time point, leaving 26 paired measure-ments of EBF infants available for anal-ysis of changes in milk intake between time points (Table 2).
Mean milk intake was 923 (SD: 122) g/day at the first time point (n⫽36 EBF
TABLE 1 Infant Age and Weight-for-Age, Length-for-Age, BMI-for-Age, and Weight-for-LengthzScores Relative to WHO Child Growth Standards
First Time Point, Mean (SD) Second Time Point, Mean (SD)
Boys (n⫽24) Girls (n⫽25) All (n⫽49 Boys (n⫽23) Girls (n⫽24) All (n⫽47)
Infant age, wk 15.1 (0.9) 15.6 (1.5) 15.4 (1.3) 24.6 (1.3) 24.5 (1.4) 24.5 (1.3)
Weight-for-agezscore 0.01 (1.05) 0.11 (0.81) 0.06 (0.93) 0.01 (1.11) 0.21 (0.87) 0.11 (0.99) Length-for-agezscore ⫺0.15 (1.05) 0.21 (0.91) 0.03 (0.99) ⫺0.41 (1.02) 0.02 (0.95) ⫺0.19 (1.00) BMI-for-agezscore 0.13 (1.10) 0.00 (0.90) 0.06 (0.99) 0.33 (1.06) 0.27 (0.84) 0.30 (0.95) Weight-for-lengthzscore 0.19 (1.10) 0.04 (0.93) 0.11 (1.01) 0.42 (1.05) 0.36 (0.84)a 0.39 (0.93)b
infants; 17 boys), significantly higher than literature values of 779 g/day at 3 to 4 months7 (mean difference: 144
g/day [95% confidence interval (CI): 103–186]; P⬍ .0001). At the second time point, milk intake was 999 g/day (SD: 146 g/day) (n⫽33 EBF infants; 16 boys), which was also significantly higher than literature values of 894 g/day at 6 months7(mean difference:
103 g/day [95% CI: 56 –150];P⬍.0001). The mean difference in milk intake be-tween time points was 61 g/day (95% CI: 23–99;P⫽.003) for EBF infants only (n⫽26). The mean weekly increase in milk intake over the study period was 6.0 g/week (SD: 11.0 g/week) (P ⫽
.009). When energy intakes were ex-pressed per kg body weight (Table 3),
they were not significantly different from the WHO reference for energy re-quirements of 328 kJ/kg per day for breastfed infants9at 6 months (mean
difference: 15 kJ/kg per day [95% CI: ⫺2.6 –33];P⫽.091). In general, boys tended to have higher intakes of milk and energy at both time points, but when the variables were expressed per kg body weight, the differences were small and not significant. Milk en-ergy content was 2.72 and 2.60 kJ/g at the first and second time point, respec-tively, which is similar to what was found in the systematic review by Reilly et al,7where milk energy content
was mainly determined from bomb calorimetry or direct measurements of energy-yielding nutrient content.
Milk energy content did not change sig-nificantly between time points and was not significantly different between the genders.
Behavioral Measures:
Breastfeeding Practices and Infant Behavior
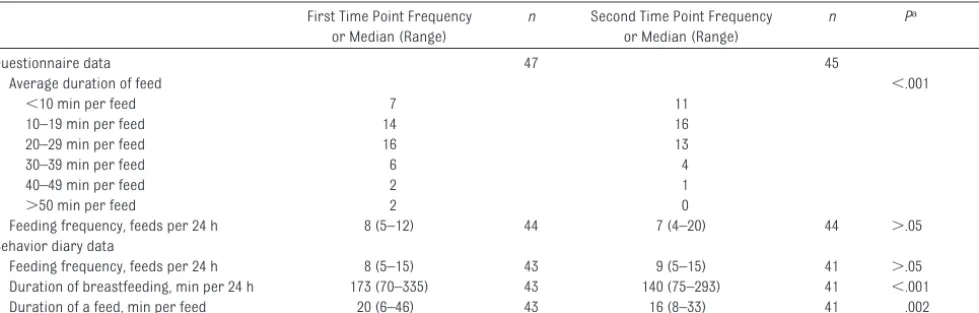
Feeding frequency and duration of breastfeeds are summarized in Table 4. The questionnaire and diary data suggested very small and insignificant changes in feeding frequency from the first to second time point. The average time spent on breastfeeding per day and per feed decreased significantly from the diary data (pairedttest), and the questionnaire data showed a simi-lar trend.
TABLE 2 Milk Intake, Milk Energy Content, and Energy Intake of All Infants and EBF Infants Only
All Infants EBF Infants
First Time Point Second Time Point Difference Second Time Point Difference
Mean (SD) n Mean (SD) n Mean (SD) n Mean (SD) n Mean (SD) n
Milk intake, g/d
Boys 949 (96) 17 1055 (118)a 18 108 (81)c 15 1050 (125) 16 96 (81) 13
Girls 901 (140) 19 945 (144) 20 23 (97) 15 952 (153) 17 27 (95) 13
All 923 (122) 36 997 (142) 38 65 (98)d 30 999 (146) 33 61 (93)e 26
Milk energy content, kJ/g
Boys 2.74 (0.38) 17 2.61 (0.38) 18 ⫺0.12 (0.54) 15 2.60 (0.40) 16 ⫺0.12 (0.59) 13
Girls 2.71 (0.39) 19 2.63 (0.43) 20 ⫺0.05 (0.36) 15 2.60 (0.46) 17 ⫺0.11 (0.36) 13
All 2.72 (0.38) 36 2.62 (0.40) 38 ⫺0.09 (0.46) 30 2.60 (0.43) 33 ⫺0.12 (0.48) 26
Energy intake, kJ/d
Boys 2582 (362) 17 2748 (480)b 18 182 (572) 15 2725 (500) 16 143 (607) 13
Girls 2403 (215) 19 2449 (312) 20 41 (395) 15 2437 (334) 17 8 (386) 13
All 2487 (303) 36 2590 (423) 38 111 (488) 30 2577 (441) 33 75 (503) 26
aDifference between genders in milk intake at second time point (all infants),P⫽.015 (independentttest). bDifference between genders in energy intake at second time point (all infants),P⫽.028 (independentttest). cDifference between genders in change in milk intake (all infants),P⫽.015 (independentttest).
dDifference between time points in milk intake (all infants),P⫽.001 (pairedttest). eDifference between time points in milk intake (EBF infants),P⫽.003 (pairedttest).
TABLE 3 Milk and Energy Intake per kg Body Weight for All Infants
First Time Point Second Time Point Difference
Mean (SD) n Mean (SD) n Mean (SD) n Pa
Milk intake, g/kg times day
Boys 142 (12) 17 135 (14) 18 ⫺6 (10) 15 .043
Girls 143 (21) 19 129 (16) 20 ⫺15 (14) 15 .001
All 142 (17) 36 132 (15) 38 ⫺11 (13) 30 ⬍.001
Energy intake, kJ/kg times day
Boys 385 (41) 17 353 (67) 18 ⫺28 (79) 15 .190
Girls 381 (30) 19 335 (40) 20 ⫺46 (57) 15 .007
All 383 (35) 36 343 (55) 38 ⫺37 (68) 30 .006
There were no significant differences between genders.
aDifference between time points (pairedttests).
DISCUSSION
The present study was the first to use a state-of-the-art technique to investi-gate longitudinal adaptations by moth-ers and infants who were EBF as de-fined by the WHO to 6 months of age. Milk intake during EBF was higher than literature values,7and it increased
sig-nificantly over time, an adaptation not described previously.8Infant energy
in-take was comparable to the WHO refer-ence for energy requirements,9and
in-fant growth was normal relative to the WHO Child Growth Standards, which describe optimal growth during in-fancy.18Finally, questionnaires on
ma-ternal perception of breastfeeding, as well as maternal records of infant be-havior did not indicate any increase in the behavioral demands of EBF, mani-fest as more frequent feeds or more time spent on breastfeeding. All these results support the view that EBF to 6 months is not constrained by maternal physiology,13–15 and that mothers can
accommodate EBF to 6 months by high and increasing milk outputs, with min-imal behavioral changes and normal infant growth.
Milk Intake Differs According to Design and Methodology
A possible explanation for the higher observed milk intakes in the present study compared with the literature is
the use of different designs and meth-odologies. Firstly, the current evidence from the developed world on milk in-take in EBF infants at 6 months of age is cross-sectional. This incurs a risk of sample selection bias, as high infant weight is a well known confounder for early complementary feeding.31,32
Cross-sectional studies at 6 months might be selection biased in a way that provides lower estimates of milk in-take. Secondly, literature values were based largely on the test-weighing method, and this method gives lower estimates of milk intake compared with an isotopic method.7,12,33–35 Reilly
et al7found a mean difference in milk
intake between the test-weighing method and the isotopic methods of 66 g/day (95% CI: 11–123 g/day;P⫽.02). The test-weighing method might be prone to imprecision in situations of frequent feed-ing11,12 and involves a risk of
under-reporting in field studies, which isotopic methods avoid because they do not re-quire the mothers to record any measure-ments. In addition, precision is improved in the isotopic methods by providing an aver-age measurement over a period of 7 days, whereas test-weighing is typically con-ducted over 24 hours.
Strengths and Limitations
In the present study, participants were relatively affluent, with a relatively
high age for their parity status: this could not be avoided because these are characteristics of mothers who at-tempt EBF to 6 months.36The high
ces-sation rate of EBF before inclusion (10/60 recruited dyads) is typical be-cause⬍1% of United Kingdom moth-ers practice EBF to 6 months.3 The
present study possibly benefitted from an intervention effect, increasing the motivation to persevere with EBF to 6 months; 82% (41/50 included mothers) succeeded. However, the effects of high socioeconomic status and study participation were purely behavioral, whereas the primary outcome mea-sures were physiologic adaptations to EBF to 6 months.
Implications for the Promotion of Breastfeeding
Initiation of EBF remains low in many parts of the world,37and EBF according
to the WHO recommendation is still rare.3,4 Many factors contribute to
early introduction of complementary feeding,32,36but the perception of
insuf-ficient milk supply remains a crucial issue to deal with if EBF toward the
WHO recommendation is to be
achieved.6,38Moreover, the response of
health professionals to perceived breast milk insufficiency can often be detrimental to breastfeeding (eg, rec-ommending that mothers “top up”
or Median (Range) or Median (Range)
Questionnaire data 47 45
Average duration of feed ⬍.001
⬍10 min per feed 7 11
10–19 min per feed 14 16
20–29 min per feed 16 13
30–39 min per feed 6 4
40–49 min per feed 2 1
⬎50 min per feed 2 0
Feeding frequency, feeds per 24 h 8 (5–12) 44 7 (4–20) 44 ⬎.05 39
Behavior diary data
Feeding frequency, feeds per 24 h 8 (5–15) 43 9 (5–15) 41 ⬎.05 37
Duration of breastfeeding, min per 24 h 173 (70–335) 43 140 (75–293) 41 ⬍.001 37
Duration of a feed, min per feed 20 (6–46) 43 16 (8–33) 41 .002 37
with formula).38,39 One review on
per-ceived insufficient milk supply found no studies that linked this perception to inadequate milk energy supply from EBF.6The present study also provided
no indication that following the WHO recommendation was associated with insufficient milk supply, and the ade-quacy of EBF was further confirmed through normal infant growth because growth is a sensitive indicator of whether energy needs are met.40
The extent to which socioeconomic cir-cumstances are associated with the energetics of lactation, or of infant en-ergy requirements, remains unclear but will be important for the generaliz-ability of the present study. In Brazil, infants of lower socioeconomic status families had 24% higher total energy expenditure, mainly caused by higher activity energy expenditure, than did infants from higher socioeconomic status families.41This does not mean
that EBF is not possible in all groups, but the constraints against EBF will
vary with provenance, degree of afflu-ence and other sociocultural factors, and these constraints need to be bet-ter understood if higher rates of EBF are to be achieved. In a large cluster randomized controlled trial in India it was demonstrated that community-based promotion of exclusive breast-feeding was highly successful in achieving higher rates of exclusivity and duration of breastfeeding, even with under-nourished mothers.42 The
behavioral ease with which mothers in the present study seemed to achieve EBF to 6 months offers some hope that more mothers might achieve EBF for a longer duration in the future if suffi-cient breastfeeding support is avail-able. Future studies can focus on how to improve support for increases in duration and exclusivity of EBF.
CONCLUSIONS
When mothers are supported and fol-low the WHO recommendation, milk in-takes are high and increase through-out time to meet infant energy
requirements during EBF to 6 months, and this can be achieved without major constraints on breastfeeding practices. Additional work would be required to determine the generaliz-ability of these data to all populations. However, this new evidence should be helpful in the promotion of greater du-ration and exclusivity of breastfeeding in future.
ACKNOWLEDGMENTS
This work was supported by the Scot-tish Government Health Department and Yorkhill Children’s Foundation; a studentship from the Yorkhill Chil-dren’s Foundation to Ms Nielsen, and a research grant from the Scottish Government Chief Scientist Office (ref No. CZH/4/413) for the First-Feed study.
We thank Dr David Young for initial ad-vice on statistical analyses, Tegan Darch for help with isotope analysis, and the committed mothers who par-ticipated in this study.
REFERENCES
1. Infant and young child nutrition. Report on World Health Organization 54th World Health Assembly (WHA54.2); Geneva, Switzerland: May 18, 2001
2. World Health Organization.Indicators for Assessing Infant and Young Child Feeding Practices: Part 1: Definitions. Geneva, Switzerland: World Health Organization; 2008
3. Bolling K, Grant C, Hamlyn B, et al.Infant Feeding Survey 2005. Information Centre: London, United Kingdom; 2007
4. Forste R, Hoffmann JP. Are US mothers meeting the Healthy People 2010 breast-feeding targets for initiation, duration, and exclusivity? The 2003 and 2004 National Im-munization Surveys.J Hum Lact. 2008;24(3): 278 –288
5. Hoddinott P, Tappin D, Wright C. Breast feed-ing.BMJ. 2008;336(7649):881– 887
6. Gatti, L. Maternal perceptions of insufficient milk supply in breastfeeding.J Nurs Schol-arsh. 2008;40(4):355–363
7. Reilly JJ, Ashworth S, Wells JC. Metabolis-able energy consumption in the exclusively breast-fed infant aged 3– 6 months from
the developed world: a systematic review.
Br J Nutr. 2005;94(1):56 – 63
8. Reilly JJ, Wells JC. Duration of exclusive breast-feeding: introduction of complemen-tary feeding may be necessary before 6 months of age. Br J Nutr. 2005;94(6): 869 – 872
9. Butte, NF. Energy requirements of infants.
Public Health Nutr. 2005;8(7A):953–967
10. Wells JC, Davies PS. Correction for environ-mental water influx in measurement of milk volume intake by deuterium turnover in in-fants.Early Hum Dev. 1995;41(3):177–182
11. Savenije OE, Brand PL. Accuracy and preci-sion of test weighing to assess milk intake in newborn infants.Arch Dis Child. 2006; 91(5):F330 –F332
12. Coward WA, Sawyer MB, Whitehead RG, Prentice AM, Evans J. New method for mea-suring milk intakes in breast-fed babies.
Lancet. 1979;2(8132):13–14
13. Dewey KG, Lonnerdal B. Infant self-regulation of breast milk intake.Acta Paediatr Scand. 1986;75(6):893– 898
14. Daly SE, Hartmann PE. Infant demand and
milk supply. Part 1: infant demand and milk production in lactating women.J Hum Lact. 1995;11(1):21–26
15. Daly SE, Hartmann PE. Infant demand and milk supply. Part 2: the short-term control of milk synthesis in lactating women.J Hum Lact. 1995;11(1):27–37
16. ISD Scotland. Breastfeeding: statistics and information. Available at: www.isdscotland. org/isd/1764.html. Accessed June 22, 2011
17. Yngve A, Sjostrom M. Breastfeeding in coun-tries of the European Union and EFTA: cur-rent and proposed recommendations, ra-tionale, prevalence, duration and trends.
Public Health Nutr. 2001;4(2B):631– 645
18. WHO Multicentre Growth Reference Study Group. WHO Child Growth Standards based on length/height, weight and age.Acta Pae-diatr Suppl. 2006; 450:76 – 85
19. Lucas A, Ewing G, Roberts SB, Coward WA. How much energy does the breast fed infant consume and expend?BMJ. 1987;295(6590): 75–77
tion of energy expenditure, water intake, and metabolizable energy intake in preterm infants.Am J Clin Nutr. 1986;44(3):315–322
21. Jones PJ, Winthrop AL, Schoeller DA, Swyer PR, Smith J, Filler RM, Heim T. Validation of doubly labeled water for assessing energy expenditure in infants.Pediatr Res. 1987; 21(3):242–246
22. Nielsen SB, Wells JC, Slater C, Fewtrell MS, Reilly JJ. Administering labelled water to ex-clusively breast-fed infants in studies in-volving stable isotope dilution techniques.
Isotopes Environ Health Stud. 2011;47(1): 18 –25
23. Roberts SB, Lucas A. Measurement of uri-nary constituents and output using dispos-able napkins.Arch Dis Child. 1985;60(11): 1021–1024
24. International Atomic Energy Agency. As-sessment of Body Composition and Total En-ergy Expenditure in Humans Using Stable Isotope Techniques. IAEA Human Health Se-ries No. 3. Vienna, Austria: IAEA; 2009
25. Cole TJ, Coward WA. Precision and accuracy of doubly labeled water energy expenditure by multipoint and two-point methods.Am J Physiol. 1992;263(5 pt 1):E965–E973
26. Wells JC, Davies PS. Estimation of the energy cost of physical activity in infancy.Arch Dis Child. 1998;78(2):131–136
27. Weir, JB. New methods for calculating met-abolic rate with special reference to protein metabolism.J Physiol. 1949;109(1–2):1–9
from birth to age 10 years.Am J Clin Nutr. 1982;35(suppl 5):1169 –1175
29. Fein SB, Grummer-Strawn LM, Raju TN. In-fant feeding and care practices in the United States: results from the Infant Feed-ing Practices Study II. Pediatrics. 2008; 122(suppl 2):S25–S27
30. Barr RG, Kramer MS, Boisjoly C, McVey-White L, Pless IB. Parental diary of infant cry and fuss behaviour.Arch Dis Child. 1988; 63(4):380 –387
31. Savage SA, Reilly JJ, Edwards CA, Durnin JV. Weaning practice in the Glasgow Longitudi-nal Infant Growth Study. Arch Dis Child. 1998;79(2):153–156
32. Fewtrell MS, Lucas A, Morgan JB. Factors associated with weaning in full term and preterm infants.Arch Dis Child. 2003;88(4): F296 –F301
33. Butte NF, Wong WW, Klein PD, Garza C. Mea-surement of milk intake: tracer-to-infant deuterium dilution method.Br J Nutr. 1991; 65(1):3–14
34. Butte NF, Garza C, Smith EO, Nichols BL. Eval-uation of the deuterium dilution technique against the test-weighing procedure for the determination of breast milk intake.Am J Clin Nutr. 1983;37(6):996 –1003
35. Butte NF, Wong WW, Patterson BW, Garza C, Klein PD. Human-milk intake measured by administration of deuterium oxide to the mother: a comparison with the
test-36. Scott JA, Binns CW. Factors associated with the initiation and duration of breastfeeding: a review of the literature.Breastfeed Rev. 1999;7(1):5–16
37. World Health Organization. Global data bank on infant and young child feeding. Available at: www.who.int/nutrition/databases/ infantfeeding/en/?menu⫽10. Accessed June 22, 2011
38. Deshpande, W. Exclusive breastfeeding for the first six months.Community Pract. 2008; 81(5):34 –36
39. Shah S, Rollins NC, Bland R. Breastfeeding knowledge among health workers in rural South Africa.J Trop Pediatr. 2005;51(1): 33–38
40. United Nations, Food and Agriculture Orga-nization.Human Energy Requirements: Re-port of a Joint FAO/WHO/UNU Expert Consultation: Rome, Italy; Food and Agricul-ture Organization; 2001
41. Haisma H, Coward WA, Visser GH, et al. Socio-economic and environmental factors influence energy utilization in Brazilian breast-fed infants. J Nutr. 2006;136(11): 2945–2951
DOI: 10.1542/peds.2011-0914 originally published online September 19, 2011;
2011;128;e907
Pediatrics
Jonathan C. K. Wells
Susan B. Nielsen, John J. Reilly, Mary S. Fewtrell, Simon Eaton, James Grinham and
Adequacy of Milk Intake During Exclusive Breastfeeding: A Longitudinal Study
Services
Updated Information &
http://pediatrics.aappublications.org/content/128/4/e907
including high resolution figures, can be found at:
References
http://pediatrics.aappublications.org/content/128/4/e907#BIBL
This article cites 35 articles, 12 of which you can access for free at:
Subspecialty Collections
sub
http://www.aappublications.org/cgi/collection/fetus:newborn_infant_
Fetus/Newborn Infant
following collection(s):
This article, along with others on similar topics, appears in the
Permissions & Licensing
http://www.aappublications.org/site/misc/Permissions.xhtml
in its entirety can be found online at:
Information about reproducing this article in parts (figures, tables) or
Reprints
http://www.aappublications.org/site/misc/reprints.xhtml
DOI: 10.1542/peds.2011-0914 originally published online September 19, 2011;
2011;128;e907
Pediatrics
Jonathan C. K. Wells
http://pediatrics.aappublications.org/content/128/4/e907
located on the World Wide Web at:
The online version of this article, along with updated information and services, is
by the American Academy of Pediatrics. All rights reserved. Print ISSN: 1073-0397.