University of New Hampshire Scholars'
Repository
PREP Reports & Publications Institute for the Study of Earth, Oceans, and Space (EOS)
6-16-2014
Great Bay Nitrogen Non-Point Source Study
Philip Trowbridge
State of New Hamphsire Department of Environmental Services
Matthew A. Wood
New Hamphsire Department of Environmental Services
Thomas S. Burack
New Hamphsire Department of Environmental Services
Vicki V. Quiram
New Hamphsire Department of Environmental Services
Eugene J. Forbes
New Hamphsire Department of Environmental Services
Follow this and additional works at:https://scholars.unh.edu/prep
This Report is brought to you for free and open access by the Institute for the Study of Earth, Oceans, and Space (EOS) at University of New Hampshire Scholars' Repository. It has been accepted for inclusion in PREP Reports & Publications by an authorized administrator of University of New Hampshire Scholars' Repository. For more information, please [email protected].
Recommended Citation
Trowbridge, Philip; Wood, Matthew A.; Burack, Thomas S.; Quiram, Vicki V.; and Forbes, Eugene J., "Great Bay Nitrogen Non-Point Source Study" (2014).PREP Reports & Publications. 381.
R-WD-13-10
Great Bay Nitrogen Non-Point Source Study
PREPARED BY
PHILIP TROWBRIDGE, P.E. and MATTHEW A. WOOD WATER DIVISION
JEFFREY T. UNDERHILL, Ph.D. and DAVID S. HEALY AIR RESOURCES DIVISION
STATE OF NEW HAMPSHIRE
DEPARTMENT OF ENVIRONMENTAL SERVICES 29 HAZEN DRIVE
CONCORD, NEW HAMPSHIRE 03301 (603) 271-3503
www.des.nh.gov
THOMAS S. BURACK, COMMISSIONER
VICKI V. QUIRAM ASSISTANT COMMISSIONER
EUGENE J. FORBES, P.E. DIRECTOR
WATER DIVISION
This page was intentionally left blank.
Page i
Table of Contents
Definitions of Acronyms, Important Terms, and Units ... ii
Acknowledgements ... iv
Executive Summary ... 1
I. Introduction ... 4
II. Methods ... 4
a. Study Area ... 4
b. Types of Nitrogen Included in the Study ... 5
c. Nitrogen Loading Model ... 7
d. Model Validation ... 11
e. Quality Assurance ... 11
f. Public Participation... 11
III. Results & Discussion ... 14
a. Validation of Model Input Parameters ... 14
b. Validation of Model Output ... 15
c. Model Output for the Great Bay Estuary Watershed ... 18
IV. References... 27 V. Model Results for Subwatersheds and Municipalities in the Piscataqua Region
VI. Appendices
A: Nitrogen Deposition to Great Bay – A Modeling Study
B: Methodology for Estimating Disconnected Impervious Area, Connected Impervious Area, Water Area, and Natural Vegetation Area in the Piscataqua Region Watershed C: Methodology for Calculating the Area and Fertilizer Use for Agricultural Lands in the
Piscataqua Region Watershed
D: Methodology for Calculating the Area and Fertilizer Use on Managed Turf in the Piscataqua Region Watershed
E: Methodology for Estimating Residential Lawn Area and Fertilizer Use in the Piscataqua Region Watershed
F: Methodology for Calculating the Nitrogen Imports in Animal Waste to the Piscataqua Region Watershed
G: Methodology for Calculating the Number of People Using Onsite Septic Systems for Waste Disposal in the Piscataqua Region Watershed
H: Methodology for Estimation Surface Water/Groundwater Partitioning (i.e. Stormwater) in the Piscataqua Region Watershed
Page ii
Definitions of Acronyms, Important Terms, and Units
Acronyms
DES: New Hampshire Department of Environmental Services ELM: Estuarine Loading Model
GBNNPSS: Great Bay Nitrogen Non-Point Source Study HUC12: 12-Digit Hydrologic Unit Code watershed NLM: Nitrogen Loading Model
NRCS: USDA, Natural Resources Conservation Services PREP: Piscataqua Region Estuaries Partnership
TN: Total Nitrogen
USDA: U.S. Department of Agriculture
USEPA: U.S. Environmental Protection Agency USGS: U.S. Geological Survey
WWTF: Municipal Wastewater Treatment Facility
Important Terms
Airshed: An airshed is a geographic area (domain) from which emissions would account for a significant majority of the deposition to the receptor watershed. Airsheds cross county, state, and national boundaries.
Atmospheric Deposition: The process by which a pollutant in the atmosphere falls to the land or surface waters through either wet or dry deposition. Wet deposition occurs when the pollutant is contained in rain or snow. Dry deposition occurs when the pollutant is attached to aerosols that fall to the earth.
Chemical Fertilizer: Any of a large number of organic and synthetic materials, spread on or worked into soil to increase its capacity to support plant growth.
Connected Impervious Area (CIA): Impervious surfaces from which runoff flows directly into municipal storm sewers and surface waters without any opportunity to infiltrate. Also known as Directly Connected Impervious Area or Effective Impervious Area.
Delivered Load: The amount of a pollutant (e.g. nitrogen) that is delivered from a watershed to the estuary. The delivered load is the initial load that enters a watershed minus the amount of the pollutant that is lost during transport to the estuary.
Disconnected Impervious Area (DIA): Impervious surfaces from which runoff flows onto lawn or natural vegetation areas where it can infiltrate.
Estuary: An estuary is a partially enclosed body of water along the coast where freshwater from rivers and streams meets and mixes with salt water from the ocean.
Great Bay Estuary: The body of water beginning at the confluence of the Piscataqua River with the Atlantic Ocean and extending to the head-of-tide dams on Winnicut, Squamscott, Lamprey, Oyster, Bellamy, Cocheco Salmon Falls, and Great Works Rivers. The Great Bay Estuary covers approximately 13,440 acres (21 square miles).
Page iii
Hampton-Seabrook Estuary: The body of water beginning at confluence of the Hampton River with the Atlantic Ocean and extending to the head-of-tide on the Taylor, Blackwater, Browns, and Hampton Falls Rivers. The Hampton-Seabrook Harbor Estuary covers approximately 1,227 acres (1.9 square miles).
HUC12 Subwatershed: A small watershed covering typically 10,000 to 40,000 acres. The USGS has assigned Hydrologic Unit Codes (HUC) from 2 to 12 digits long to watersheds across the country. A HUC12 subwatershed is the smallest watershed in the USGS system and is denoted with a 12-digit code.
Managed Turf: Grass that is actively managed for use as golf courses, parks and sports fields. Non-Point Source: Non-point source pollution generally results from land runoff, precipitation,
atmospheric deposition, drainage, seepage or hydrologic modification. The model accounts for non-point source pollution as a function of its point of origin; it does not consider or track its point of entry into the estuary via point sources (i.e. stormwater outfalls, drainage swales, etc.).
Piscataqua Region Watershed: The area of land where all of the water that drains off of it goes into either the Great Bay Estuary, Hampton-Seabrook Estuary or directly in to the Atlantic Ocean along New Hampshire’s coast. The Piscataqua Region watershed covers approximately 695,037 acres (1,086 square miles).
Reactive Nitrogen: The forms of nitrogen that are readily bioavailable, specifically nitrate, nitrite, ammonia, and ammonium. Other forms of nitrogen (e.g., organic nitrogen) are also “reactive” and bioavailable but at a slower rate.
Septic System: An on-site wastewater treatment system that typically consists of a settling tank and a leach field to treat and inject sewage into the ground. Septic systems are typically used for residences in rural areas or suburban areas where municipal sewer service is not available.
Total Nitrogen (TN): The sum of all forms of nitrogen: both dissolved and particulate fractions of ammonia, ammonium, nitrite, nitrate, and organic nitrogen.
Wastewater Treatment Facility: A facility that treats wastewater from municipal sewer systems in urban areas.
Watershed: A watershed is the area of land where all of the water that drains off of it goes into the same water body. Watersheds come in all shapes and sizes. They cross county, state, and national boundaries.
Units
lb/yr or lb N/yr: Pounds (of nitrogen) per year lb/ac or lb N/ac: Pounds (of nitrogen) per acre
lb/ac/yr or lb N/ac/yr: Pounds (of nitrogen) per acre per year
lb/1000 ft2or lb N/1000 ft2: Pounds (of nitrogen) per one thousand square feet tons/ac or tons N/ac: Tons (of nitrogen) per acre
Page iv
Acknowledgements
The New Hampshire Department of Environmental Services wishes to thank the following people for their assistance in preparing this report:
Dr. Ivan Valiela of the Marine Biological Laboratory at Woods Hole, Massachusetts
Ken Edwardson, Sally Soule, Barbara McMillan, Cathy Coletti, Eric Williams, Steve Couture and Ted Diers of DES
Robert Johnson of the New Hampshire Farm Bureau Federation
Dr. William McDowell, Michelle Daley, Fay Rubin, and Dr. Alberto Manalo of the University of New Hampshire
Carl Majewski and Becky Sideman of the University of New Hampshire Cooperative Extension
Cynthia M. Heisler of the New Hampshire Department of Agriculture, Markets & Food, Division of Animal Industry
Laura Hayes and Marilee Horn of the United States Geological Survey
James Houle and Robert Roseen1 of the University of New Hampshire Stormwater Center
Dr. Donald E. Hoenig, Maine State Veterinarian of the Maine Department of Agriculture
Bill Arcieri and Theresa McGovern of Vanasse Hangen Brustlin, Inc. (VHB)
1
Page 1
Executive Summary
The Great Bay Estuary is 21 square miles of tidal waters located in southeastern New Hampshire. It is one of 28 “estuaries of national significance” established under the
Environmental Protection Agency’s National Estuary Program. The estuary is experiencing the signs of eutrophication, specifically, low dissolved oxygen, macroalgae blooms, and declining eelgrass habitat (DES, 2012).
Sixty-eight percent of the nitrogen that ends up in the Great Bay Estuary originates from sources spread across the watershed; the remainder derives from direct discharges of municipal
wastewater treatment facilities (DES, 2010; PREP, 2013). In this report, these diffuse sources of nitrogen are called non-point sources and consist of atmospheric deposition, fertilizers, human waste disposed into septic systems, and animal waste. The purpose of this study is to determine how much nitrogen each non-point source type contributes to the estuary. The nitrogen loads from municipal wastewater treatment facilities have been reported elsewhere (DES, 2010; PREP, 2013) and, therefore, are not included in this study except to provide context.
The intended use of this study is for planning purposes, and is not meant for regulatory
allocations or specific reduction requirements. The results of the model may be useful for towns or watershed groups for prioritizing nitrogen reduction efforts or as a starting point for more detailed studies of non-point sources. However, more detailed inventories of non-point sources will be needed to model nitrogen reduction efforts in smaller areas. In addition, the model makes no conclusions about the benefits of nitrogen reductions to receiving waters or overall estuarine health.
The model used in this study is the Nitrogen Loading Model, as originally published in Valiela et al. (1997). The Nitrogen Loading Model, as customized for this study, tracks nitrogen inputs from atmospheric deposition, chemical fertilizers, human waste through septic systems, and animal wastes. These sources are then routed through surface waters, stormwater and
groundwater to the estuary as a delivered load of nitrogen. Local data were developed as inputs to the model. The model output was found to match field measurements of total non-point source nitrogen loads from eight watersheds within the model uncertainty of +/-13%.
For the watershed draining to the Great Bay Estuary, the model predicted a non-point source nitrogen load of 800 tons per year (+/-100 tons/yr)2. This estimate corresponds well with the most recent field measurement of non-point source load (835 tons/yr) (PREP, 2013). The breakdown of nitrogen non-point sources from the model of delivered loads to the estuary is:
• Atmospheric Deposition – 42% (350 +/-50 tons/yr) – Out-of-state sources account for 62% of this source.
• Human Waste – 29% (240 +/-30 tons/yr) – This load is exclusively from septic systems because loads from wastewater treatment facilities (390 tons/yr (PREP, 2013)) were not considered in this study3.
2
The modeled results have been rounded to the number of significant digits consistent with the uncertainty of the model. This rounding causes slight discrepancies in some totals and percentages.
3
Page 2
• Chemical Fertilizer – 15% (130 +/-20 tons/yr) – Lawns contributed 70%, agricultural areas contributed 23% and recreational fields were responsible for 8% of this load. • Animal Waste - 14% (120 +/-20 tons/yr) – Livestock accounted for 58% of this load,
while pet waste accounted for the remaining 42%.
Page 3
From
PREP (2013)
DES Great Bay
Nitrogen Non-Point
Source Study
Figure ES: Summary of Non-Point Source Nitrogen Loads to the Great Bay Estuary
Nitrogen Loading
Model
Total Load
1,225 tons/yr
Non-Point Source Load
800 ±100 tons/yr
Non-Point Source Load Delivered by Stormwater = 34%
Page 4
I. Introduction
The Great Bay Estuary is 21 square miles of tidal waters located in southeastern New Hampshire. It is one of 28 “estuaries of national significance” established under the
Environmental Protection Agency’s National Estuary Program. The estuary is experiencing the signs of eutrophication, specifically, low dissolved oxygen, macroalgae blooms, and declining eelgrass habitat (DES, 2012).
Sixty-eight percent of the nitrogen that ends up in the Great Bay Estuary originates from sources spread across the watershed; the remainder derives from direct discharges of municipal
wastewater treatment facilities (DES, 2010; PREP, 2013). In this report, these sources of nitrogen are called non-point sources and consist of atmospheric deposition, fertilizers, human waste disposed into septic systems, and animal waste. The purpose of this study is to determine how much nitrogen each non-point source type contributes to the estuary. The nitrogen loads from municipal wastewater treatment facilities have been reported elsewhere (DES, 2010; PREP, 2012; PREP, 2013) and, therefore, are not included in this study except to provide context.
The intended use of this study is for planning purposes, and is not meant for regulatory
allocations or specific reduction requirements. The results of the model may be useful for towns or watershed groups for prioritizing nitrogen reduction efforts or as a starting point for more detailed studies of non-point sources. However, more detailed inventories of non-point sources will be needed to track the effects of nitrogen reduction efforts in smaller areas. In addition, the model makes no conclusions about the benefits of nitrogen reductions to receiving waters or overall estuarine health.
II. Methods
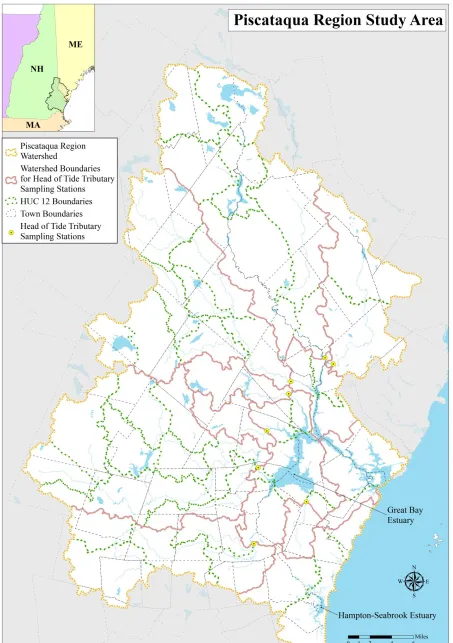
a. Study Area
The focus of this study is the watershed draining to the Great Bay Estuary. This watershed is in the Piscataqua Region which covers 1,086 square miles and parts of 61 municipalities in the states of New Hampshire, Maine, and Massachusetts in the northeastern U.S.A. The watershed for the Great Bay Estuary covers most of the Piscataqua Region (1,023 square miles). The remaining area drains to the Hampton-Seabrook Estuary or directly to the Atlantic Ocean.
In this study, the full Piscataqua Region watershed was split into smaller subwatersheds for three purposes. First, the watersheds of the eight major tributaries draining to the Great Bay Estuary were delineated so that measured nitrogen loads from these tributaries could be used to verify the model output. Second, the full watershed was divided into the 40 subwatersheds (the most current HUC12 boundaries, see definitions on page ii) to look for “hot spots” of non-point source nitrogen loading. Third, the study area was divided by the political boundaries of the 61
Page 5
b. Types of Nitrogen Included in the Study
Nitrogen is the most abundant gas in the atmosphere. It is non-reactive in its gaseous form. The only natural processes that convert non-reactive nitrogen to reactive nitrogen are biological nitrogen fixation by specialized microbes associated with plants and, to a lesser extent, high temperature events, such as lightning. As a result, prior to human development, reactive nitrogen was scarce in natural ecosystems, with production of reactive nitrogen balanced by the natural processes that converted reactive nitrogen back to non-reactive nitrogen (Galloway et al., 2003).
For over one hundred years, human activities have vastly increased the production of reactive nitrogen (see definition under Important Terms), with the greatest increases occurring since 1960, mirroring the trend of increasing population. Reactive nitrogen production was accelerated by the manufacture of chemical fertilizer, the combustion of fossil fuels, and the cultivation of certain crops that biologically fix nitrogen from the atmosphere. Globally, these human activities have increased the reactive nitrogen production from 33 billion pounds per year in 1860 to 364 billion pounds per year in 2000. The amount of reactive nitrogen created for chemical fertilizers was greater than all the other sources combined (Galloway et al., 2003).
For the Piscataqua Region watershed, this study quantifies the imports and exports of reactive nitrogen created or enhanced by human activities. The specific sources of anthropogenic nitrogen considered are: deposition of nitrogen from the atmosphere (largely from pollution), application of chemical fertilizers, human waste disposed through septic systems, and animal waste. Reactive nitrogen from fossil fuel combustion for power generation or automobiles enters the watershed in the form of air pollution that settles onto the land surface. Reactive nitrogen from chemical fertilizers can be imported to the study area either through fertilizer imports directly (e.g. chemical fertilizers) or through imports of food and feed that were grown elsewhere (e.g. crops imported from outside the watershed). Animal waste contains nitrogen that was imported as animal feed. Nitrogen in imported food is converted to human waste which is either sent to a municipal wastewater treatment facility or an individual septic system. Nitrogen loads to the estuary from wastewater treatment facilities have been quantified in previous reports (DES, 2010; PREP, 2012; PREP, 2013). Therefore, this study will focus on nitrogen loads to the estuary from non-point sources. For a more detailed discussion of the nitrogen cycle, see SAB (2011).
Page 6
Page 7
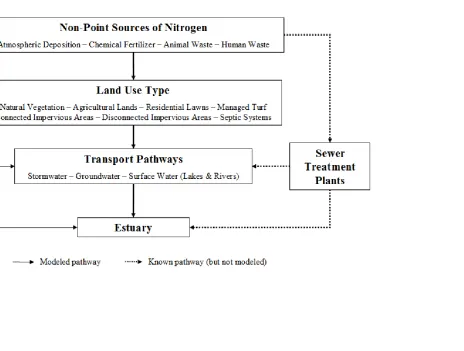
c. Nitrogen Loading Model
The model used for this study is the Nitrogen Loading Model (NLM) as originally published in Valiela et al. (1997). The NLM has accurately predicted nitrogen loads in Waquoit Bay, Massachusetts (Valiela et al., 2000), Barnegat Bay, New Jersey (Bowen et al., 2007), and in 74 small embayments in southern New England (Latimer and Charpentier, 2010). The model output is an annual average nitrogen load. The model does not predict how non-point source nitrogen loads may change over the course of a year or during a particular weather event.
Inputs of Non-Point Source Nitrogen
The default NLM tracks nitrogen inputs from human activities from three major sources: (1) atmospheric deposition; (2) chemical fertilizers; and (3) human waste. For this study, animal waste has been added to the model as another source of nitrogen. Valiela et al. (1997)
considered this factor originally but decided that it would be negligible in the small Waquoit Bay watershed. However, for the larger Piscataqua Region watershed animal waste was considered to be an important input to analyze. Figure 2 and
Figure 3 are simplified and detailed outlines of the model used for this study, respectively.
Atmospheric deposition rates for the model were taken from measurements in the study area in 2009. In addition, the DES Air Resources Division used a regional air dispersion model
(California Photochemical Grid Model, CALGRID) to estimate how much of the nitrogen in atmospheric deposition originates from sources outside of New Hampshire and from different source categories (e.g., mobile sources, power generation, etc.). Appendix A contains a
summary of the methods used for the regional air dispersion modeling and an analysis of how the deposition rate is expected to change over the next 10 years.
The model handles nitrogen from atmospheric deposition differently depending on the type of land use on which it falls. Land use data covering the entire study area was obtained from the NOAA Coastal Change Analysis Program 2006 data layer (Landsat TM, 30-meter resolution4). Impervious surface data for the study area in 2010 was obtained from the University of New Hampshire (Landsat TM, 30-meter resolution5). While more detailed land use and impervious cover datasets are available for some parts of the study area, only ones that covered the entire area were used. These datasets were used to estimate Connected Impervious Area and
Disconnected Impervious Area in each study area following the approach from Sutherland (1995)6. The area of natural vegetation and surface waters in each study area were also estimated from these datasets. Appendix B provides detail on the methods used for land use calculations. 4 http://www.csc.noaa.gov/crs/lca/northeast.html 5 http://www.granit.unh.edu/data/datacat/pages/coastalimperv10.pdf 6
Page 8
Agricultural lands, managed turf areas, and lawn area were estimated separately and are discussed below.
The area of different agricultural crops in the study area was estimated from the USDA National Agricultural Statistics Service Cropland Data Layer for 2011 (Landsat TM, 30-meter
resolution7). The expected fertilizer application rates for different crops were obtained from the USDA National Agricultural Statistics Service using data for New York as a surrogate for New Hampshire. New York was the closest state to the study area for which data were reported. Agricultural experts at UNH Cooperative Extension were also consulted regarding fertilizer applications rates, particularly for hay and pasture fields. Details of the methods used to estimate agricultural lands and fertilizer application rates are provided in Appendix C.
Golf courses, ball fields, and parks all have large areas of managed turf. The total area of
managed turf in the study areas was determined by identifying all of these fields and delineating their boundaries using computer mapping software and aerial imagery from 2010-20118 at a 1-foot or 1-meter resolution. Golf courses and ball fields, relatively large features, were easily identified using the imagery. The fertilizer application rate for each field was obtained through a survey of the persons responsible for managing the fields. The survey had a 48% response rate. Average fertilization rates from the survey responses were used for the fields for which the survey was not completed. Details of the process used to delineate the boundaries of the managed turf areas and the survey are provided in Appendix D.
The area of lawns in the study area was estimated by quantifying lawn coverage in randomly selected areas and extrapolating the results to the rest of the watershed. In 80 randomly selected areas with homogeneous land use, the total coverage of lawn was digitized using aerial imagery (as described above). These data were used to estimate the average percent of each developed land use class that was covered by residential lawns. The total area of lawns was then estimated by multiplying these percentages by the area covered by each developed land use class.
Fertilizer application rates for lawns and the percent of lawns that are fertilized in any given year were applied from the literature values. Appendix E contains details of the methods used to estimate lawn area and fertilization rates.
Animal waste was estimated by creating an inventory of priority livestock and pets and using the per animal nitrogen excretion rates from Van Horn (1998) , Boyer et al. (2002), ASAE (2005) and USDA (2009). Cattle, horses, dogs, and cats were identified as priority animals based on the animal totals for the four counties in the study area from the 2007 USDA Census of Agriculture and the American Veterinary Medical Association. These four species accounted for 97% of the nitrogen in animal waste. The number of these animals in each town in the study area was obtained from the State Department of Agriculture, State Veterinarian, individual farms, and formulas from the American Veterinary Medical Association. Watershed inputs from pet waste were estimated after taking into account expected rates of pet waste pick-up by owners reported
7
http://www.nass.usda.gov/research/Cropland/metadata/metadata_nh11.htm
8
Imagery for New Hampshire and Massachusetts areas
Page 9
in the literature on the subject. Details of the methods for estimated animal waste inputs are provided in Appendix F.
Human waste inputs through septic systems were estimated by determining the percent of the population in each census block that was not served by municipal sewer networks. The remaining population was assumed to use septic systems for waste disposal9. The sewered population was determined based on previous work by the USGS Water Demand Model for New Hampshire (Hayes and Horn, 2009), maps of sewer lines, and consultation with public works officials. The number of people residing in each census block was obtained from the 2010 U.S. Census. Each person was assumed to excrete 10.6 pounds of nitrogen per year (Valiela et al., 1997). Appendix G contains the details of methods used to determine the number of people who use septic systems for waste disposal in the study area.
All of the input datasets were collected between 2005 and 2012, with most between 2010 and 2012. The atmospheric deposition rates are specific to 2009, a year which experienced rainfall10 and hydrologic conditions that were typical for New England11 and, therefore, consistent with the model assumptions. Consequently, the modeled time period for this study most closely
represents conditions in 2009.
Transport Pathways
Within the Nitrogen Loading Model, the nitrogen imported from the sources described above is applied to different types of land use (or the subsurface through septic systems) and transported to the estuary through a groundwater pathway. A large fraction of the nitrogen that enters the watershed from these sources is permanently removed by denitrification to nitrogen gas. The remainder of the imported nitrogen is delivered from the watershed to the estuary. For septic systems within 200-meters of the estuary, the NLM assumes higher delivery rates, because there is too little space for significant nitrogen losses in the groundwater to occur. See Appendix H for details of the delivery factors for the groundwater transport pathways.
In the Great Bay Estuary watershed model, much of the nitrogen will follow the groundwater pathways per the default NLM. However, the soils in the Great Bay Watershed are not as sandy as those on Cape Cod. Some of the nitrogen applied to the land surface will be carried directly into surface waters by stormwater runoff. Therefore, a stormwater/surface water transport pathway was added to customize the NLM for conditions in the Great Bay Estuary. The components of this pathway are:
• Connected Impervious Area: Connected Impervious Area generates stormwater runoff that is carried directly into the stormwater drainage system and then discharged directly to surface waters. One hundred percent of the nitrogen applied to these areas was assumed to travel through the stormwater/surface water pathway.
• Lawn Area, Managed Turf, Agriculture, Natural Vegetation and Disconnected
Impervious Area: Most of the nitrogen applied to these land uses will be transported by
9
The model did not address the condition of individual septic systems (i.e. functioning correctly vs. failing).
10
Total annual precipitation in Greenland, NH in 2009 was 53.9 inches
11
Page 10
the default groundwater pathway. However, some fraction of the nitrogen is expected to be transported to surface waters by stormwater runoff when the infiltration capacity of the soils is exceeded. The average runoff from these land use types was estimated by an EPA Storm Water Management Model (SWMM) long-term simulation using the NRCS Curve Number method (see details in Appendix H). The runoff simulations were based on 10 years of daily weather data (2000-2011) and, therefore, are expected to be
representative of average conditions.
• Lake, River, and Estuary Areas: Nitrogen falling from the atmosphere directly onto surface waters does not pass through the groundwater pathway. One hundred percent of the atmospheric deposition onto surface waters was assumed to travel through the surface water pathway.
• Delivery Factor: Some of the nitrogen in the surface water pathway will be lost during transport. The Estuarine Loading Model (ELM), a companion model to the NLM from Valiela et al. (2004), was used to estimate these losses. Essentially, the ELM assumes the mean percent loss of nitrogen in freshwater streams is 13%. This factor does not change with travel time to the estuary. The delivery factors for the surface water pathway are described in Appendix H.
In addition to the distinct groundwater and stormwater/surface water pathways, nitrogen is likely transported through a mixture of these two pathways. Some nitrogen may initially enter the groundwater and then discharge to a river or lake before reaching the estuary. This combination pathway was too complicated to model. However, the effectsof this pathway are likely
accounted for by the stormwater/surface water pathway.
Results Summary
Summary tables, figures, and discussion of the results for the watershed draining to the Great Bay Estuary as a whole are provided in Section III of this report. The Great Bay Estuary watershed is a subset of the Piscataqua Region for which there is a strong interest in understanding non-point source nutrient loads.
The model was also run for subwatersheds and towns in the Piscataqua Region to provide local information to decision-makers. These results are provided in the form of figures and tables in Section V of this report.
The authors of the model determined the variability of the model based on its input parameters to be 38% for individual applications and 13% on average12. For this study, the NLM was run on multiple different study areas with the results summed, so the average variability is the relevant target value. For summary graphics, the results were expressed with error bars and were rounded to the same decimal place as the error bars. No rounding was performed on tables and figures other than the summary graphics in order to accommodate review without introducing round-off errors. However, all model results should be recognized to have an inherent uncertainty of +/-13%. Detailed methods for this study are provided in appendices as shown in Table 1.
12
Page 11
Table 1: List of Appendices Containing Detailed Methodologies for Nitrogen Import and Cycling
Source Land Use or Process Detailed Methods
Atmospheric Deposition Deposition on different land use types Appendix A (deposition rate) Appendix B through E (land use) Chemical Fertilizer Agricultural Lands Appendix C
Recreational Fields Appendix D
Lawns Appendix E
Animal Waste Manure on agricultural lands Appendix F Pet waste on different land use types Appendix F Human Waste Septic systems Appendix G Delivery Factors Surface water/groundwater
partitioning and transport pathways Appendix H
d. Model Validation
Input parameters for the model were researched in depth to obtain the best-available, local information to represent conditions in the Piscataqua Region. The chosen values were validated by comparisons to other studies to ensure accuracy.
The model output was validated using measurements of nitrogen loads from the eight major tributaries to the Great Bay Estuary. PREP (2012) used the most recent monthly data (2009-2011) on nitrogen concentrations at the head-of-tide to calculate the total nitrogen load from non-point sources in each of the eight major watersheds. These three years had yearly rainfall
between 53.1-64.8 inches per year. The NLM was run for these same watersheds. The model predictions were then compared to the measured loads to determine the accuracy of the model.
e. Quality Assurance
The model results were vetted by both internal and external review. An internal review was conducted by DES technical staff to verify the calculations and methods. An external review was completed by Dr. Ivan Valiela of the Marine Biological Laboratory at Woods Hole, MA.
f. Public Participation
DES developed two customized, geospatial datasets for this study. The first was a datalayer showing the percent of the population in each census block that uses a septic system for waste disposal. DES contacted each of the municipalities in the study area in August 2011 with a draft of this datalayer. DES accepted comments from the municipalities and revised the datalayer accordingly (Appendix G). The second datalayer showed the boundaries of every ball field, golf course, public parks, or other type of managed, recreation turf in the watershed. In October 2011, DES mailed maps of the managed turf boundaries to the organization responsible for maintaining them (e.g., municipalities, school districts, golf courses, etc.). DES accepted comments and revised the boundaries accordingly. DES also compiled results of a survey from the turf managers regarding turf fertilization practices (Appendix D).
Page 12
Page 13
Page 14
III. Results & Discussion
a. Validation of Model Input Parameters
The accuracy of any model depends on having correct input data. Each of the model input variables for the NLM was researched in depth to obtain the best available and local information to represent conditions in the Piscataqua Region. The chosen values were validated by
comparisons to other studies to ensure accuracy.
The atmospheric deposition rate for 2009 was determined to be 5.21 lb/ac/yr based on
measurements at a site near the center of the watershed in 2009 (Thompson Farm in Durham, NH). The chosen value was lower than the previous estimate of 6.24 lb/ac/yr in 2009 from Daley et al. (2010) because it takes into account the increasing trend in the wet-to-dry deposition ratio. The chosen value was confirmed by a regional deposition trending analysis that predicted a deposition rate of 5.79 lb/ac/yr based on emissions data for 2009. In addition, a regional air dispersion model was used to show that 63% of the nitrogen deposition in the Piscataqua Region was from sources outside of New Hampshire. The model also showed that 53% was from mobile sources, 27% was from power generation, and 20% was from area sources. The
atmospheric deposition rate of nitrogen is expected to decline by one-third by 2020 as a result of USEPA rules and programs requiring emission reductions (see Appendix A).
Impervious surfaces were found to cover 10% of the land area of the Piscataqua Region. By using the approach from Sutherland (1995), it was estimated that approximately one third of the impervious surfaces were Connected Impervious Area which discharged stormwater runoff directly to surface waters. PREP (2013) reported that 9.6% of the Piscataqua Region watershed was covered by impervious surfaces, which matches the estimate in this report (see Appendix B).
Agricultural lands covered 39,226 acres or 6% of the land area in the Piscataqua Region. The largest crop was hay (88% of the agricultural area) followed by alfalfa (5%), and corn (4%). Fertilizer application rates ranged from 63 lb N/ac for corn to 0 lb N/ac for alfalfa, which is a nitrogen fixing crop. Ruddy et al. (2006) reported county-level estimates of farm fertilizer use for the United States. The average farm fertilizer use in 1987-2001 was reported to be 348,047 and 364,133 pounds per year for Rockingham and Strafford counties, respectively. The estimate for Rockingham and Stafford Counties were 39% and 75% lower than the measured value, respectively. The difference between the estimated farm fertilizer use in 2011 and the measured values from 1987-2001 may be due to cost increases for fertilizer and changes in agricultural practices during this period (see Appendix C).
Page 15
consistent with other published values and/or recommendations. For example, Latimer and Charpentier (2010) used a value of 2.36 lb N/1000 ft2 for recreational fields for a study of nitrogen loads to estuaries in southern New England. The survey also found that the fertilized area of golf courses (fairways, greens, tees) typically amounted to 42% of the total golf course size, and that 87% and 61% of school and town fields, respectively, were fertilized in a given year. These percentages were used to prorate the fertilizer application rates for the model (see Appendix D).
Residential lawns were estimated to cover 19,077 acres in the Piscataqua Region (2.7% of the watershed), which is an order of magnitude more than managed turf and more than any other ‘crop’ besides hay. This finding matches previous work by Milesi et al. (2005) at the national level. The average lawn area in the Piscataqua Region ranged from 0.05 acres/home for high density development areas to 0.30 acres/home for open space areas. This range of values
appears to be credible because it brackets the value of 0.12 acres/home published by Latimer and Charpentier (2010). Based on a review of the literature, fertilizer use was estimated to occur on 54% of lawns in any given year at a rate of 2 lb N/1000 ft2 (see Appendix E).
In the 2007-2012 time period, there were approximately 2,468 horses, 2,572 cattle (mostly dairy), 83,430 dogs, and 94,037 cats in the Piscataqua Region watershed. These values are likely low estimates because they are largely based on surveys of commercial farms13 for horses and cattle, and estimations based on population for dogs and cats. Some of the feed and grass that is eaten by animals is grown in the watershed using either chemical fertilizer or atmospheric deposition as the source of nutrients. The Nitrogen Loading Model accounts for this cycling by assuming that 39% of the nitrogen applied to agricultural lands is “lost” to plants or the soil. When these plants are eaten by livestock, this nitrogen is remobilized and enters the model again in the animal waste component. Therefore, it is appropriate to treat animal waste as an
independent source of nitrogen (see Appendix F).
Slightly more than half of the people in the Piscataqua Region watershed used septic systems for waste disposal. The study showed that 177,548 of the 325,775 people (55%) in the watershed lived outside municipal sewer service areas. Maps of sewered areas from this study were checked by municipal officials for quality assurance (see Appendix G).
b. Validation of Model Output
The output of the NLM was validated using measurements of nitrogen loads from the eight major tributaries to the Great Bay Estuary (Figure 4 and Table 2). For watersheds with upstream wastewater treatment facilities, the delivered load from the facilities (accounting for losses during transport) was subtracted from the measured load at the tidal dam in order to isolate the non-point source load to compare to the non-point source model results. The graph on the left of
Figure 4 compares the measured and modeled loads in units of pound per year. The graph on the right shows the same data but normalized by watershed size and expressed as yields (lb/ac/yr). The uncertainty in each of the points is shown by error bars. Both graphs indicate good
13
Page 16
correspondence between the model results and actual measurements. The standard error of the regressions was 11-12% of the mid-point of the datasets.
Accuracy and simplicity are often competing objectives for modeling studies. Models can always be made more accurate through customization but then they are more difficult to explain and less transparent. Ultimately, models should be as simple as possible to achieve the
objectives of the study. In order to improve the fit of the model, customized nitrogen attenuation factors for each watershed would be required. This change would add significant complexity without corresponding benefit relative to the overall objectives of the study. Therefore, it was decided not to customize the model any further. The model provides reasonably accurate predictions of the non-point source loads from Great Bay watersheds within the expected
accuracy of 13%. However, the model may lose accuracy at smaller scales unless more detailed input datasets are used. The model results represent average weather conditions in the mid-2000s. Nitrogen loads may be higher or lower in any given year depending on the actual weather. The exact relationship between annual rainfall and non-point source loads is not clear at this time.
Table 2: WWTF and Non-Point Source Nitrogen from Great Bay Watersheds 2009-2011 (from PREP, 2012)
Watershed
Watershed Area (acres)
TN Load14
(lb/yr)
Upstream WWTF TN Load15 (lb/yr)
Non-Point Source TN Load (lb/yr)
Modeled Non-Point Source Load (lb/yr)
Winnicut River 9,000 38,280 0 38,280 34,700
Exeter River 68,677 178,620 0 178,620 197,785
Lamprey River 135,620 352,600 8,240 344,340 287,596
Oyster River 12,705 41,760 0 41,760 44,600
Bellamy River 17,449 47,080 0 47,080 42,474
Cocheco River 112,177 538,020 287,540 250,480 263,826
Salmon Falls River 150,662 344,560 40,620 303,940 278,096
Great Works River 55,483 119,720 3,080 116,620 108,656
14
TN loads estimated using USGS software "LOADEST" with water quality data from the PREP Tidal Tributary Monitoring Program and streamflow data from USGS.
15
The following wastewater treatment facilities (WWTFs) are located upstream of the tributary monitoring stations. The Epping WWTF is upstream of the Lamprey River station. The Rochester and Farmington WWTFs are
Page 17
Page 18
c. Model Output for the Great Bay Estuary Watershed
For the watershed draining to the Great Bay Estuary, the NLM predicts a non-point source nitrogen load of 800 tons per year (+/-100 tons/yr)16 (Figure 5). This estimate corresponds well with the most recent field measurement of the non-point source load (835 tons/yr) (PREP, 2013). The breakdown of nitrogen non-point sources from the model of delivered loads to the estuary is:
• Atmospheric Deposition – 42% (350 +/-50 tons/yr) – Out-of-state sources account for 62% of this source.
• Human Waste – 29% (240 +/-30 tons/yr) – This load is exclusively from septic systems because loads from wastewater treatment facilities were not considered in this study17. (The nitrogen load to the estuary from wastewater treatment facilities was 390 tons/yr in 2009-2011 (PREP, 2013). The combined contribution of nitrogen from human waste is 240 + 390, or 630 tons/yr).
• Chemical Fertilizer – 15% (130 +/-20 tons/yr) – Lawns contributed 70%, agricultural areas contributed 23% and recreational fields were responsible for 8% of this load. • Animal Waste - 14% (120 +/-20 tons/yr) – Livestock accounted for 58% of this load ,
while pet waste accounted for the remaining 42%.
Overall, 76% of the nitrogen added to the watershed is lost before it reaches the Great Bay estuary (Figure 6). The model predicts that 800 +/-100 of the 3,386 tons of nitrogen applied to the land surface or discharged to a septic system were delivered to the estuary. Measurements of nitrogen inputs and outputs for watersheds in the study area have shown similar levels of
nitrogen retention. Daley et al. (2010) reported that sub-basins of the Lamprey River watershed typically had nitrogen retention rates of 72 to 91%. The largest retention rates in the model are for natural vegetation and forests with a Hydrologic Soil Group of A (99.9%). The smallest retention rates are for runoff from connected impervious surfaces (13%). Therefore, nitrogen retention in a watershed generally decreases as development increases and more of the precipitation runs off the landscape as stormwater rather than infiltrating to the groundwater.
The model predicts that stormwater delivers 34% of the non-point source nitrogen to the Great Bay estuary (Figure 7). Stormwater is a transport pathway for nitrogen applied to lawns, agricultural lands, natural vegetation and urban lands. Approximately 42% of the nitrogen in stormwater comes primarily from impervious urban areas. The remaining 58% of nitrogen in stormwater originates from natural vegetation, agricultural lands and residential lawns, which contribute 29%, 15% and 14%, respectively. The model tracks stormwater from its point of origin as overland flow, it does not consider or track its point of entry into the estuary (i.e. stormwater outfalls). In other words, this report considers all stormwater as nonpoint source pollution even through some of that stormwater may enter the estuary through regulated point sources.
16
The modeled results have been rounded to the number of significant digits consistent with the uncertainty of the model. This rounding causes slight discrepancies in some totals and percentages.
17
Page 19
The atmospheric deposition model used for the study includes local emission sources. However, local emissions are averaged out over the model grid cells (12 km x 12 km). The upshot is that the model accurately predicts the total mass of nitrogen from vehicle emissions but may
underestimate the nitrogen deposition onto, and runoff from, impervious surfaces in urban areas. A number of studies have noted higher runoff rates for impervious surfaces than this model predicts (Davidson et al., 2009). However, there is no way to correct for this issue given the scale of this model. More detailed subwatershed models would be needed to more accurately predict the nitrogen load from impervious surface runoff, especially at the parcel or
neighborhood scales.
As a way to identify potential “hot spot” areas, the yield of non-point source nitrogen from each small HUC12 watershed was calculated. The yield is the number of pounds of non-point source nitrogen delivered from the subwatershed to the estuary divided by the area of the subwatershed. A map of the watershed draining to the Great Bay Estuary is shown in Figure 8. The yield of non-point source nitrogen from each subwatershed is color coded on the map. For the entire Piscataqua Region study area, the top twenty percent of subwatersheds had delivered non-point source yields between 3.6 and 4.7 lb/ac/yr. In the Great Bay Estuary watershed, 7 of 38 HUC12 subwatersheds yielded amounts of nitrogen in this highest category.
• Lower Cocheco River (HUC# 010600030608) • Squamscott River (HUC# 010600030806) • Winnicut River (HUC# 010600030901) • Oyster River (HUC# 010600030902) • Great Bay (HUC# 010600030904)
• Portsmouth Harbor (HUC# 010600031001)
• Berrys Brook-Rye Harbor (HUC# 010600031002)18
The NLM was used to estimate delivered non-point source nitrogen loads from each of the eight major watersheds draining to the Great Bay Estuary, each of the 40 subwatersheds in the region, and each of the 61 towns in the region. In general, the patterns of nitrogen in non-point sources were similar across the different watersheds. Figure 9 and
Figure 10 show comparisons between the major watersheds and the whole Great Bay Estuary. Atmospheric deposition, chemical fertilizers, and human waste were the major sources in most of the watersheds. Animal waste was also one of the major sources in the Lamprey and Oyster River watersheds. The non-point source nitrogen yield for the major watersheds ranged from approximately 1.9 to 4.2 lb/ac/yr, which brackets the average non-point source yield of 2.6 lb/ac/yr. The percent of the non-point source load delivered by stormwater was within a range of 28 to 43% for the major watersheds. Detailed tables and figures showing the NLM output results for each of the subwatersheds and towns in the Piscataqua Region are provided in Section V of this report. These results may be useful to communities or watershed groups in two important
18
Page 20
ways: 1) for prioritizing nitrogen reduction efforts; or 2) as a starting point for more detailed studies of non-point sources.
The nitrogen yield from temperate zone ecosystems in North America prior to human
disturbance has been estimated to be 0.7-1 lb/ac/yr (NRC, 2000 at 122, Howarth, 2008). For the Great Bay Estuary watershed, this ‘pre-development’ nitrogen load would amount to 227 to 315 tons/yr. In contrast, the total nitrogen load from the watershed from both non-point sources and wastewater treatment facilities was 1,225 tons/yr in 2009-2011 (PREP, 2013). Therefore,
nitrogen loads to the Great Bay Estuary are currently 4 to 5 times above pre-development levels. Another comparison can be made with the nitrogen loads from the Hubbard Brook Experimental Forest in North Woodstock, NH. Nitrogen yields of 1.2 lb/ac/yr from this forest (Bernal et al., 2012) reflect current atmospheric deposition rates but not human development on the ground because the watershed is pristine. For the Great Bay Estuary watershed, a yield of 1.2 lb/ac/yr would amount to nitrogen load of 408 tons/yr. Current loads are 3 times higher. These estimates of ‘background’ or ‘natural’ nitrogen loads are approximate. The exact amount of nitrogen currently delivered to the estuary from natural processes is unknown given that the nitrogen cycle in the Piscataqua Region is now dominated by human sources. However, these
comparisons provide useful reference points for understanding current nitrogen loads compared to what they might have been in the past or what would naturally occur with no development in the watershed.
Page 21
Page 22
Page 23
Page 24
Page 25
Figure 9: Percent of Non-Point Source Nitrogen Load from the Four Non-Point Sources in Each of the Major Watersheds Draining to the Great Bay Estuary
Page 26
Page 27
IV. References
Bernal, S., L.O. Hedlin, G.E. Likens, S. Gerber, and D.C. Busco. 2012. Complex response of the forest nitrogen cycle to climate change. Proceedings of the National Academy of Sciences
109: 3406-3411.
Bowen, J.L., Ramstack, J.M., Mazzilli, S., Valiela, I., 2007. NLOAD: an interactive, web-based modeling tool for nitrogen management in estuaries. Ecological Applications17: S17-S30.
Boyer, E.W., C.L. Goodale, N.A. Jaworski, and R.W. Howarth. 2002. Anthropogenic nitrogen sources and relationships to riverine nitrogen export in the northeastern U.S.A. Biogeochemistry57/58: 137-169.
Daley, M., J. Potter, E. DiFranco, and W.H. McDowell. 2010. Nitrogen Assessment for the Lamprey River Watershed. New Hampshire Water Resources Research Center, University of New Hampshire, Durham, NH. September 7, 2010. Published online:
http://des.nh.gov/organization/divisions/water/wmb/coastal/documents/unh_nitrogenasses sment.pdf.
Davidson, E. A., K. E. Savage, N. D. Bettez, R. Marino, and R. W. Howarth. 2009. Nitrogen in runoff from residential roads in a coastal area. Water, Air, & Soil Pollution210: 3-13. DOI 10.1007/s11270-009-0218-2.
DES. 2010. Analysis of Nitrogen Loading Reductions for Wastewater Treatment Facilities and Non-Point Sources in the Great Bay Estuary Watershed. Draft report. R-WD-10-22. New Hampshire Department of Environmental Services, Concord, NH. Published online:
http://des.nh.gov/organization/divisions/water/wmb/coastal/documents/gb_nitro_load_an alysis.pdf.
DES. 2012. Technical Support Document. Assessments of Aquatic Life Use Support in the Great Bay Estuary for Chlorophyll-a, Dissolved Oxygen, Water Clarity, Eelgrass Habitat, and Nitrogen. R-WD-12-5. New Hampshire Department of Environmental Services, Concord, NH. Published online:
http://des.nh.gov//organization/divisions/water/wmb/swqa/2012/documents/gbnitrogen-2012-303d-tsd.pdf.
Driscoll, C.T., D. Whitall, J. Aber, E. Boyer, M. Castro, C. Cronan, C.L. Goodale, P. Groffman, C. Hopkinton, K. Lambert, G. Lawrence, and S. Ollinger. 2003. Nitrogen pollution in the Northeastern United States: Sources, effects, and management options. Bioscience53: 357-374.
Galloway, J.N., J.D. Aber, J.W. Erisman, S.P. Seitzinger, R.W. Howarth, E.B. Cowling, and B.J. Crosby. 2003. The Nitrogen Cascade. Bioscience53: 341-356.
Page 28 Hayes, L. and Horn, M.A. 2009. Methods for Estimating Withdrawal and Return Flow by Census
Block for 2005 and 2020 for New Hampshire. U.S. Geological Survey Open-File Report 2009-1168, 32 p. Published online: http://pubs.usgs.gov/of/2009/1168.
Latimer, J.S., and M.A. Charpentier. 2010. Nitrogen inputs to seventy-four southern New England estuaries: Application of a nitrogen loading model. Estuarine and Coastal Shelf Science89: 125-136. doi: http://dx.doi.org/10.1016/j.ecss.2010.06.006.
Milesi, C., S.W. Running, C.D. Elvidge, J.B. Dietz, B.T. Tuttle, and R.R. Nemani. 2005. Mapping and modeling the biogeochemical cycling of turf grasses in the United States. Environmental Management36: 426–438. doi: 10.1007/s00267-004-0316-2.
NRC. 2000. Clean Coastal Waters: Understanding and Reducing the Effects of Nutrient
Pollution. National Research Council. National Academy Press, Washington DC. 405 pp.
PREP. 2012. Environmental Data Report. Piscataqua Region Estuaries Partnership, University of New Hampshire, Durham, NH. Published online: www.stateofourestuaries.org.
PREP. 2013. State of Our Estuaries 2013. Piscataqua Region Estuaries Partnership, University of New Hampshire, Durham, NH. Published online: www.stateofourestuaries.org.
Ruddy et al. 2006. County level estimates of nutrient inputs to the land surface of the
conterminous United States. Scientific Investigations Report 2006–5012. U.S. Geological Survey, National Water Quality Assessment Program, Reston, VA. Published online:
http://pubs.usgs.gov/sir/2006/5012/.
SAB, 2011. Reactive Nitrogen in the United States: An Analysis of Inputs, Flows,
Consequences, and Management Options. A Report of the EPA Science Advisory Board. EPA-SAB-11-013. August 2011. Published online:
http://yosemite.epa.gov/sab/sabproduct.nsf/67057225CC780623852578F10059533D/$Fil e/EPA-SAB-11-013-unsigned.pdf
Sutherland, R. 1995. Methodology for estimating the effective impervious area of urban watersheds. Technical Notes 58, Watershed Protection Techniques (1). Center for Watershed Protection. Published online:
http://www.pacificwr.com/Publications/Estimating_EIA.pdf
Valiela, I., G. Collins, J. Kremer, K. Lajtha, M. Geist, B. Seely, J. Brawley, and C.H. Sham. 1997. Nitrogen loading from coastal watersheds to receiving estuaries: New method and application. Ecological Applications, 7: 358-380.
Valiela, I., M. Geist, J. McClelland, and G. Tomasky. 2000. Nitrogen loading from watersheds to estuaries: Verification of the Waquoit Bay Nitrogen Loading Model. Biogeochemistry49: 277-293.
Page 29
V. Model Results for Subwatersheds and Municipalities in the
Piscataqua Region
The NLM was used to estimate delivered non-point source nitrogen loads from each of the nine major watersheds draining to the Great Bay Estuary or the Hampton-Seabrook Estuary, each of the 40 subwatersheds in the region, and each of the 61 towns in the region. For towns that were partially in the Piscataqua Region watershed, the model output is for the portion of the town inside the watershed. The modeled results have been rounded to the number of significant digits consistent with the uncertainty of the model. This rounding causes slight discrepancies in some totals and percentages.
Figures 12-20 show the nitrogen inputs and outputs from the nine major watersheds.
Figures 21-29 show the delivered non-point source nitrogen load by source type and land use for the nine major watersheds.
Figures 30-38 show the non-point source nitrogen load delivered by stormwater for each of the nine major watersheds.
Figures 39-47 show the yield of non-point source nitrogen from each study area inside the nine major watersheds. The yield is the number of pounds of non-point source
nitrogen delivered from the study area to the estuary divided by the area of the study area. For reference, the top twenty percent of study areas in the Piscataqua Region had yields between 4.2 and 9.2 pounds of delivered non-point source nitrogen per acre per year.
Figure 48 shows the delivered non-point source nitrogen yields from the 40 HUC12 subwatersheds in the Piscataqua Region. For reference, the top twenty percent of HUC12 subwatersheds in the Piscataqua Region had yields between 3.6 and 4.7 pounds of
delivered non-point source nitrogen per acre per year.
Figure 49 shows the delivered non-point source nitrogen yields from the 61
municipalities in the Piscataqua Region. For towns that were partially in the Piscataqua Region watershed, the yield value is for the portion of the town inside the watershed. For reference, the top twenty percent of municipalities in the Piscataqua Region had yields between 4.0 and 5.3 pounds of delivered non-point source nitrogen per acre per year.
Page 30
List of Figures
Figure 12: Inputs and Outputs of Non-Point Source Nitrogen by Source Type for the Winnicut River Watershed ... 32 Figure 13: Inputs and Outputs of Non-Point Source Nitrogen by Source Type for the
Exeter River Watershed ... 33 Figure 14: Inputs and Outputs of Non-Point Source Nitrogen by Source Type for the
Lamprey River Watershed ... 34 Figure 15: Inputs and Outputs of Non-Point Source Nitrogen by Source Type for the
Oyster River Watershed ... 35 Figure 16: Inputs and Outputs of Non-Point Source Nitrogen by Source Type for the
Bellamy River Watershed ... 36 Figure 17: Inputs and Outputs of Non-Point Source Nitrogen by Source Type for the
Cocheco River Watershed... 37 Figure 18: Inputs and Outputs of Non-Point Source Nitrogen by Source Type for the
Salmon Falls River Watershed... 38 Figure 19: Inputs and Outputs of Non-Point Source Nitrogen by Source Type for the
Great Works River Watershed ... 39 Figure 20: Inputs and Outputs of Non-Point Source Nitrogen by Source Type for the
Hampton-Seabrook Harbor/Atlantic Coast Watershed ... 40 Figure 21: Outputs of Non-Point Source Nitrogen by Source Type and Land Use Type for
the Winnicut River Watershed ... 41 Figure 22: Outputs of Non-Point Source Nitrogen by Source Type and Land Use Type for
the Exeter River Watershed ... 42 Figure 23: Outputs of Non-Point Source Nitrogen by Source Type and Land Use Type for
the Lamprey River Watershed ... 43 Figure 24: Outputs of Non-Point Source Nitrogen by Source Type and Land Use Type for
the Oyster River Watershed ... 44 Figure 25: Outputs of Non-Point Source Nitrogen by Source Type and Land Use Type for
the Bellamy River Watershed ... 45 Figure 26: Outputs of Non-Point Source Nitrogen by Source Type and Land Use Type for
the Cocheco River Watershed ... 46 Figure 27: Outputs of Non-Point Source Nitrogen by Source Type and Land Use Type for
the Salmon Falls River Watershed ... 47 Figure 28: Outputs of Non-Point Source Nitrogen by Source Type and Land Use Type for
the Great Works River Watershed ... 48 Figure 29: Outputs of Non-Point Source Nitrogen by Source Type and Land Use Type for
Page 31
Figure 33: Outputs of Non-Point Source Nitrogen Delivered Through Stormwater for the Oyster River Watershed ... 53 Figure 34: Outputs of Non-Point Source Nitrogen Delivered Through Stormwater for the Bellamy River Watershed ... 54 Figure 35: Outputs of Non-Point Source Nitrogen Delivered Through Stormwater for the Cocheco River Watershed... 55 Figure 36: Outputs of Non-Point Source Nitrogen Delivered Through Stormwater for the Salmon Falls River Watershed... 56 Figure 37: Outputs of Non-Point Source Nitrogen Delivered Through Stormwater for the Great Works River Watershed ... 57 Figure 38: Outputs of Non-Point Source Nitrogen Delivered Through Stormwater for the Hampton-Seabrook Harbor/Atlantic Coast Watershed ... 58 Figure 39: Non-Point Source Nitrogen Yield (pounds delivered per acre per year) for
Study Areas in the Winnicut River Watershed ... 59 Figure 40: Non-Point Source Nitrogen Yield (pounds delivered per acre per year) for
Study Areas in the Exeter River Watershed ... 60 Figure 41: Non-Point Source Nitrogen Yield (pounds delivered per acre per year) for
Study Areas in the Lamprey River Watershed ... 61 Figure 42: Non-Point Source Nitrogen Yield (pounds delivered per acre per year) for
Study Areas in the Oyster River Watershed ... 62 Figure 43: Non-Point Source Nitrogen Yield (pounds delivered per acre per year) for
Study Areas in the Bellamy River Watershed ... 63 Figure 44: Non-Point Source Nitrogen Yield (pounds delivered per acre per year) for
Study Areas in the Cocheco River Watershed ... 64 Figure 45: Non-Point Source Nitrogen Yield (pounds delivered per acre per year) for
Study Areas in the Salmon Falls River Watershed ... 65 Figure 46: Non-Point Source Nitrogen Yield (pounds delivered per acre per year) for
Study Areas in the Great Works River Watershed ... 66 Figure 47: Non-Point Source Nitrogen Yield (pounds delivered per acre per year) for
Study Areas in the Hampton-Seabrook Harbor/Atlantic Coast Watershed ... 67 Figure 48: Non-Point Source Nitrogen Yield (pounds delivered per acre per year) for
HUC12 Subwatersheds ... 68 Figure 49: Non-Point Source Nitrogen Yield (pounds delivered per acre per year) for
Towns ... 69
List of Tables
Table 3: Non-Point Source Nitrogen Output from Major Watersheds Delivered to the Estuary ... 70 Table 4: Non-Point Source Nitrogen Output from HUC12 Subwatersheds Delivered to
the Estuary ... 71 Table 5: Non-Point Source Nitrogen Output from Towns within the Piscataqua Region
Page 32
Page 33
Page 34
Page 35
Page 36
Page 37
Page 38
Page 39
Page 40
Page 41
Page 42
Page 43
Page 44
Page 45
Page 46
Page 47
Page 48
Page 49
Page 50
Page 51
Page 52
Page 53
Page 54
Page 55
Page 56
Page 57
Page 58
Page 59
Page 60
Page 61
Page 62
Page 63
Page 64
Page 65
Page 66
Page 67
Page 68
Page 69
Page 70
Table 3: Non-Point Source Nitrogen Output from Major Watersheds Delivered to the Estuary
Page 71
Page 72
Page 73
Page 74
Page 75
Page 76