ScholarlyCommons
Publicly Accessible Penn Dissertations
1-1-2014
Performance Modeling and Resource Management
for Mapreduce Applications
Zhuoyao Zhang
University of Pennsylvania, [email protected]
Follow this and additional works at:http://repository.upenn.edu/edissertations
Part of theComputer Sciences Commons
This paper is posted at ScholarlyCommons.http://repository.upenn.edu/edissertations/1517
For more information, please [email protected].
Recommended Citation
Zhang, Zhuoyao, "Performance Modeling and Resource Management for Mapreduce Applications" (2014).Publicly Accessible Penn Dissertations. 1517.
Performance Modeling and Resource Management for Mapreduce
Applications
Abstract
Big Data analytics is increasingly performed using the MapReduce paradigm and its open-source
implementation Hadoop as a platform choice. Many applications associated with live business intelligence are written as complex data analysis programs defined by directed acyclic graphs of MapReduce jobs. An
increasing number of these applications have additional requirements for completion time guarantees. The advent of cloud computing brings a competitive alternative solution for data analytic problems while it also introduces new challenges in provisioning clusters that provide best cost-performance trade-offs.
In this dissertation, we aim to develop a performance evaluation framework that enables automatic resource management for MapReduce applications in achieving different optimization goals. It consists of the
following components: (1) a performance modeling framework that estimates the completion time of a given MapReduce application when executed on a Hadoop cluster according to its input data sets, the job settings and the amount of allocated resources for processing it; (2) a resource allocation strategy for deadline-driven MapReduce applications that automatically tailors and controls the resource allocation on a shared Hadoop cluster to different applications to achieve their (soft) deadlines; (3) a simulator-based solution to the resource provision problem in public cloud environment that guides the users to determine the types and amount of resources that should lease from the service provider for achieving different goals; (4) an
optimization strategy to automatically determine the optimal job settings within a MapReduce application for efficient execution and resource usage. We validate the accuracy, efficiency, and performance benefits of the proposed framework using a set of realistic MapReduce applications on both private cluster and public cloud environment.
Degree Type
Dissertation
Degree Name
Doctor of Philosophy (PhD)
Graduate Group
Computer and Information Science
First Advisor
Boon T. Loo
Second Advisor
Insup Lee
Keywords
PERFORMANCE MODELING AND RESOURCE
MANAGEMENT FOR MAPREDUCE APPLICATIONS
Zhuoyao Zhang
A DISSERTATION in
Computer and Information Science
Presented to the Faculties of the University of Pennsylvania in Partial Fulfillment of the Requirements for the Degree of Doctor of Philosophy
2014
Boon Thau Loo Associate Professor,
Computer and Information Science Supervisor of Dissertation
Insup Lee
Cecilia Fitler Moore Professor, Computer and Information Science
Co-Supervisor of Dissertation
Val Tannen
Professor, Computer and Information Science Graduate Group Chairperson
Dissertation Committee
Zachary Ives (Chair), Associate Professor, Computer and Information Science
Susan Davidson, Weiss Professor, Computer and Information Science
Andreas Haeberlen, Raj and Neera Singh Assistant Professor, Computer and
Information Science
MAPREDUCE APPLICATIONS
COPYRIGHT
2014
From the first day I joined the Ph.D program in Penn, I have spent five
fruit-ful years in this group until finally, my research work comes into this dissertation.
Here, I would like to express my deepest gratitude to my advisor, my
collabora-tors, my friends and family and other individuals who support me through these
years. Without their help, it is not possible for me to go this far.
First of all, I would like to thank my advisors, Professor Boon Thau Loo and
Insup Lee who offered me the opportunity to pursue graduate studies at Penn and
guided me through my research work. Insup provided me great support during
my early years by exposing me to different research areas through our discussions.
He also introduced me the work of real-time system which later helps me form
the initial idea of my dissertation work. Boon have been extremely supportive
through each step during my study. He gave me valuable advice on shaping my
research directions, refining theoretical approaches as well as on technical details
like designing experiments and analyzing results. He is also a great mentor who
is open minded and willing to encourage students exploring new ideas, so that I
could have freedom to choose research topics I am interested. I have learned from
him not only the research skill, but also the importance of collaboration, passion
about work, self-discipline and life balancing.
Next, I would like to thank Dr. Lucy Cherkasova who is my mentor during
my internship in HP Labs. We worked together for two summers and have been
kept collaborating remotely for more than two years. It was an exciting and fruitful
working experience, during this time period, we have published papers on several
work in different occasions. All this could be achieved without her help. Lucy
is especially patient and considerate in mentoring my research work as well as
other aspects in my Ph.D life. I remember she walked through every page of my
slides in preparing my talk and rehearsal multiple times with me even for internal
presentations and that really helps me to clear my thoughts and is especially useful
when I need to explain my works to other researchers later. The time we spent in
HP Labs has been one of the most precious pieces of memory in my life.
I would also like to thank my collaborators. Among them, I would like to first
thank Dr. Godfrey Tan who I worked with in my first project on job scheduling
in large-scale distributed systems and encouraged me a lot during my first years
as a Ph.D student. Dr. Linh T.X. Phan who is now a research assistant
profes-sor in Penn has a profound influence on my early research. She first brought the
idea to introduce theories from real-time system into the parallel data processing
platform which inspired me for my later works. I was also fortunate enough to
col-laborate with many other individuals from different places. Saumya Jain and Qi
Zheng who were Penn graduate students and worked with me on several projects.
I appreciate a lot for their help in system implementation and experiments.
Ab-hishek Verma and Feng Yan are my collaborators during my summer intern and
we worked together on MapReduce related problems from whom I have learnt
a lot about Hadoop system. I also had a great time work with other students in
the group such as Sanchit Aggarwal, Yang Li and Harjot Gill, who broadened my
horizon, and enabled me to explore different types of problems outside my core
research area.
This dissertation benefited from many great suggestions provided by my
the-sis committee members, professor Zachary Ives who is also my WPE-II committee
chair, professor Susan Davidson and Andreas Haeberlen who provided me
valu-able advise through the write up.
In addition, I have to thank members from the NetDB group: Wenchao Zhou,
Changbin Liu, Anduo Wang, Mengmeng Liu, Alex Gurney and Ling Ding, all
would like to give my special thanks to Mike Felker for helping me go through
many tedious details of administrative tasks, and also to Cheryl Hickey and many
other wonderful staff who make my life much easier.
Besides my research work, I want to thank my friends that colors my life after
work. Special thanks to my best friend Lin Shao who listened to me and stayed
with me through my hard times. My current and previous roommates: Qi Zhang,
Jie Li, Xiang Yang, Weiyu Zhang, Yanfei Wang, Jiechang Hou, Matt Malloy,
Han-jun Xiao, Yang Wu for those memorable times we shared together. Also friends I
made these years: Zhuowei Bao, Chen Chen, Naobo Chen, Jian Chang, Qing
D-uan, Pengfei Huang, Zhihao Jiang, Dong Ling, Gang Song, Shaohui Wang, Meng
Xu, Zhepeng Yan, Yifei Yuan, Mingchen Zhao, Jianzhou Zhao and many others.
My research was funded in part by the following funding agencies and sources:
NSF CNS-1117185, CNS-1040672, CNS-0834524, CNS-0845552, IIS-0812270 and ARO
grant W911NF-11-1-0403.
Last but not least, I dedicate this dissertation to my parents, Yongting Zhang
and Xunjian Liu for their selfless love. They have made great sacrifice to support
my study abroad and my dreams. In the past five years, I spent very little time
with them which I believe has made their life much more difficult especially I am
the only child in the family, but they never complied a word about that. It would
ABSTRACT
PERFORMANCE MODELING AND RESOURCE MANAGEMENT FOR
MAPREDUCE APPLICATIONS
Zhuoyao Zhang
Boon Thau Loo Insup Lee
Big Data analytics is increasingly performed using the MapReduce paradigm
and its open-source implementation Hadoop as a platform choice. Many
applica-tions associated with live business intelligence are written as complex data
analy-sis programs defined by directed acyclic graphs of MapReduce jobs. An increasing
number of these applications have additional requirements for completion time
guarantees. The advent of cloud computing brings a competitive alternative
solu-tion for data analytic problems while it also introduces new challenges in
provi-sioning clusters that provide best cost-performance trade-offs.
In this dissertation, we aim to develop a performance evaluation framework
that enables automatic resource management for MapReduce applications in
achiev-ing different optimization goals. It consists of the followachiev-ing components: (1) a
performance modeling framework that estimates the completion time of a given
MapReduce application when executed on a Hadoop cluster according to its
in-put data sets, the job settings and the amount of allocated resources for processing
it; (2) a resource allocation strategy for deadline-driven MapReduce applications
that automatically tailors and controls the resource allocation on a shared Hadoop
cluster to different applications to achieve their (soft) deadlines; (3) a
simulator-based solution to the resource provision problem in public cloud environment that
guides the users to determine the types and amount of resources that should lease
from the service provider for achieving different goals; (4) an optimization strategy
to automatically determine the optimal job settings within a MapReduce
applica-tion for efficient execuapplica-tion and resource usage. We validate the accuracy,
efficien-cy, and performance benefits of the proposed framework using a set of realistic
Contents viii
1 Introduction 1
1.1 Motivation . . . 2
1.2 Contributions of the dissertation . . . 3
1.2.1 Contribution 1: performance modeling framework for MapRe-duce applications . . . 4
1.2.2 Contribution 2: resource allocation for deadline-driven MapRe-duce applications . . . 5
1.2.3 Contribution 3: resource provision in public cloud environ-ment . . . 6
1.2.4 Contribution 4: performance optimization for MapReduce applications . . . 7
1.3 Overview of dissertation . . . 8
2 Background 10 2.1 MapReduce framework . . . 10
2.2 Pig programs . . . 12
3 Performance Modeling Framework 15 3.1 Platform performance model . . . 17
3.1.1 Profiling MapReduce phases . . . 17
3.1.2 Microbenchmarks . . . 21
3.1.4 Accuracy of the platform performance model . . . 27
3.2 MapReduce job model . . . 31
3.2.1 Estimate task durations within a job . . . 32
3.2.2 Performance model for a single MapReduce job . . . 34
3.2.3 Accuracy of the MapReduce job model . . . 36
3.3 MapReduce workflow peformance model . . . 45
3.3.1 Estimate input data size through the worklfow . . . 45
3.3.2 Modeling MapReduce workflows with sequential jobs . . . . 47
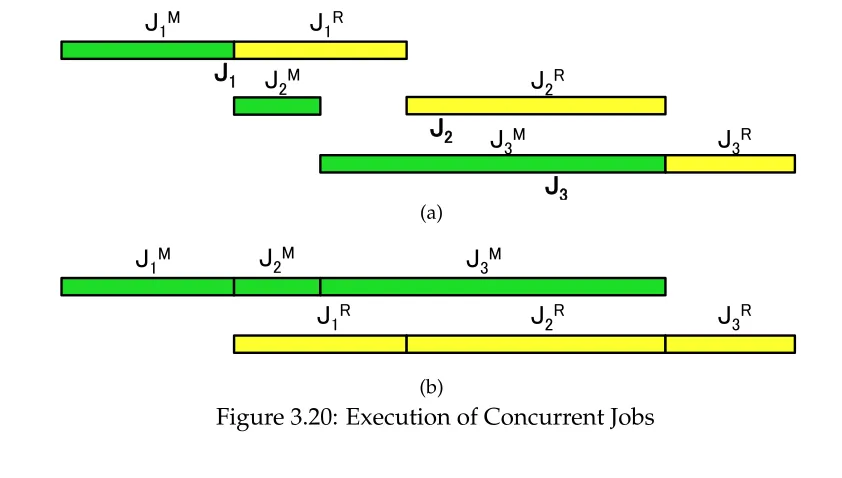
3.3.3 Modeling MapReduce workflows with concurrent jobs . . . . 53
3.4 Model sensitivity . . . 59
3.4.1 Impact of sample data size . . . 59
3.4.2 Impact of input data on the map function performance . . . . 61
3.4.3 Impact of data skew in reduce stage . . . 62
3.4.4 Variability of job profiles in public cloud environment . . . 64
3.5 Conclusion . . . 66
4 Resource Management for MapReduce Applications 68 4.1 Deadline-driven resource allocation on shared Hadoop cluster . . . . 69
4.1.1 Resource allocation for single MapReduce job . . . 70
4.1.2 Resource allocation for MapReduce workflows: a basic ap-proach . . . 71
4.1.3 Schedule concurrent jobs within a workflow . . . 75
4.1.4 Resource allocation for MapReduce workflows: a refined ap-proach . . . 80
4.1.5 Deadline-driven job scheduler . . . 84
4.2 Resource provisioning in public cloud environment . . . 88
4.2.1 Solution framework . . . 90
4.2.2 Resource provision for homogeneous cluster . . . 97
4.2.3 Resource provision for heterogeneous cluster . . . 105
5.1 Motivation . . . 116
5.1.1 Why not use best practices? . . . 117
5.2 Problem definition and the solution outline . . . 119
5.2.1 Two optimization strategies . . . 121
5.3 Evaluation results . . . 125
5.3.1 Experimental workloads . . . 126
5.3.2 Performance optimization benefits . . . 127
5.3.3 Performance benefits of the optimization strategies . . . 129
5.4 Conclusion . . . 131
6 Related Work 133 6.1 Performance model for MapReduce applications . . . 133
6.2 Resource management for MapReduce jobs . . . 136
6.3 MapReduce performance optimizations . . . 140
7 Conclusion 142 7.1 Summary . . . 142
7.2 Future work . . . 143
List of Tables
3.1 Relative error distribution . . . 29
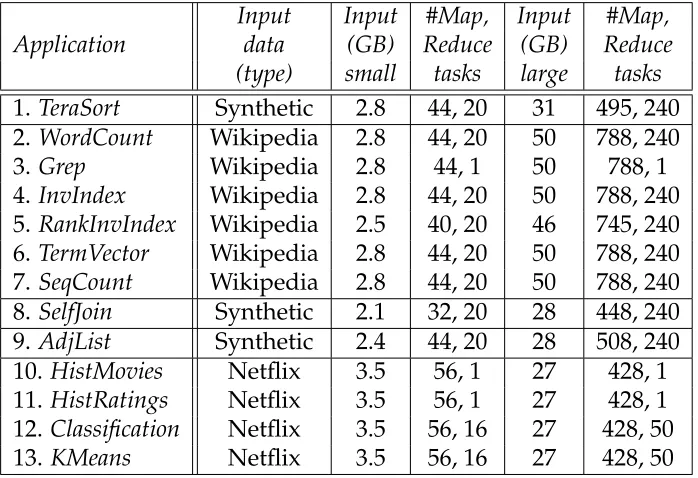
3.2 Application characteristics. . . 38
3.3 UPenn cluster description. . . 40
3.4 EC2 Testbed description. . . 41
3.5 Job profiles ofAdjliston UPenn cluster. . . 44
3.6 Job profiles ofWordCounton UPenn cluster. . . 44
3.7 Processing time per record forKMeanswith different number of initial centroids. 62 3.8 Measured and predicted completion times forKMmeans . . . 63
3.9 Job profiles on the EC2 cluster with small instances (time in sec) . . . 66
3.10 Job profiles on the EC2 cluster with medium instances (time in sec) . . . 66
3.11 Job profiles on the EC2 cluster with large instances (time in sec) . . . 67
4.1 CPU types used by different EC2 instances. . . 90
4.2 Application characteristics. . . 110
4.3 Cluster provisioning results for workloadW1. . . 112
4.4 Cluster provisioning results for workloadW2. . . 112
4.5 Cluster provisioning results for workloadW3. . . 112
5.1 Notation Summary . . . 122
1.1 Overview of the dissertation . . . 8
2.1 Architecture of MapReduce framework . . . 11
2.2 Example of a Pig program’ execution plan represented as a DAG of MapRe-duce jobs. . . 13
3.1 Ensemble of Models. . . 16
3.2 MapReduce Processing Pipeline. . . 17
3.3 A fragment of a platform profile forreadandcollectphases. . . 23
3.4 Benchmark results. . . 26
3.5 Shuffle phase model for Hadoop where each JVM (slot) configured with 2GB of memory. . . 27
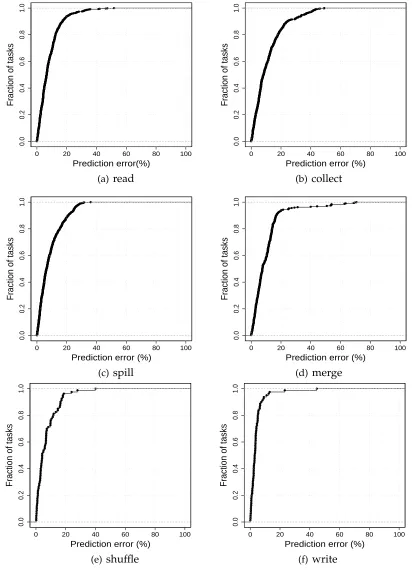
3.6 CDF of prediction error. . . 28
3.7 Validating the accuracy of the platform performance model on thesmall 5-node test cluster. . . 30
3.8 Validating the accuracy of platform performance model on the large 66-node production cluster. . . 30
3.9 MapReduce Performance Model. . . 32
3.10 Predicted vs. measured completion times of 13 applications on thesmall 5-node test cluster. . . 39
3.11 Predicted vs. measured completion times of 13 applications (with a large input dataset) on thelarge 66-node production cluster. . . 39
3.12 Predicting the job completion time in the UPenn cluster. . . 42
3.14 A special case of jobs with a single reduce task: their possible executions on the
heterogeneous EC2 cluster. . . 44
3.15 Predicted and measured completion time for PigMix with 128x64 slots. . . 49
3.16 Predicted and measured completion time for PigMix with 64x64 slots. . . 50
3.17 DAGs of Pig programs in the TPC-H and HP Labs Proxy query sets. . . 50
3.18 Predicted and measured completion time for TPC-H and Proxy queries execut-ed with 128x64 slots. . . 52
3.19 Difference in executions of (a) two sequential MapReduce jobs; (b) two concur-rent MapReduce jobs. . . 54
3.20 Execution of Concurrent Jobs . . . 56
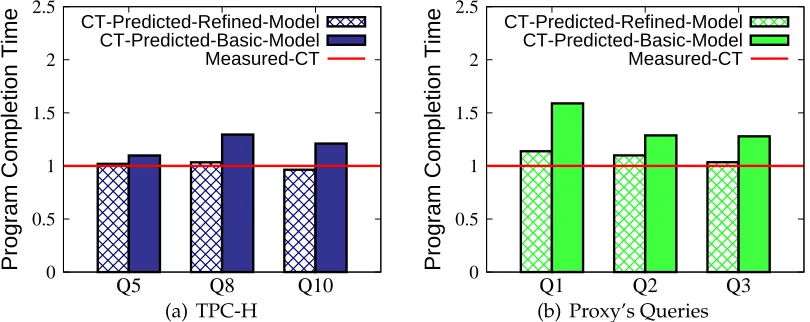
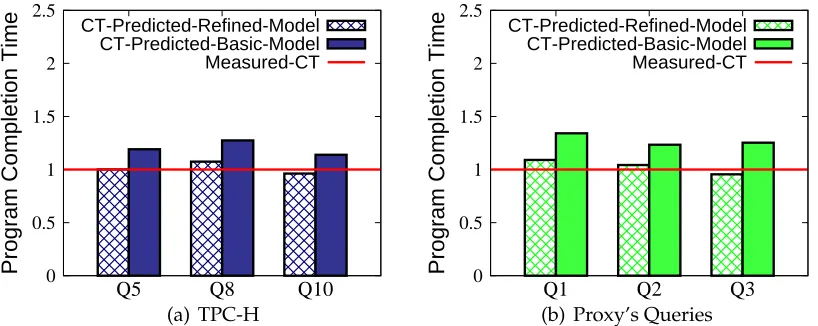
3.21 Predicted completion times usingbasicvsrefinedmodels (128x64 slots). . . 57
3.22 Predicted completion times usingbasicvsrefinedmodels (32x64 slots). . . 58
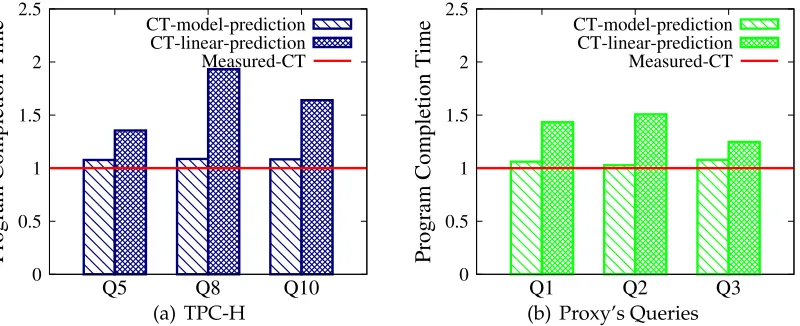
3.23 Predicted completion time using linear extrapolation (128x64 slots). . . 59
3.24 Impact of sample data size on completion time estimates . . . 60
3.25 Profile forTPC-H Q10with different input data size (scale factor). . . 61
3.26 Predicted vs measured stage durations forKMeans application with different number of reduce tasks (i.e.,K = 16andK = 50). . . 64
4.1 Resource allocations satisfy a given deadline . . . 71
4.2 PigMix executed with the estimated resources: do we meet deadlines? . . . 74
4.3 TPC-H/Proxy queries with the estimated resources: do we meet deadlines? . . 75
4.4 Impact of concurrent job scheduling on their completion time. . . 76
4.5 Example of Johnson’s Algorithm. . . 78
4.6 Measured completion times for different schedules of concurrent jobs in TPC-H queries. . . 79
4.7 Measured completion times for different schedules of concurrent jobs in Proxy queries. . . 80
4.8 Resource allocation estimates for an optimized Pig program. . . 81
4.9 TPC-H Queries: efficiency of resource allocations withrefinedapproach. . . 84
4.10 Proxy’s Queries: efficiency of resource allocations withrefinedapproach. . . 84
stances. . . 89
4.13 Simulator. . . 93
4.14 Simulator validation. . . 96
4.15 Solution Outline. . . 97
4.16 Job completion times on different EC2-based Hadoop clusters. . . 101
4.17 Normalized completion times on different EC2-based clusters. . . 101
4.18 Analysis ofW1on the three platforms. . . 102
4.19 Analysis ofW2on the three platforms. . . 104
4.20 Possible benefits with heterogeneous cluster. . . 105
4.21 Performance versus cost trade-offs for different applications. . . 106
4.22 Performance versus cost trade-offs for different workloads. . . 111
5.1 Motivating Examples. . . 117
5.2 Effect of reduce task settings for processing the same job with different input dataset sizes. . . 118
5.3 Effect of reduce task settings when only a fraction of resources is available. . . 119
5.4 Example workflow with 3 sequential jobs . . . 120
5.5 Example of the local optimization strategy . . . 123
5.6 MapReduce workflows for TPC-H and Proxy queries. . . 126
5.7 Workflow model validation forTPC-H Q1andTPC-H Q19. . . 128
5.8 Local and global optimization strategies: resource usage with differentw increase thresholds. . . 129
Chapter 1
Introduction
Data-intensive analytic applications have become core to the functions of the
mod-ern enterprises. Large companies like Google, Facebook, and LinkedIn are
pro-cessing and analyzing Terabytes of data every day. These data analytic tasks range
from business intelligent analytics [29], social network connection analysis [16], to
more advanced scientific data analysis and machine learning applications [89] and
the amount of data produced daily is exploding [15].
The enterprises and organizations are experiencing a paradigm shift towards
large-scale data intensive computing. Many of them are increasingly using the
MapReduce paradigm [21] and its open-source implementation Hadoop [72] as a
platform choice for theirBig Dataanalysis as it offers a simple and powerful
frame-work for processing large data sets on distributed systems: the program logic is
simply expressed by the mapand reducefunctions and the MapReduce execution
engine will automatically execute the application in parallel on a set of nodes,
co-ordinate their executions and handle failures transparently.
For more complex data analytics, several projects, such as Pig [26], Hive [63],
Scope [17], and Dryad [32] provide high-level SQL-like abstractions on top of
MapReduce engines to raise the level of abstraction for processing large data sets.
These frameworks allow data analysts to specify complex analytic tasks without
directly writing map and reduce functions and will compile the specified program
automatically intodirected acyclic graphs(DAGs) of MapReduce jobs which we
1.1
Motivation
Though first introduced for batch-oriented workloads, there is recently an
emerg-ing technological trend to shift towards usemerg-ing MapReduce and the frameworks on
top of it in support oflatency-sensitiveapplications, e.g., personalized
recommen-dations [19], advertisement placement [18], real-time web indexing [24] etc. These
applications are typically a part of an elaborate business pipeline, and have to
pro-duce results by a certain deadline. There is a need for a mechanism that could
automatically tailor and control resource allocations for different applications in
shared MapReduce clusters to achieve their (soft) deadlines. Unfortunately, the
existing Hadoop implementation does not support resource management for such
latency sensitive applications.
On the other hand, the advent of cloud computing provides a new delivery
model with virtually unlimited resources. It allows the customers to deploy their
Hadoop clusters by leasing computing and storage resources offered by the cloud
providers. One of the open questions in such environments is to determine the
right resource provision strategy i.e. the choice and the amount of resources that
a user should lease from the service providers to achieve performance goals for
their MapReduce applications. Moreover, instead of a fixed capital investment that
made up-front as for original private cluster, cloud providers offer a more
cost-efficient option for many users in a ”pay-as-you-go” fashion, i.e., the customers
only pay for the time they used the rented resources. As a result, the monetary
cost for executing the user’s workloads becomes another optimization goal which
should be considered in making the cluster provision decision.
The solutions to the above problems rely on a profound understanding of the
relationship between the execution performance of a given MapReduce
applica-tion and the amount of resources available for processing it. Currently, there is a
lack of performance models that could accurately predict the completion time for
a given MapReduce application according to its input dataset(s), the job settings
1.2. Contributions of the dissertation
performance model because of nondeterminism during the execution due to the
interference of applications in a shared cluster, the non-uniform data distribution
and the heterogeneity of the hardware.
Based on the above motivation, the goal of this dissertation is therefore to
develop a performance evaluation framework that enables automatic resource
management for MapReduce applications in achieving different optimization
goals. Towards developing such performance evaluation framework, we need to
address the following challenges:
• Automation: The desired framework should automatically control the
re-source management with minimal manual interventions and work
seamless-ly with the Hadoop distribution.
• Accuracy: The desired framework should be sufficiently accurate in
predict-ing the application completion time or required amount of resources even
with the presence of system nondeterminism.
• Efficiency: The desired framework should be efficient and able to provide
timely response in support of latency sensitive applications in online
envi-ronment.
• Generality: The desired framework should be applied to different
applica-tions, e.g., complex MapReduce workflows and Hadoop clusters, e.g.,
het-erogeneous cluster that consists of different type of hardwares.
1.2
Contributions of the dissertation
In this dissertation, we aim to develop a performance evaluation framework that
enables automatic resource management for MapReduce applications in
achiev-ing different optimization goals. The techniques we use combine of mathematical
analysis, benchmarking, simulation, implementation, deployments and empirical
measurements on both private cluster and public cloud platform. We focus on
Hadoop – the most widely used open source implementation of MapReduce
Hadoop for expressing a broad variety of data analysis tasks to build our model.
While the results provided in this dissertation are based on the Hadoop and Pig
experience, we believe that the proposed models and resource management
strate-gies are general and can be applied for application executed on similar frameworks
such as Hive and Dryad.
A more detailed description about the contributions of this dissertation is
pre-sented as follows.
1.2.1
Contribution 1: performance modeling framework for
MapReduce applications
Problem: To enable resource management for MapReduce applications, the first
challenging problem is to understand the relationship between the performance
and the amount of resource available for executing the application. It requires
a performance model which is able to estimate the completion time of a given
MapReduce application according to different amount of computing resources.
The estimated completion time also depends on the performance of the platform
hardware, the input data sets, the job settings and could be affected by the
per-formance uncertainty caused by resource contention on a shared cluster. While
there have been some research efforts [45, 28, 64, 66] towards developing
perfor-mance models for MapReduce jobs, these techniques either rely on simplified
as-sumptions or do not apply to complex applications that are expressed as a DAG of
MapReduce jobs.
Solution: To solve the problem, we build a performance modeling framework [82,
86, 85, 88] which can accurately predict the completion time of a given
applica-tion that consists of single or a DAG of MapReduce jobs according to its input
dataset(s), the job settings and the amount of allocated resources. It consists of an
ensemble of performance models that orchestrate the performance prediction at
1.2. Contributions of the dissertation
• Aplatform performance modelthat estimates a phase duration as a function of
processed data at the Hadoop level.
• AMapReduce job modelthat is used to predict a single MapReduce job
execu-tion time as a funcexecu-tion of allocated resources.
• Aworkflow performance modelthat combines all parts together for evaluating
the completion time of complex application which represented as a DAG of
MapReduce jobs.
1.2.2
Contribution 2: resource allocation for deadline-driven
MapReduce applications
Problem: In the enterprise setting, users would benefit from sharing Hadoop
clusters and consolidating diverse applications over the same datasets. With the
trend towards using MapReduce for latency sensitive applications, there is a
chal-lenge to automatically tailor and control resource allocations on such shared
clus-ters for different applications to achieve their (soft) deadlines. The existing Hadoop
implementation does not support resource management for those applications:
The original scheduler employed in Hadoop is a simple FIFO scheduling policy
that assigns all available resource to each job according to their submission time.
The Fair scheduler [8] and Capacity scheduler [2] introduced later try to share the
cluster resource among the running jobs either according to the job size or
parti-tioned resource pool, but none of them aims to provide resource allocation in order
to satisfy the completion time requirement for the applications.
Solution: We solve this problem using our deadline-driven resource allocation
strategy based on our performance modeling framework [87, 85, 88]. Once we are
able to estimate the application completion time according to the resource
alloca-tion, we could also solve the related problem that is to estimate the appropriate
amount of resources required for completing an application with a given (soft)
deadline. We first propose a simplebasicapproach which works efficiently for
works for more complex applications that contain both sequential and
concurren-t jobs. Towards solving concurren-this problem, we also opconcurren-timize an applicaconcurren-tion execuconcurren-tion
by enforcing the optimal schedule of its concurrent jobs. Such optimization helps
reducing the total completion time, and more importantly, it eliminates possible
non-determinism of concurrent jobs’ execution in the workflow, and therefore,
en-ables a more accurate performance and resource requirement prediction.
1.2.3
Contribution 3: resource provision in public cloud
environment
Problem: In contract to the private cluster, the advent of cloud computing
pro-vides an attractive alternative option to customers for provisioning a suitable size
Hadoop cluster, consuming resources as a service, executing the MapReduce
work-load, and paying for the time these resources were used. One of the open questions
in such environments is the choice of types and amount of resources that a user
should lease from the service provider for optimizing both the performance and
cost objectives. Specifically, the problem we are trying to solve in the dissertation
is: given a workload, determine a Hadoop cluster(s) configuration (i.e., the
num-ber and types of VMs, and the job schedule) that provides best cost/performance
trade-offs: i) minimizing the cost (budget) while achieving a given makespan
tar-get, or ii) minimizing the achievable jobs makespan for a given budget.
Solution: We offer a simulation-based framework for solving this problem [84,
83]. We first extract job profiles by executing the workloads on different
(interest-ed) platforms. Then, for each platform and a given Hadoop cluster size, we
deter-mine the optimized MapReduce job schedule i.e., the execution order of the jobs in
the workloads. After that, our event based MapReduce simulator will take the job
profiles and the schedules as inputs and output the simulated makespan/costs for
executing the workloads. We first provide our solution for homogeneous clusters
1.2. Contributions of the dissertation
extend the approach for a heterogeneous solution that consists of sub-clusters of
different types.
1.2.4
Contribution 4: performance optimization for MapReduce
applications
Problem: Optimizing the execution efficiency of MapReduce jobs is an open
chal-lenge and has been studied from different perspectives [75, 28, 46, 71,?, 79]. In this
dissertation, we focus on improving the execution performance for MapReduce
applications by automatically tuning the job settings. i.e, the number of reduce
tasks in each job as such parameter could significantly impact the total
comple-tion time as well as the resource usage. Determining the right number of reduce
tasks is non-trivial: it depends on the input sizes of the job, on the Hadoop cluster
size, and the amount of resources available for processing this job. This problem
is more complicated for applications defined as MapReduce workflows given the
data dependency of the jobs: the output of the previous job becomes the input of
the next job, as a result, the job settings of the previous job could also have an
impact on the map execution of the next job so as the entire completion time.
Cur-rently, it is solely the user’s responsibility to configure the number of reduce tasks
for each MapReduce job within the application. Such manual, experience based
configuration probably leads to inefficient results.
Solution: Based on our performance modeling framework, we provide an
au-tomatic way for guiding the user efforts of tuning the reduce task settings in a
MapReduce application while achieving different performance objectives [80, 81].
It contains two strategies for analyzing the performance trade-offs, i.e., to optimize
the completion time while minimize the resource usage for its execution: alocal
op-timization that searches for trade-offs at a job level, and aglobaloptimization that
1.3
Overview of dissertation
Hadoop cluster
Performance modeling framework (Chapter 3)
Platform performance model MapReduce job model Workflow performance model
Resource management (Chapter 4) Performance
optimization with
optimal job settings
(Chapter 5) Input data Workflow structure Job profiles Completion time target
Deadline-driven resource allocation
Resource provision in public cloud
Resource allocation Job settings
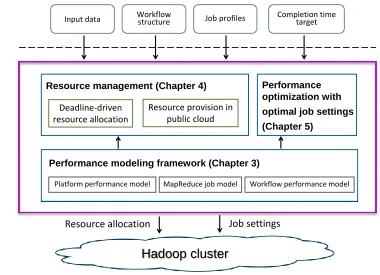
Figure 1.1: Overview of the dissertation
Figure 1.1 presents an overview of our solution framework which shows the
different components within the system and their connections. The rest of this
dissertation is organized as follows: we first start by introducing the background
on the MapReduce framework, its open source implementation Hadoop and the
Pig system built on top of it in Chapter 2.
In Chapter 3, we introduce the performance modeling framework with a
de-tailed description on each consisting performance model and demonstrate that
the framework can accurately estimate the completion time of a given MapReduce
application according to its input data sets and the amount of allocated resources.
In Chapter 4, we propose our resource management solutions by first
intro-ducing our resource allocation strategy for supporting multiple latency sensitive
MapReduce applications executed on a shared Hadoop cluster. After that, we
1.3. Overview of dissertation
from public cloud providers that provides the best cost/performance trade-offs for
a given MapReduce workload.
In Chapter 5, we introduce our optimization strategy for MapReduce
applica-tions through tuning the job settings for better performance and resource usage.
We propose both a local and a global optimization algorithms that applies on the
job and workflow level respectively.
Chapter 6 describes the related work on performance modeling, resource
man-agement and optimization for MapReduce related platforms. Chapter 7
sum-maries the dissertation work and proposes a few directions for future research
Background
This chapter provides a basic background on the MapReduce framework [20, 21]
and its open source implementation Hadoop [9, 72] as well as a framework built
on top of it: the Pig system [26] that offers a higher-level abstraction for expressing
more complex analytic tasks using SQL-style constructs.
2.1
MapReduce framework
The MapReduce framework was first introduced by Google [21] and is now
wide-ly used in large-scale data processing on distributed clusters. In the MapReduce
model, computation is expressed as two functions: map and reduce. The map
function takes an input pair and produces a list of intermediate key/value pairs.
The intermediate values associated with the same keyk2are grouped together and
then passed to the reduce function. The reduce function takes intermediate keyk2
with a list of values and processes them to form a new list of values.
map(k1, v1) → list(k2, v2)
reduce(k2, list(v2)) → list(v3)
MapReduce jobs are executed across multiple machines: the map stage is
par-titioned into map tasks and the reduce stage is partitioned into reduce tasks. The
2.1. MapReduce framework
on distributed clusters. The scheduling of tasks in MapReduce is performed by a
master node which manages a number of worker nodes in the cluster.
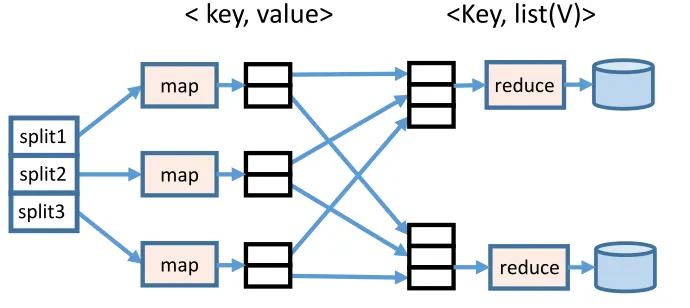
Figure 2.1 shows a high level description of the MapReduce architecture. In the
map stage, each map task processes a logical split of input data (typically stored
in a distributed file system such as HDFS), applies the user-defined map function,
and generates the intermediate set of key/value pairs. In the reduce stage, each
reduce task fetches its partition of intermediate key/value pairs from all the map
tasks and merges the data with the same key. After that, it applies the user-defined
reduce function to produce the aggregate values and then write the results back to
HDFS.
< key, value>
map
map
map
<Key, list(V)>
reduce reduce
split1
split2
split3
Figure 2.1: Architecture of MapReduce framework
Hadoop [9, 72] is an open source implementation of the MapReduce
frame-work and has been widely used in many companies such as Yahoo!, Facebook,
LinkedIn etc. In Hadoop, the cluster is constructed to contain a master node called
the JobTracker while the other node are called worker node. Each worker node
in the cluster is configured with a fixed number of map and reduce slots which
represent the resource unit for processing the map and reduce tasks.
The worker nodes periodically connect to the JobTracker to report its current
status and the available slots. The JobTracker decides the next job to execute based
on the reported information and according to a scheduling policy. The popular
of tasks to slots is done in a greedy way: assign a task from the selected job
im-mediately whenever a worker reports to have a free slot. If the number of tasks
belonging to a MapReduce job is greater than the total number of slots available
for processing the job, the task assignment will take multiple rounds, which we
callwaves.
Optionally, a Hadoop job could define a combiner function that aggregates the
map outputs. It takes a key and a subset of associated values and produces a single
value. The combiner function is useful when it efficiently reduces the amount of
data that need to be transferred to the reduce tasks.
The Hadoop implementation also includescountersfor recording timing
infor-mation such as start and finish timestamps of the tasks or the number of bytes
read and written by each task. These counters are sent by the worker nodes to
the master periodically with each heartbeat and are written to logs after the job is
completed.
2.2
Pig programs
The Hadoop Pig system [26] which is among the similar projects such as Hive [63],
Scope [17], and Dryad [32], aims to raise the level of abstraction for processing
large datasets using Hadoop. It provides high-level SQL-like abstractions on top
of MapReduce engines that enable data analysts to specify complex analytics tasks
without directly writing Map and Reduce functions. The current Pig system is
made up of the following two main components:
• The language, called Pig Latin, that combines high-level declarative style of
SQL and the low-level procedural programming of MapReduce. A Pig
pro-gram is similar to specifying a query execution plan: it represent a sequence
of steps, where each one carries a single data transformation using a
high-level data manipulation constructs, likefilter,group,join, etc. In this way, the
2.2. Pig programs
• The execution environment to run Pig programs. The Pig system takes a Pig
Latin program as input, compiles it into a DAG of MapReduce jobs, and
co-ordinates their execution on a given Hadoop cluster. Pig relies on underlying
Hadoop execution engine for scalability and fault-tolerance properties.
The following specification shows a simple example of a Pig program. It
de-scribes a task that operates over a table URLs that stores data with the three
at-tributes: (url, category, pagerank). This program identifies for eachcategory
theurlwith the highestpagerankin thatcategory.
URLs =load’dataset’ as (url, category, pagerank);
groups =groupURLs by category;
result =foreachgroups generate group, max(URLs.pagerank);
storeresult into ’myOutput’
The example Pig program is compiled into a single MapReduce job. Typically,
Pig programs are more complex, and can be compiled into an execution plan
con-sisting of several stages of MapReduce jobs, some of which can run concurrently.
The structure of the execution plan can be represented by a DAG of MapReduce
jobs that could contain both concurrent and sequential branches. Figure 2.2 shows
a possible DAG of five MapReduce jobs{j1, j2, j3, j4, j5}, where each node
repre-sents a MapReduce job, and the edges between the nodes representdata
dependen-ciesbetween jobs.
J1
J2
J3
J4
J5 J6
Figure 2.2: Example of a Pig program’ execution plan represented as a DAG of MapReduce jobs.
To execute the plan, the Pig engine first submits all the readyjobs (i.e., the jobs
has processed these jobs, the Pig system deletes them and the corresponding edges
from the processing DAG, and identifies and submits the next set of ready jobs.
This process continues until all the jobs are completed. In this way, the Pig engine
partitions the DAG into multiple stages, each containing one or more independent
MapReduce jobs that can be executed concurrently. Note that for stages with
con-current jobs, there is no specifically defined ordering in which the jobs are going to
be executed by Hadoop. For example, the DAG shown in Figure 2.2 is partitioned
into the following four stages for processing:
• first stage: {j1, j2};
• second stage: {j3, j4};
• third stage: {j5};
Chapter 3
Performance Modeling Framework
In this chapter, we introduce a performance modeling framework that aims to
es-timate the MapReduce application completion time as a function of the allocated
resource, the input data sets and the job settings. The intuition of our work comes
from two parts:
• We observe that the executions of map and reduce tasks consist of specific,
well-defined data processing phases. Only map and reduce functions are
custom and their computations are user-defined for different MapReduce
jobs. The executions of the remaining phases are generic, i.e., the logic of
these phases is defined by the Hadoop processing framework. The execution
time of each generic phase depends mostly on the amount of data processed
by the phase and the I/O performance of underlying Hadoop cluster.
• In MapReduce environments, many production jobs are run periodically on
new data. For example, Facebook, Yahoo!, and eBay process terabytes of
data and event logs per day on their Hadoop clusters for spam detection,
business intelligence and different types of optimization. We can extract a
representative job profile that reflects the performance characteristics of the
customized map and reduce functions and use the job profiles to predict the
future execution of the same applications when executed on a different set of
Specifically, the modeling framework consists ofthreeperformance models that
orchestrates the prediction of the application completion time at different system
and applications levels. Figure 3.1 outlines the ensemble of performance models
designed for evaluating the application completion time.
Figure 3.1: Ensemble of Models.
Chapter 3.1 first describes a platform performance model that estimates a
gener-ic phase duration as a function of processed data on a given Hadoop cluster. With
the information of the input dataset(s) and the job settings, we could estimate the
amount of data processed by each job (and the tasks within the job) in the
appli-cation. Based on the estimated data flowing through each phases, we are able to
predict the duration for generic phases by applying the derived platform
perfor-mance model. To estimate the duration of the customized map and reduce phases,
we extracted a compact job profile that captures the performance of the map and
reduce functions and use it to approximate their durations according to the
num-ber of records processed by those functions. Once we estimated the duration of
all phases, the map and reduce task durations can be estimated as the sum of the
phase durations that belong to the task.
After that, Chapter 3.2 presents a MapReduce job model that is used to predict
execution time of MapReduce application that contains single job according to the
map (reduce) task durations and the amount of allocated resources (i.e., number
3.1. Platform performance model
model that combines all parts together for evaluating the completion time for
com-plex MapReduce workflows.
3.1
Platform performance model
We first describe our benchmarking approach for building a MapReduce platform
model that aims to predicting the completion time of different MapReduce phases
as a function of processed data. We use a set of microbenchmarks to profile generic
phases of the MapReduce processing pipeline of a small given Hadoop cluster.
Based on the benchmark results, we then derive an accurate platform performance
model of a given cluster. The advantage of our approach includes
• Generality: The platform performance model is derived once for the given
cluster, and then can be reused for characterizing performance of generic
phases of different applications.
• Scalability: We derive the model using a small test cluster and then use it for
the larger production cluster with the same hardware. The benchmarking
process is performed without interfering the production cluster.
3.1.1
Profiling MapReduce phases
Figure 3.2: MapReduce Processing Pipeline.
As showed in Figure 3.2, the execution of each map (reduce) task is comprised
For each map task, it first reads a split of the input data from the Hadoop
dis-tributed file system (HDFS) (readphase), applies the user-defined map function,
and generates the intermediate set of key/value pairs (readphase). The map task
then buffers the map outputs and sorts and spills the data into disk once the
in-termediate data grows beyond certain threshold (collect andspillphase). After all
the input data are processed, the map task merges the spilled data and partitions
them for different reduce tasks according to a partition function (mergephase).
For each reduce task, it first fetches its partition of intermediate key/value pairs
from all the map tasks and sort/merges the data with the same key (shufflephase).
After that, it applies the user-defined reduce function to the merged value list to
produce the aggregate results (reducephase). Finally, the reduce outputs are
writ-ten back to HDFS (writephase).
Note, that only map and reduce phases with customized map and reduce
func-tions execute the user-defined pieces of code. The execution of the remaining
phas-es aregeneric(i.e., the logic of these phases is defined by Hadoop code), and their
durations depend mostly on the amount of data flowing through a phase and the
I/O performance of the underlying Hadoop cluster. Our goal is therefore to
de-rive aplatform performance modelthat predicts a duration of each generic phase on
a given Hadoop cluster platform as a function of processed data.
In order to accomplish this, we run a set of microbenchmarks that create
dif-ferent amounts of data for processing per map (reduce) tasks and for processing
by their phases. We profile the duration of each generic phase during the task
exe-cution and derive a function that defines a phase performance as a function of the
processed data from the collected measurements.
For map tasks, we profile the following generic phases:
• Readphase – a map task typically reads a block (e.g., 64 MB) from the Hadoop
distributed file system (HDFS). However, written data files might be of
arbi-trary size, e.g., 70 MB. In this case, there will be two blocks: one of 64 MB
3.1. Platform performance model
sizes. We measure the duration of the read phase as well as the amount of
data read by the map task.
• Collect phase – this generic phase follows the execution of the map phase
with a user-defined map function. We measure the time it takes to buffer
map phase outputs into memory and the amount of generated intermediate
data.
• Spillphase – we measure the time taken to locally sort the intermediate data
and partition them for the different reduce tasks, applying the combiner if
available, and then writing the intermediate data to local disk.
• Merge phase – we measure the time for merging different spill files into a
single spill file for each destined reduce task.
For reduce tasks, we profile the following generic phases:
• Shufflephase – we measure the time taken to transfer intermediate data from
map tasks to the reduce tasks and merge-sort them together. We combine the
shuffle and sort phases because in the Hadoop implementation, these two
sub-phases are interleaved. The processing time of this phase depends on the
amount of intermediate data destined for each reduce task and the Hadoop
configuration parameters. In our testbed, each JVM (i.e., a map/reduce
s-lot) is allocated 700 MB of RAM. Hadoop sets a limit (∼46% of the allocated
memory) for in-memory sort buffer. The portions of shuffled data are
merge-sorted in memory, and a spill file (∼320 MB) is written to disk. After all the
data is shuffled, Hadoop merge-sorts first 10 spilled files and writes them in
the new sorted file. Then it merge-sorts next 10 files and writes them in the
next new sorted file. At the end, it merge-sorts these new sorted files. Thus,
we can expect a different scaling function for a duration of the shuffle phase
when the size of intermediate data per reduce task is larger than3.2 GB in
our Hadoop cluster as the merge-sorts process need to scan the entire output
Hadoop cluster, this threshold can be similarly determined from the cluster
configuration parameters.
• Write phase – this phase follows the execution of the reduce phase that
ex-ecutes a custom reduce function. We measure the amount of time taken to
write the reduce output to HDFS.
Note, that in platform profiling we do not include phases with user-defined
map and reduce functions. However, we do need to profile these custom map and
reduce phases for modeling the execution of given MapReduce applications:
• Map(Reduce) phase – we measure a duration of the entire map (reduce)
func-tion and the number of processed records. We normalize this execufunc-tion time
to estimate a processing time per record.
Apart from the phases described above, each executed task has a constant
over-head for setting and cleaning up. We account for these overover-heads separately for
each task.
For accurate performance modeling, it is desirable to minimize the overheads
introduced by the additional monitoring and profiling technique. There are two
different approaches for implementing phase profiling.
• Counter based profiling:The current Hadoop implementation includes several
countersto record information such as the number of bytes read and written.
We modified the Hadoop code by adding counters that measure durations
of the six generic phases to the existing counter reporting mechanism. We
can activate the subset of desirable counters in the Hadoop configuration for
collecting the set of required measurements.
• Dynamic instrumentation based profiling: We also implemented the alternative
profiling tool inspired by Starfish [28] approach based onBTrace– a
dynam-ic instrumentation tool for Java [7]. This approach does have a special
ap-peal for production Hadoop clusters because it has a zero overhead when
3.1. Platform performance model
overhead is significantly higher compared to adding new Hadoop counters
directly in the source code.
For building the platform performance mode, we execute a set of
microbench-marks (described in Chapter 3.1.2) and measure the durations of six generic
exe-cution phases for processing different amount of data:read, collect, spill,andmerge
phases for the map task execution, andshuffleand writephases in the reduce task
processing. This profiling is done on a small test cluster (5-nodes in our
experi-ments) with the same hardware and configuration as the production cluster. While
for these experiments both profiling approaches can be used, the Hadoop
counter-based approach is preferable due to its simplicity and low overhead, and that the
modified Hadoop version can be easily deployed in this test environment.
For predicting the completion time for a particular MapReduce job, we needs
additional measurements that characterize the execution of user-defined map and
reduce functions of a given job. For profiling the map and reduce phases of the
given MapReduce jobs in the production cluster we apply our alternative profiling
tool that is based onBTraceapproach. Remember, this approach does not require
Hadoop or application changes, and can be switched on for profiling a targeted
MapReduce job of interest. Since we only profile map and reduce phase executions
the extra overhead is relatively small.
3.1.2
Microbenchmarks
We generate and perform a set of parameterizable microbenchmarks to
character-ize execution times of generic phases for processing different data amounts on a
given Hadoop cluster by varying the following parameters:
• Input size per map task (Minp): This parameter controls the size of the input
read by each map task. Therefore, it helps to profile theReadphase durations
for processing different amount of data.
• Map selectivity (Msel): this parameter defines the ratio of the map output to
map function, and therefore directly affects theCollect, SpillandMergephase
durations in the map task. Map output determines the overall amount of
da-ta produced for processing by the reduce da-tasks, and therefore impacting the
amount of data proceeded byShuffleandReducephases and their durations.
• Number of map tasks Nmap: This parameter helps to expedite generating the
large amount of intermediate data per reduce task.
• Number of reduce tasks Nred: This parameter helps to control the number of
reduce tasks to expedite the training set generation with the large amount of
intermediate data per reduce task.
Thus, each microbenchmarkM Biis parameterized as
M Bi = (Miinp, M sel
i , N
map
i , N
red i ).
Each created benchmark uses input data consisting of 100 byte key/value pairs
generated with TeraGen [1], a Hadoop utility for generating synthetic data. The
map function simply emits the input records according to the specified map
selec-tivity for this benchmark. The reduce function is defined as the identity function.
Most of our benchmarks consist of a specified (fixed) number of map and reduce
tasks. For example, we generate benchmarks with 40 map and 40 reduce tasks
each for execution in our small cluster deployments with 5 worker nodes. We
run benchmarks with the following parameters: Minp={2MB, 4MB, 8MB, 16MB,
32MB, 64MB}; Msel={0.2, 0.6, 1.0, 1.4, 1.8}. For each value of Minp and Msel, a
new benchmark is executed. We also use benchmarks that generate special ranges
of intermediate data per reduce task for accurate characterization of the shuffle
phase. These benchmarks are defined byNmap={20,30,...,150,160};Minp = 64M B,
Msel= 5.0andNred= 5which result in different intermediate data size per reduce
tasks ranging from 1 GB to 12 GB.
We generate the platform profile by running a set of our microbenchmarks on
the small 5-node test cluster that is similar to a given production Hadoop cluster.
3.1. Platform performance model
executed map and reduce tasks. A set of these measurements defines theplatform
profile that is later used as the training data for aplatform performance model:
• Map task processing: in the collected platform profiles, we denote the
mea-surements for phase durations and the amount of processed data for read,
collect, spill,andmergephases as(Dur1, Data1),(Dur2, Data2),(Dur3, Data3),
and(Dur4, Data4)respectively.
• Reduce task processing: in the collected platform profiles, we denote phase
du-rations and the amount of processed data forshuffleandwriteas(Dur5, Data5)
and(Dur6, Data6)respectively.
Figure 3.3 shows a small fragment of a collected platform profile as a result of
executing the microbenchmarking set. There are six tables in the platform profile,
one for each phase. Figure 3.3 shows fragments forreadandcollect phases. There
are multiple map and reduce tasks that process the same amount of data in each
microbenchmark. This is why there are multiple measurements in the profile for
processing the same data amount.
Row Data Read
number MB msec
j Data1 Dur1
1 16 2010
2 16 2020
... ... ...
Row Data Collect
number MB msec
j Data2 Dur2
1 8 1210
2 8 1350
... ... ...
Figure 3.3: A fragment of a platform profile forreadandcollectphases.
3.1.3
Platform modeling
Now, we describe how to create aplatform performance model MP haseswhich
char-acterizes the phase execution as a function of processed data. To accomplish this
goal, we need to find the relationships between the amount of processed data and
durations of different execution phases using the set of collected measurements.
Therefore, we buildsixsubmodelsM1, M2, ..., M5,andM6 that define the
cluster. To derive these submodels, we use the collected platform profile (see
Fig-ure 3.3).
Below, we explain how to build a submodel Mi, where 1 ≤ i ≤ 6. By using
measurements from the collected platform profiles, we form a set of equations
which express a phase duration as a linear function of processed data. Let Dataji
be the amount of processed data in the rowj of platform profile withKrows. Let
Durji be the duration of the corresponding phase in the same row j. Then, using
linear regression, we solve the following sets of equations (for eachi= 1,2,· · · ,6):
Ai+Bi·Dataji =Dur j
i, where j = 1,2,· · · , K (3.1)
To solve for(Ai, Bi), one can choose a regression method from a variety of known
methods in the literature (a popular method for solving such a set of equations is
a non-negative Least Squares Regression). With ordinary least squares regression,
a few bad outliers can significantly impact the model accuracy, because it is based
on minimizing the overall absolute error across multiple equations in the set. To
decrease the impact of occasional bad measurements and to improve the overall
model accuracy, we employ robust linear regression [30]. (which is typically used
to avoid a negative impact of a small number of outliers).
Let( ˆAi,Bˆi)denote a solution for the equation set (1). ThenMi = ( ˆAi,Bˆi)is the
submodel that defines the duration of execution phaseias a function of processed
data. Theplatform performance model isMP hases= (M1, M2, ..., M5, M6).
For the shuffle phase, according to the discussion in Chapter 3.1.1, we expect
that there will be different behavior when it processes data smaller/larger than
around 3.2 GB and thus better be approximated by a piece-wise linear function
comprised of two linear functions: one for processing up to 3.2 GB of intermediate
data per reduce task, and the second segment for processing the datasets larger
than 3.2 GB.
We derived the platform performance model by executing the set of our
mi-crobenchmarks on a small 5-nodes clusters and collecting the corresponding phase
160G-3.1. Platform performance model
B hard disks. We used Hadoop 0.20.2 with additional two machines dedicated as
the JobTracker and the NameNode. Each working node is configured with 2 map
and 1 reduce slots. The file system block size is set to 64MB. The replication level
is set to 3. We disabled speculative execution since it did not lead to significant
improvements in our experiments.
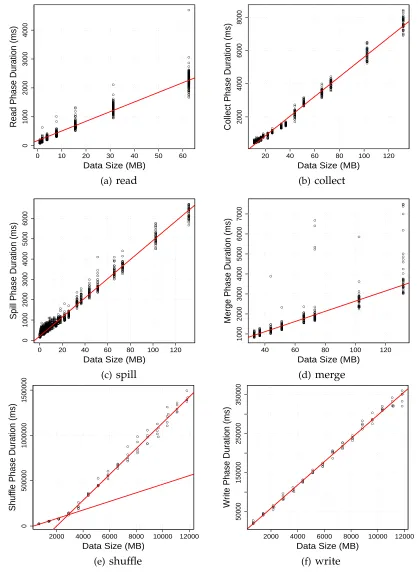
Figure 3.4 shows the relationships between the amount of processed data and
the execution durations of different phases for a given Hadoop cluster. It reflects
the platform profile for six generic execution phases: read, collect, spill, and merge
phases of the map task execution, andshuffleandwritephases in the reduce task.
Each graph has a collection of dots that represent phase duration measurements
(Y-axes) of the profiled map (reduce) tasks as a function of processed data (X-axes).
The red line on the graph shows the linear regression solution that serves as a
model for the phase. As we can see (visually) the linear regression provides a good
solution for five out of six phases. As it was expected, the shuffle phase is better
approximated by a linear piece-wise function comprised of two linear functions.
To validate whether our explanation on the shuffle phase behavior is
correc-t, we perform a set of additional experiments. We configured each JVM (i.e., a
map/reduce slot) with 2 GB RAM (compared to JVM with 700 MB of RAM used
in previous experiments). As we explained earlier, Hadoop sets a limit (∼46% of
the allocated memory) for in-memory sort buffer. The portions of shuffled data
are merge-sorted in memory, and a spill file (in the new case, ∼900 MB) is
writ-ten to disk. After all the data is shuffled, Hadoop merge-sorts first 10 spilled files
and writes them in the new sorted file. Then it merge-sorts next 10 files and writes
them in the next new sorted file. Finally, at the end, it merge-sorts these new sorted
files. Thus, we can expect that in the new configuration the shuffle performance is
significantly different for processing intermediate data large than 9 GB. Figure 3.5
indeed confirms our conjecture: shuffle performance changes for processing
inter-mediate data large than 9 GB. Indeed, the shuffle phase performance is affected
by the JVM memory size settings, and its performance can be more accurately