Published online June 30, 2014 (http://www.sciencepublishinggroup.com/j/ajep) doi: 10.11648/j.ajep.20140303.15
Analysis of the economic and environmental benefits
through the reverse logistics for retail
Renata Borini Marcondes e Santos
1, *, Sergio Silva Braga Junior
1, Dirceu da Silva
2,
Eduardo Guilherme Satolo
11UNESP – Univ. Estadual Paulista, Tupa Câmpus, Sao Paulo, Brazil
2UNINOVE – Universidade Nove de Julho, Postgraduate Program in Management , Sao Paulo, Brazil
Email adress:
renata_borini@hotmail.com (R. B. M. e Santos), sergio@tupa.unesp.br (S. S. B. Junior), dirceuds@gmail.com (D. da Silva), eduardo@tupa.unesp.br (E. G. Satolo)
To cite this article:
Renata Borini Marcondes e Santos, Sergio Silva Braga Junior, Dirceu da Silva, Eduardo Guilherme Satolo. Analysis of the Economic and Environmental Benefits through the Reverse Logistics for Retail.American Journal of Environmental Protection. Vol. 3, No. 3, 2014, pp. 138-143. doi: 10.11648/j.ajep.20140303.15
Abstract:
The growing consumption has generated a lot of waste to be discarded and consequently raise the degree of pollution of the planet. In this sense, this research aims to analyze the environmental gains with the practice of reverse logistics in retail and quantify cardboard and plastic volumes that ceases to be disposed in landfills. To quantify the envi-ronmental gain, Wuppertal method, which quantifies the non-contaminated waste, was used to measure the economy of water and air by the interviewed companies. This research was raised the volume of waste recycled by four Brazilian supermarkets. The volume generated is representative and the environmental gains are evident. Results show that within the retailing reverse logistics is a practice that adds value and creates sustainability in jail on other processes connected to it.Keywords:
Waste Management, Reverse Logistic, Retail, Sustainability1. Introduction
The world market behaves increasingly globalized form, since the information circulating from one continent to another, even in relation to the goods. This globalization has stimulated, with great intensity, the consumerism that is powered by the production of new goods that generate more waste to be discarded.
The generation of waste has increased throughout the supply chain, from industry and arriving at retail, where direct contact with consumers occurs. Thus, the most ap-propriate way to engage the social, environmental and economic aspect to deal with the discarded material is re-verse logistics (Santos, 2012).
Reverse logistics includes the reverse flow of materials that previously did not offer many utilities and treated as junk, trash or waste, according to Braga Junior et al. (2011). From the implementation and control of reverse logistics such residues back to the retail supply chain to feed some link or entering as raw material, as demonstrated Nunes and Haddad (2013) show that waste management in the oil and gas industry.
Reverse logistics is now recognized as an area of
logis-tics business that plans, operates and controls the flow and logistics information corresponding to the return of af-ter-sales and post-consumer goods to the production cycle. It is use enables the recycling of support resources used by retailers and thus ensure the return of these materials to the production process to reduce the environmental impact.
In this sense, the objective of the research was to analyze the opportunities generated by the reverse logistics and measure their economic and environmental advantages for retailers. This study investigated four Brazilian supermar-kets, located in São Paulo. As a result, it was observed the companies has processing huge volumes of waste generated, that return to production chain. In this sense, retail has contributed to reducing the environmental impact that could be left by these residues.
2. Literature Review
2.1. Reverse Logistics
controlling the flow of raw materials , there is stock in process and finished (products and your information flow) from the point of consumption to the point of origin for the purpose of acquiring the value that could be lost or conduct proper disposal (Rogers & Tibben-Lembke, 1998; Oliveira & Silva, 2005; Marchi, 2011).
For Oliveira et al (2012) reverse logistics has emerged as the relocation of function of materials and waste, one of whose main objectives is the collection and
the same distribution channels, and thus promoting signif cant economic gains, and add greater environmental gains value to the product.
Oliveira e Silva (2005) adds that reverse logistics has significant representation on the actions aimed
ing the environment, aiming at sustainable development. The efficient planning of this process has become essential not only for companies but also for society because of the solid waste becomes a problem for cities (Sankoh & Yan, 2013).
This reverse process is directly linked to recycling, which is largely responsible for a significant part of the waste that becomes raw again. In this sense, Oliveira and Silva (2005) explain that the activities of the reverse logi tics depend on the material and the reason they enter the system. The materials can be divided into two major groups: products and packaging. For products, the flow of reverse logistics will be a need to repair, recycling, or because they simply return the customers. Have the packages ar
directed to the beginning of the production process turned into raw material.
There are four main reasons for performing the reverse logistics, according to De Brito & Dekker (2004)
issues which require establishments to position itself problems generated by the disposal of waste; b) enviro mental awareness, which brings the concept of sustainabi ity linked the actions of the studied logistics and the colle tion made by the consumer; c) strategic differentials inte fere in company image, flexibility and quality in receiving products/waste customers d) cost reduction, revenue gene ation through material that would otherwise be discarded.
Oliveira e Silva (2005) also claim that it is possible by observing the reverse process to identify materials that can return a number of ways, such as: a) return to the supplier when agreements; b) be resold if they are still appropriate marketing conditions; c) be reconditioned, provided there is the economic justification; d) be recycled if there possibility of recovery. All these alternatives generate re laimed materials that come in direct new logistics system. In the latter case, the target may be their final disposal.
This product return obeys some steps, cited by Leite (2009, 2011), which briefly are: collection, selection of destinations of the products or waste, reuse and distribution of these new products to market. However, how these steps are performed interfere with the progress of an efficient process, which would be the realizatio
verse logistics, reuse materials so they do not harm the environment.
controlling the flow of raw materials , there is stock in process and finished (products and your information flow) from the point of consumption to the point of origin for the purpose of acquiring the value that could be lost or conduct Lembke, 1998; Oliveira
For Oliveira et al (2012) reverse logistics has emerged as the relocation of function of materials and waste, one of whose main objectives is the collection and replacement of the same distribution channels, and thus promoting signifi-cant economic gains, and add greater environmental gains
Oliveira e Silva (2005) adds that reverse logistics has significant representation on the actions aimed at preserv-ing the environment, aimpreserv-ing at sustainable development. The efficient planning of this process has become essential not only for companies but also for society because of the solid waste becomes a problem for cities (Sankoh & Yan,
erse process is directly linked to recycling, which is largely responsible for a significant part of the waste that becomes raw again. In this sense, Oliveira and Silva (2005) explain that the activities of the reverse
logis-the reason logis-they enter logis-the system. The materials can be divided into two major groups: products and packaging. For products, the flow of reverse logistics will be a need to repair, recycling, or because they simply return the customers. Have the packages are usually directed to the beginning of the production process turned
There are four main reasons for performing the reverse De Brito & Dekker (2004), a) legal issues which require establishments to position itself to the problems generated by the disposal of waste; b) environ-mental awareness, which brings the concept of sustainabil-ity linked the actions of the studied logistics and the collec-tion made by the consumer; c) strategic differentials inter-image, flexibility and quality in receiving products/waste customers d) cost reduction, revenue gener-ation through material that would otherwise be discarded.
Oliveira e Silva (2005) also claim that it is possible by ify materials that can return a number of ways, such as: a) return to the supplier when agreements; b) be resold if they are still appropriate marketing conditions; c) be reconditioned, provided there is the economic justification; d) be recycled if there is no possibility of recovery. All these alternatives generate rec-laimed materials that come in direct new logistics system. In the latter case, the target may be their final disposal.
teps, cited by Leite h briefly are: collection, selection of destinations of the products or waste, reuse and distribution of these new products to market. However, how these steps are performed interfere with the progress of an efficient process, which would be the realization of the goal of re-verse logistics, reuse materials so they do not harm the
2.2. Recycling and Reuse of Solid Waste
The high degree of consumption and population growth have been largely responsible for the uncontrolled increase of solid waste disposal, consequently causes an ecological imbalance increases the rate of pollution on the planet (Santos, 2012; Ahmeduzzaman
Wang & Ridley, 2014). Thus, they are seen as one of the greatest problems faced in a society in pursuit of sustain ble development (Santos, 2012; Sankoh & Yan, 2013).
Through these statements, and yet according to Santos (2012), defined as solid waste, in general, undesirable m terials for those who ruled them from various types of a tivities and locations, which may cause serious risks to the health and well environmental and human being, if they are disposed of improperly.
Araújo et al. (2010) argue that solid wastes are all re nants of human activities or food scraps, packaging, pla tics and others. It is all that is deemed undesirable dispos ble or even useless. However, what has value for some, may have a benefit to others.
Disposal of these wastes have significant risks, especia ly in developing areas, therefore, must its destination and form of reuse is correct (Marchi, 2011).
3. Methodological Procedures
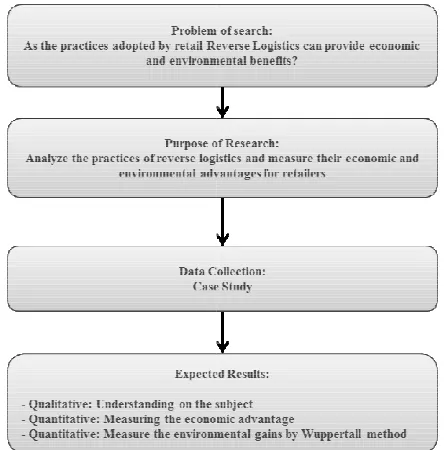
For the verification of the objectives proposed by the present study, exploratory qualitative research through multiple cases where a semi
participant observation in the data collection process was used was performed. As a quantitative nature is justified by measure economic and environmental adva
menting reverse logistics in supermarkets studied. Figure 1 presents the methodological procedures used for this r search and then the details of this process occurs.
Figure 1. Methodological Procedures for this project
Recycling and Reuse of Solid Waste
The high degree of consumption and population growth have been largely responsible for the uncontrolled increase of solid waste disposal, consequently causes an ecological imbalance increases the rate of pollution on the planet (Santos, 2012; Ahmeduzzaman & Rahman, 2013; Worsley, Wang & Ridley, 2014). Thus, they are seen as one of the greatest problems faced in a society in pursuit of sustaina-ble development (Santos, 2012; Sankoh & Yan, 2013).
Through these statements, and yet according to Santos efined as solid waste, in general, undesirable ma-terials for those who ruled them from various types of ac-tivities and locations, which may cause serious risks to the health and well environmental and human being, if they are
et al. (2010) argue that solid wastes are all rem-nants of human activities or food scraps, packaging, plas-tics and others. It is all that is deemed undesirable disposa-ble or even useless. However, what has value for some, may have a benefit to others.
sposal of these wastes have significant risks, especial-ly in developing areas, therefore, must its destination and form of reuse is correct (Marchi, 2011).
Methodological Procedures
For the verification of the objectives proposed by the xploratory qualitative research through multiple cases where a semi-structured questionnaire and participant observation in the data collection process was used was performed. As a quantitative nature is justified by measure economic and environmental advantage of imple-menting reverse logistics in supermarkets studied. Figure 1 presents the methodological procedures used for this re-search and then the details of this process occurs.
As the use of qualitative and quantitative method, qualit-ative method, following the exploratory nature with a non-probability convenience sampling (Cooper & Schindler, 2003). So, Cooper & Schindler (2003) explains that qualit-ative research is characterized as a comprehensive and detailed approach to the meanings and situational characte-ristics presented by interviewees and the cases analyzed, rather than producing quantitative measures or behavioral characteristics.
On the quantitative method, the data regarding the amount of recycled material and economic gains with this action have been raised. Of course, these are not recycled materials when discharged into the environment giving rise to the study of the environmental benefits. The environ-mental benefits were measured at Wuppertal method pub-lished for Ritthoff, Rohn & Liedtke (2002).
The method, developed by the Wuppertal Institute, can assess the environmental changes associated with resource extraction from their natural ecosystems. Thus, for the supply with material flow system, a larger quantity of ma-terial previously processed in various environmental com-partments. The compartments are classified as: abiotic, biotic, water and air.
According to Odum (1998) The ecosystem is composed of biotic and abiotic compartments interact with each other, the biotic compartment is the set of all living organisms like plants and decomposers, the abiotic compartment is the set of non-living factors in an ecosystem, but influencing the biotic environment, consists of temperature, pressure, rainfall relief, among others. The total quantity of material in each compartment was processed to supply a material called material intensity. To determine the intensity of the material, the inlet mass flow (expressed in the appropriate units) is multiplied by MIF (mass intensity factors) factor is the amount of material required to produce one unit of the input stream.
The objective of the research was to demonstrate the economic and environmental advantages in the implemen-tation of reverse logistics in the retail market. To achieve the proposed objective a study will be conducted in the cities of Mogi das Cruzes, Tupa and Marilia State of Sao Paulo/Brazil in a supermarket each city to compare quanti-ties and types of waste that is collected by means of reverse logistics. The choice of supermarket was accomplished through a formal invitation to the biggest supermarket in each city. Thus, with a commitment to maintain the confi-dentiality of the name and address not only strategic to the core business, the invitation was accepted. The surveyed cities have a total population of approximately 1 million people and supermarkets represent purchases approximate-ly 50% of this population.
A method to analyze the collected data, developed by the Wuppertal Institute, can assess the environmental changes associated with resource extraction from their natural eco-systems. Thus, to supply a flow of material from one sys-tem, a larger quantity of material previously processed in various environmental compartments. The compartments
are classified as: abiotic, biotic, water and air.
Importantly, studies of the intensity of the material de-veloped in Wuppertal Institute are based on the energy mix in Germany, Europe or the World. However, that fact does not preclude the implementation of this methodological tool in Brazil, according to the institute's figures are very close.
4. Characterization of Supermarkets A,
B and C
By being in a strategic location, the average daily flow of people in supermarkets A and B, is 6100 and 6900, respec-tively. Currently, the three supermarkets have in their areas of sales sections of grocery, general merchandise, grocery, bazar, bakery, deli, butcher, cold area (dairy, poultry, fish). Since the store’s feature 3000m² with 32 checkouts and B of 3500m² with 37 checkouts.
The third store the largest, C, is located in the city of Mogi das Cruzes, and has 43 checkouts a sales area of 3500m ² and higher average daily flow of people, 8000. Based on these data, all supermarkets fall as superstore as ranked by Parente (2000), when it comes to shopping for food retailing format. This classification follows the variation of the number of check-outs and sales area.
Through this study, it can be seen that the three super-markets have a structure for processing and storage of waste collected in the supermarket, thereby facilitating the ga-thering of the materials (cardboard and plastic) are recycled.
The frequency of waste collection varies from one store to another, depending on the agreement that was made with the waste company. The store B and C has a daily frequency of collection, since the accumulation of waste is great. Since the supermarket A, on average three times a week.
5. Search Results
The great accumulation of solid waste caused by in-creased consumption in retail has led to inin-creased produc-tion of materials that were not recycled, reused and not recovered. This situation has reached the retail supermarket companies for being one of the production chains and is directly linked to the consumer. Accordingly, the most appropriate mechanism to be adopted by retailers to meet this need, it may be practical to reverse logistics.
This mechanism meets the call of environmental man-agement tending to business sustainability and create a new business opportunity in the sector and generate possibilities for financial gain. Some retailers seek agreements with its suppliers to return plastic and cardboard for the industry, others establish contracts with recycling companies to per-form the correct destination.
Table 1 shows the total annual volume of cardboard and plastic from retailers A, B and C and return the supply chain through recycling or reuse.
disposed of at retail is shown in Figure
flow of the waste accumulated in the supermarket chain is inserted. Processes of reusing sale of cardboard and plastic, and these are presented the products that aggregate financial income by selling and ease of replacement in the market.
Table 1. Total volume of cardboard and recycled plastic in 2013
Type of Waste Volume
Cardboard 900.000
Plastic 90.000
Total 990.000
The process of reverse logistics cited these materials b gin when suppliers deliver products packaged in cardboard boxes and pallets, protected by plastic. The supermarket receives and to carry supplies to the shelves, cardboard and plastic separates and returns to the depot where it is sep rated, compressed and stored in bales area. They are sold to a company that prepares the material in order to be tran formed back into the packaging and subsequently sold to industries supplying the supermarket.
Figure 2. Structure of the Reverse Logistics chain supermarkets studied
5.1. Economic Advantage
The financial gains produced by the implementation of reverse logistics are presented in Table 2. Counting data from supermarket A, B and C, one can observe that together add up to a total of approximately US$ 8
and plastic to US$ 23,000. These values are usually tran formed into benefits for local society.
Table 2. Total volume of cardboard and recycled plastic in 2013
Economic Advantage (US$)
Supermarket Cardboard Plastic
A 23,243.00 8,100.00
B 26,759.00 9,370.00
C 31,108,00 10,900.00
Total 81,000.00 28,370.00
As the total amounts of cardboard and plastic are shown, it is also important to emphasize the economic advantage gained by each supermarket by adding these two materials. This way, you can view the total amount annually collects only through the practice of reverse logistics of cardboard and plastic.
disposed of at retail is shown in Figure 2 which shows the flow of the waste accumulated in the supermarket chain is inserted. Processes of reusing sale of cardboard and plastic, and these are presented the products that aggregate financial income by selling and ease of replacement in the market.
Total volume of cardboard and recycled plastic in 2013
Volume 900.000 90.000 990.000
The process of reverse logistics cited these materials be-gin when suppliers deliver products packaged in cardboard boxes and pallets, protected by plastic. The supermarket receives and to carry supplies to the shelves, cardboard and plastic separates and returns to the depot where it is sepa-rated, compressed and stored in bales area. They are sold to a
pares the material in order to be trans-formed back into the packaging and subsequently sold to
Structure of the Reverse Logistics chain supermarkets studied
The financial gains produced by the implementation of reverse logistics are presented in Table 2. Counting data from supermarket A, B and C, one can observe that together $ 81,000 for cardboard . These values are usually
trans-Total volume of cardboard and recycled plastic in 2013
Total
31,343.00
36,129.00
42,008.00
109,370.00
As the total amounts of cardboard and plastic are shown, it is also important to emphasize the economic advantage gained by each supermarket by adding these two materials. This way, you can view the total amount annually collects of reverse logistics of cardboard
In this period, the average prices paid to supermarkets were different for each one according to the city in which it is located. Table 3 below show the values negotiated for the sale of both the cardboard and the plastic for the supermarket A, B and C.
Table 3. Traded Price (2013)
Prices paid during 2013
A Value kilogram of Cardboard Value Plastics kilogram
B Value kilogram of Cardboard Value Plastics kilogram
C Value kilogram of Cardboard Value Plastics kilogram
Table 4, below, displays the calculated average of the prices paid in 2013 for A, B and C.
Table 4. Prices calculated between A, B and C (2013)
Prices calculated between A, B and C
A, B and C Value kilogram of Cardboard Value Plastics kilogram
The data outlined in Table 3 show that there is variability in the amounts paid by the companies for the different supermarkets, this being related to variation in
city is located retail, and management model adopted. However, it is observed that the average value is practiced in cardboard and plastic market.
5.2. Environmental Advantage
Through Wuppertal method, it was possible to perform the calculation that estimates how much of biotic material ceases to be produced and how abiotic material ceases to be released into the environment, providing an environmental gain. The reference values are presented in Table 5. These values were structured by the Wupper
measured the abiotic and biotic material generated from plastic and cardboard to determine how much a company ceases to pollute when implementing a process of Reverse Logistics for these materials. For clarification, the plastic is a product that does not generate biotic material.
Table 5. Factors (European) Intensity Material
Factors (European) Intensity Material
Material Material abiotic Plastics (g/g) 6.45 Cardboard (g/g) 1.86
To determine the intensity of the material, the inlet mass flow (expressed in units corresponding) is multiplied by MIF (mass intensity factors) factor corresponding to the amount of material required to produce one unit of the input stream. MIF values are shown in Table 5.
The retail, the total mass of material (MM) was 55928.57 In this period, the average prices paid to supermarkets were different for each one according to the city in which it is located. Table 3 below show the values negotiated for the d the plastic for the supermarket
Traded Price (2013)
Value kilogram of Cardboard US$ 0,08
US$ 0,22
Value kilogram of Cardboard US$ 0,09
US$ 0,32
Value kilogram of Cardboard US$ 0,10
US$ 0,41
Table 4, below, displays the calculated average of the prices paid in 2013 for A, B and C.
Prices calculated between A, B and C (2013)
Prices calculated between A, B and C (2013)
Value kilogram of Cardboard US$ 0,09
Value Plastics kilogram US$ 0,32
The data outlined in Table 3 show that there is variability in the amounts paid by the companies for the different supermarkets, this being related to variation in which the city is located retail, and management model adopted. However, it is observed that the average value is practiced in cardboard and plastic market.
Environmental Advantage
Through Wuppertal method, it was possible to perform that estimates how much of biotic material ceases to be produced and how abiotic material ceases to be released into the environment, providing an environmental gain. The reference values are presented in Table 5. These values were structured by the Wuppertal Institute, which measured the abiotic and biotic material generated from plastic and cardboard to determine how much a company ceases to pollute when implementing a process of Reverse Logistics for these materials. For clarification, the plastic is
roduct that does not generate biotic material.
Factors (European) Intensity Material
Factors (European) Intensity Material Material
biotic Water Air
- 294.20 3.72
0.75 93.60 0.33
To determine the intensity of the material, the inlet mass flow (expressed in units corresponding) is multiplied by MIF (mass intensity factors) factor corresponding to the amount of material required to produce one unit of the input
shown in Table 5.
kg monthly for and 13821.43 kg cardboard to plastic. These figures are the result of the sum of the values of both abiotic and biotic materials presented in Table 6. Processed For high impact on the volume of water and air that are no longer polluted volume is significant, as a result.
Table 6. Environmental benefits of reuse packaging process Supermarket “A” in kilogramg
Material Intensity Factors – Supermarket “A”
Material Material abiotic
Material
biotic Water Air Plastics
(kg/kg) 165.857,14 7.565.142,86 95.734,29
Cardboard
(kg/kg) 478.285,71 192.857,14 24.068.571,43 83.571,43
Total 644.142,86 192.857,14 31.633.714,29 179.305,71
Regarding the supermarket B, the total quantity of ma-terial per month was 64667.41 kg to 15981.03 kg and cardboard to plastic. So, from the amount of cardboard and recycled plastic, it can be stated that approximately 31,000 tons of water, and 1,200 tons of air no longer polluted, as Table 7.
Table 7. Environmental benefits of reuse packaging process Supermarket “B” in kilogramg
Material Intensity Factors – Supermarket “B”
Material Material abiotic
Material
biotic Water Air Plastics
(kg/kg) 191.772,32 8.747.196,43 110.692,77
Cardboard
(kg/kg) 553.017,86 222.991,07 27.829.285,71 1.106.927,68 Total 744.790,18 222.991,07 36.576.482,14 1.217.620,45
The environmental benefit that offers C has a total mass of material per month was 75154.02 kg for cardboard and plastic to 18572.55 kg. This supermarket had the highest volume collects plastic and cardboard between the three surveyed about the practices of reverse logistics.
Table 8. Environmental benefits of reuse packaging process Supermarket “C” in kilogramg
Material Intensity Factors – Supermarket “C”
Material Material abiotic
Material
biotic Water Air Plastics
(kg/kg) 222.870,54 10.165.660,71 128.642,95
Cardboard
(kg/kg) 642.696,43 259.151,79 32.342.142,86 112.299,11 Total 865.566,96 259.151,79 42.507.803,57 240.942,05
Accordingly, the total ceased to be released into the en-vironment to abiotic material is over 865 tons to about 260 tons to biotic material, as shown in Table 8.
From the analysis of the data collected and presented, it was possible to observe the great importance that the prac-tice of reverse logistics presents for the sustainability of retail and supply chain industry with respect to global warming, the depletion of the ozone layer and the pressure
Atmospheric. This consideration is also based on consoli-dated data of Table 1 shows that the total volume of 990 tons of plastic and cardboard only in 2013 for the three super-markets surveyed resulting in a huge amount of waste they no longer take up space in landfills or be destinations not appropriate locations for disposal.
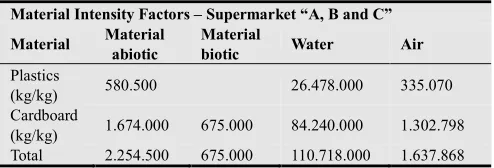
Table 9 shows that the consolidated figures of the envi-ronmental benefit provided by summing the results of all supermarkets surveyed together groups an amount of more than a thousand tons of abiotic materials and 675 tons of biotic material (which cease to pollute vegetation, soil and natural) decomposers.
Table 9. Total Values of environmental benefits (kg)
Material Intensity Factors – Supermarket “A, B and C”
Material Material abiotic
Material
biotic Water Air Plastics
(kg/kg) 580.500 26.478.000 335.070
Cardboard
(kg/kg) 1.674.000 675.000 84.240.000 1.302.798
Total 2.254.500 675.000 110.718.000 1.637.868
In this sense, the 990 tons of cardboard and plastic no longer pollute more than 110 tons and 1600 tons of water from the air, even in CO2 emissions. In this respect, the environmental gain analyzed in this study can be quantified as follows: for each kg of recycled waste that this study has raised, 2.3 kg of abiotic material, 0.69 kg of biotic material ceases to be generated, 111 kg, 1.65 kg of water were not polluted.
6. Conclusions
With the increase of waste generation, the purpose of this study was to analyze the reverse logistics to reduce the impact caused by pollution. The retail sector has been re-searched because it establishes direct contact with the con-sumer and engages the social, environmental and economic aspects in the proposal to deal with the discarded material in this segment (Santos, 2012).
Whereas one of the main goals of reverse logistics is the collection and replacement of materials and waste in dis-tribution channels, promoting economic, environmental gains and adding more value to the product, this process has significant representation in preserving the environment.
As a function, Reverse Logistics seeks to promote mainly the recycling of solid waste, to be disposed of properly and help to minimize the risks to health and the environment.
second highest revenue and volume of waste, also the same characteristics for waste management was observed.
In addition to economic gain, reverse logistics provides environmental benefits, which are more attractive. In this analysis, the supermarket select more waste is getting higher economic benefits, demonstrating that the variables that define the size of retail are proportional to earnings.
According to the analysis in the environmental advan-tages item, relating to the large amount of waste properly, it can be assumed that only the retail of the state of Sao Pau-lo/Brazil should generate millions of tons of cardboard and plastic, whereas only three supermarkets generate a volume of nearly a thousand tons per year, this being one of the main highlights of this review.
A limitation of this study is found on the calculation of the intensity of the material developed in Wuppertal Institute that uses as a basis the energy matrix of Germany, Europe or the World. However, on the other hand, does not preclude the implementation of this methodological tool in Brazil. According to the institute, the quantitative data are very close and do not show how accuracy is only a means to quantify the environmental benefits, as being of great value to the scientific context. Can be considered another limita-tion of cases the possibility that the organizalimita-tion does not have economic advantages occur, but the costs of sustaina-bility can be procured for their actions recycling and proper disposal of solid waste.
Finally, the contribution of this study is the knowledge of how the solid waste generated by most supermarkets through the Reverse Logistics and retailers who apply are not yet treated, demonstrate that this can be an alternative of direct economic gains and environmental gains to society in the search for sustainability.
Acknowledgements
Process nº 2013/16454-0, São Paulo Research Foundation – FAPESP for financial support to the survey.
References
[1] Araujo, C. B. D., Zambon, M. M., Silva, N. F. D., & Rizzo, M. R. (2012). Logística reversa: um estudo em supermercados de cidades do interior paulista. Periódico Eletrônico Fórum Ambiental da Alta Paulista, 6(4).
[2] Braga Junior, S. S., Alonso Junior, N., Ramos, A. L., Evangelista, A. A. & Silva, D. (2011). Um Estudo da Logistica Reversa no Grupo Carrefour: Gestão e Prática em um Supermercado na Cidade de São Paulo. Revista Em-prendedorismo y Estrategia Organizacional, 1(3), p. 69-85. [3] Cooper, D. R. Schindler. PS (2003). Business Research
Methods. McGrawHill Companies.
[4] De Brito, M. P., & Dekker, R. (2004). A framework for reverse logistics (pp. 3-27). Springer Berlin Heidelberg. [5] de Oliveira, A. A., & SILVA, J. T. M. (2011). A Logística
Reversa no Processo de Revalorização dos Bens Manufaturados. REA-Revista Eletrônica de Administração, 4(2).
[6] Leite, P. R. (2009). Logística reversa: meio ambiente e competitividade. Pearson Prentice Hall.
[7] Leite, P. R. (2011). Logística reversa: A complexidade do retorno de produtos. CLBR–Conselho de Logística Reversa do Brasil, disponível em http://www.clrb.com.br/artigos. [8] Marchi, C. M. D. F. (2011). Cenário mundial dos resíduos
sólidos eo comportamento corporativo brasileiro frente à logística reversa. Perspectivas em Gestão & Conhecimento, 1(2), 118-135.
[9] Nunes, E. C., & Haddad, A. N. (2013). Waste management in the oil and gas industry by Brazilian Guideline for ronmental Audits-DZ-056-R. 3. American Journal of Envi-ronmental Protection, 2(6), 170-175. doi: 10.11648/j.ajep.20130206.18
[10] Odum, E.P. (1988). Ecologia. Editora Guanabara Koogan, Rio de Janeiro-RJ.
[11] Oliveira, F., Oliveira, E., & Rodrigues, E. F. (2012). Logística reversa e sustentabilidade: gargalos ea importância diante do cenário competitivo.Revista Científica da Ajes, Juína, 3(6). [12] Parente, J. (2000). Varejo no Brasil: gestão e estratégia.
Editora Atlas.
[13] Rahman, M. N., & Ahmeduzzaman, M. (2013). Case study on the recent solid waste management scenario in Rajshahi city, Bangladesh. American Journal of Environmental Protection, 2(2), 58-63. doi: 10.11648/j.ajep.20130202.15 [14] Ritthoff, M., Rohn, H., & Liedtke, C. (2002). Calculating
MIPS: Resource productivity of products and services (No. 27e). Wuppertal Spezial, Wuppertal Institut für Klima, Um-welt und Energie.
[15] Rogers, D. S., & Tibben-Lembke, R. S. (1998). Going Backwards: Reverse Logistics Trends and Practices. Uni-versity of Nevada. Reno Center for Logistics Management. Reverse Logistics Executive Council, 101-15.
[16] Sankoh, F. P., & Yan, X. (2013). Problems of solid waste management in developing urban cities: a case study of Freetown, Sierra Leone. American Journal of Environmental Protection, 2(5), 113-120. doi: 10.11648/j.ajep.20130205.11 [17] Santos, J. G. (2012). A Logística Reversa Como Ferramenta
Para a Sustentabilidade: um estudo sobre a importância das cooperativas de reciclagem na gestão dos resíduos sólidos urbanos. REUNA, 17(2), p-81.