Abstract
Neuroimaging is a new technique used to create images of the structure and function of the nervous system in the human brain. Currently, it is crucial in scientific fields. Neuroimaging data are becoming of more interest among the circle of neuroimaging experts. Therefore, it is necessary to develop a large amount of neuroimaging tools. This paper gives an overview of the tools that have been used to image the structure and function of the nervous system. This information can help developers, experts, and users gain insight and a better understanding of the neuroimaging tools available, enabling better decision making in choosing tools of particular research interest. Sources, links, and descriptions of the application of each tool are provided in this paper as well. Lastly, this paper presents the language implemented, system requirements, strengths, and weaknesses of the tools that have been widely used to image the structure and function of the nervous system.
Keywords: neuroimaging, nervous system, bioinformatics, image analysis, medical imaging
Introduction
Recently, the field of neuroimaging has been gaining increasing attention among scientists. Neuroimaging was developed (and grew increasingly as a field) to allow experts to investigate differential involvement of both normal and abnormal parts of the brain in humans. In the past, there was considerable restriction on exploring neurophysiological structure and function associated with psychological processes. This is because those studies and experiments could only be done in animal models, post-mortem examinations, electrophysiological measures, and observations of the occasional unfortunate individual who suffered trauma to or disorders of the brain (1).
Although neuroimaging is now becoming more popular and utilised by a large group of scientists, most of them are not ready to learn
coding in order to create user interfaces or other functions since they are not specialised in programming. Even today, the user interfaces that are used by researchers are slow. Scientists have to be experts in coding in order for neuroimaging tools to be advantageous for them.
In the past, neuroimaging tools were usually stand-alone and had to be installed in supported operating systems. They were designed to view the nervous system in black and white only. Now, web-based tools have been introduced and are often integrated with the most current databases to provide more accurate and precise information. Currently, it is difficult to select the most suitable neuroimaging tools for viewing the structure and function of the nervous system of the human brain. The sheer range of available neuroimaging tools can be overwhelming.
Neuroscience
for Neuroimaging
Mei Yen Man1, Mei Sin Ong1, Mohd Saberi Mohamad1,
Safaai Deris2, Ghazali sulOng3, Jasmy Yunus4,
Fauzan Khairi Cheharun4
1 Artificial Intelligence and Bioinformatics Research Group, Faculty of
Computing, Universiti Teknologi Malaysia, 81310 Skudai, Johor, Malaysia
2 Faculty of Creative Technology & Heritage, Universiti Malaysia Kelantan,
Locked Bag 01, 16300 Bachok, Kota Bharu, Kelantan, Malaysia
3 Media and Game Innovation Centre of Excellence (MaGIC-X), Universiti
Teknologi Malaysia, 81310 Skudai, Johor, Malaysia
4 Faculty of Biosciences and Medical Engineering, Universiti Teknologi
Malaysia, 81310 Skudai, Johor, Malaysia
Submitted: 5 Oct 2015 Accepted: 3 Nov 2015
9
Numerous neuroimaging tools have been introduced to satisfy various requirements and demands. Many of these tools have a great deal of features, covering colouring schemes and standard representations. The recent neuroimaging tools have a greater improvement in image quality, as they can produce three-dimensional colour images of the brain.
This paper gives an overview of the tools that have been used to create images of the structure and function of the nervous system in the human body. A detailed source, link and function description for each of the tools is included. Lastly, the underlying language implemented, the system requirements, and the strengths and weakness of the use of these tools in the nervous system are also discussed.
Tools used in Neuroimaging
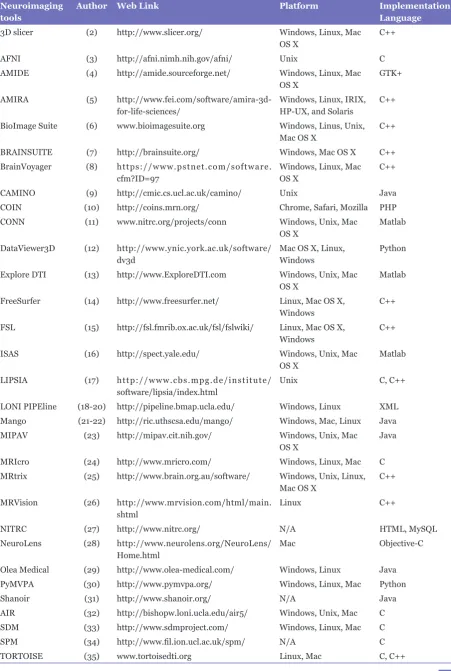
This section elaborates the various kinds of tools that are used to study the structure and function of the nervous system and brain-behaviour relationships in the human body. The description, functions, sources, and link available for each tool are provided in this section. Table 1 shows the sources of the neuroimaging tools that are discussed in this paper.
3D Slicer
3D slicer is a software package that is designed to visualise and analyse medical images. It is compatible with Windows, Linux and Mac OS X operating systems. The software is written in C++ programming language. 3D slicer is used for multi-modality imaging, such as magnetic resonance imaging (MRI), computed tomography (CT), ultrasound (US), nuclear medicine, and microscopy (2). In addition to screen snapshot and screen capture, it also enables users to view images in 4D through the flexible user interface. In addition, the software package also provides functions like manual segmentation and 3D surface model creation. Moreover, it also provides flexibility as it is expandable and can interface with multiple toolkits. For better visualisation, 3D slicer provides users with a graphical user interface that can interact with data. To easily learn the software, a guided tour is provided for each specific user, such as a developer or a new user.
AFNI
AFNI is a program that is used for the analysis and visualisation of 3D functional MRI (FMRI) data. This program is written in C programming language and is only compatible on Unix workstations. The program provides various features such as transforming colour overlay for neural activation maps into higher resolution anatomical scans. Moreover, it also allows users to simultaneously view the slices on each cardinal plane (3). AFNI has the ability to transform anatomical and functional scans to stereotaxic coordinates by manually placing markers on anatomical landmarks. In addition, the software can also automatically convert a manually labelled anatomical dataset to a transformed functional dataset.
AMIDE
AMIDE is a tool that is designed to view, analyse, and register volumetric medical image data sets. It works on Linux, Windows, and Mac OS X operating systems. The programming language used is GTK+. AMIDE is a tool that is designed to avoid the specific constraints of previous software packages. The datasets and regions of interest are located in a tree structure that can display, modify and analyse numerous items simultaneously. Moreover, it also enables users to draw and analyse 3D regions of interest for both static and dynamic state images, to register the rigid body by the use of fiducial markers, to filter and crop datasets, to generate animations, to view series and render volume (4). AMIDE also provides a non-orthogonal user interface to enable a smoother session for manual alignment and allows for viewing several medical images at one time.
AMIRA
Table 1: Sources of Neuroimaging Tools
Neuroimaging tools
Author Web Link Platform Implementation
Language 3D slicer (2) http://www.slicer.org/ Windows, Linux, Mac
OS X
C++
AFNI (3) http://afni.nimh.nih.gov/afni/ Unix C AMIDE (4) http://amide.sourceforge.net/ Windows, Linux, Mac
OS X
GTK+
AMIRA (5) http://www.fei.com/software/amira-3d-for-life-sciences/
Windows, Linux, IRIX, HP-UX, and Solaris
C++
BioImage Suite (6) www.bioimagesuite.org Windows, Linus, Unix, Mac OS X
C++
BRAINSUITE (7) http://brainsuite.org/ Windows, Mac OS X C++ BrainVoyager (8) https://www.pstnet.com/software.
cfm?ID=97
Windows, Linux, Mac OS X
C++
CAMINO (9) http://cmic.cs.ucl.ac.uk/camino/ Unix Java COIN (10) http://coins.mrn.org/ Chrome, Safari, Mozilla PHP CONN (11) www.nitrc.org/projects/conn Windows, Unix, Mac
OS X
Matlab
DataViewer3D (12) http://www.ynic.york.ac.uk/software/ dv3d
Mac OS X, Linux, Windows
Python
Explore DTI (13) http://www.ExploreDTI.com Windows, Unix, Mac OS X
Matlab
FreeSurfer (14) http://www.freesurfer.net/ Linux, Mac OS X, Windows
C++
FSL (15) http://fsl.fmrib.ox.ac.uk/fsl/fslwiki/ Linux, Mac OS X, Windows
C++
ISAS (16) http://spect.yale.edu/ Windows, Unix, Mac OS X
Matlab
LIPSIA (17) http://www.cbs.mpg.de/institute/ software/lipsia/index.html
Unix C, C++
LONI PIPEline (18-20) http://pipeline.bmap.ucla.edu/ Windows, Linux XML Mango (21-22) http://ric.uthscsa.edu/mango/ Windows, Mac, Linux Java MIPAV (23) http://mipav.cit.nih.gov/ Windows, Unix, Mac
OS X
Java
MRIcro (24) http://www.mricro.com/ Windows, Linux, Mac C MRtrix (25) http://www.brain.org.au/software/ Windows, Unix, Linux,
Mac OS X
C++
MRVision (26) http://www.mrvision.com/html/main. shtml
Linux C++
NITRC (27) http://www.nitrc.org/ N/A HTML, MySQL
NeuroLens (28) http://www.neurolens.org/NeuroLens/ Home.html
Mac Objective-C
well as the ability to perform clipping, probing and slicing. This software also allows medical images to be analysed by providing tools for volume and surface measurements of distances, angle, surface, volume, density, and distribution. It can also perform cell, neuron, and fibre tracking. It can build and export movie clips and animations for sharing and presentation capabilities. The software is written in C++ language, and it is available on Windows, Linux, IRIX, HP-UX, and Solaris.
BioImage Suite
BioImage Suite is a medical image analysis software suite that enables image analysis specifically in the areas of segmentation, registration, diffusion weighted image processing and FMRI analysis. This software is written in C++ language, and it is available in Windows, Linux, Mac OS X, and Unix. BioImage provides two core viewers: the mosaic multiple slice viewer and the orthogonal viewer. Moreover, it also provides users with a highly interactive experience by allowing users to draw and process using landmark tools, surface decimation and smoothing through the surface processing tool, and common controls like histogram, image processing, and segmentation field correction controls (6). It also has extra capabilities like command-line tools for the image registration tool.
BRAINSUITE
BRAINSUITE is a tool that is designed to analyse magnetic resonance images. It can produce representations of the cortical surface with spherical topology based on human brain magnetic resonance pictures. This tool includes a set of low-level operations, which could yield to high accuracy brain segmentations in clinical time. The tools include skull and scalp removal, image non-uniformity compensation, voxel-based tissue classification, topological correction, rendering, and editing functions (7). This tool provides a graphical user interface. In addition, users can also interact with the tool by the use of command line tools for performing cortical surface extraction, surface/volume registration, and processing of diffusion weighted images. The tool is written in C++ language, and is available only on Windows and Mac OS X operating systems.
BrainVoyager
BrainVoyager is a software package used to analyse and visualise multi-modal brain imaging data, which includes structural and functional magnetic resonance imaging data sets as well as electroencephalography (EEG) and magnetoencephalography (MEG) data sets. By the use of OpenGL, the software can provide users with a 3D graphic environment (8). The software provides an intuitive user interface across the supported platforms by using the cross-platform QT library. The software provides convenient features or services for users to use the data across the platform such as easy data exchange from one platform to another for example. Moreover, it also enables the transfer of analysed data between platforms, which can be directly processed without any error. The software is written in C++ language and works on Windows, Linux, and Mac OS X operating systems.
Camino
Camino is a software toolkit designed for diffusion MRI processing. The software provides various techniques such as diffusion tensor fitting, mapping fractional anisotropy, mean diffusivity, and deterministic and probabilistic tractography (9). The user documentation is in the form of Unix manual pages, and each program has a shell wrapper, so users do not require any knowledge of Java. The data pipeline provides flexibility by allowing data to be imported and exported to other software. The software is written in Java and is only available for Unix platform.
COIN
CONN
CONN is a cross-platform software that is written in Matlab and is designed to compute, display, and analyse functional connectivity in fMRI. The functional connectivity measures include Seed-to-Voxel connectivity maps, Region of Interest-to-Region of Interest connectivity matrices, graph properties of connectivity networks, and Voxel-to-Voxel measures (11). In addition, CONN provides functions like the ability to control physiological or movement effects, artefact detection and scrubbing, dynamic connectivity analysis, and surface and volume based analysis. It also provides a graphical user interface with automated batch options. CONN is available for MATLAB based platforms such as Windows, Unix, and Mac OS X.
DataViewer3D (DV3D)
DV3D is a multi-modal neuroimaging data visualisation tool. DataViewer3D is built using Python programming language and is compatible with Windows, Linux, and Mac OS X. For a better understanding of how to use DataViewer3D, a tutorial along with example data are provided. DV3D offers the result integration function. It can integrate results in various formats from multiple analysis tools across platforms and processes (12). Moreover, the tool also enables users to view the results from various modes and techniques in 2D and 3D. In addition, it also enables the exportation of high quality images, animations, and projects created for data sharing.
Explore DTI
Explore DTI is a software package that is intended for use in combining multiple MR diffusion processing tools that are not widely available. Explore DTI provides functions like data reconstruction, motion/Eddy Current correction, quality assessment, fibre tractography, synthetic fibre phantoms, and visualisations (13). It also provides a convenient feature that takes output from other tracking packages and provides an efficient way of navigating through these output. Moreover, it also provides a manual to enable quick learning on the software. Explore DTI is written in Matlab and can be used in Windows, Unix, and Mac OS X platforms.
FreeSurfer
FreeSurfer is a software suite that emphasises the analysis of the human brain. It provides functions such as volumetric segmentation, architectonic boundaries estimation, human cerebral cortex surface model construction and more. Moreover, FreeSurfer also allows for automatic volume segmentations. In addition, it generates regions of interest by parcellating the surface (14). The software includes two editing and visualisation tools, Tkmedit and Tksurfer, in order to provide high accuracy images and visual interactions to users. The software is written in C++ language, and it is available in Linux, Mac OS X, and Windows platforms.
FSL (the FMRIB Software Library)
FSL is a library of analysis tools that emphasise functional, structural and diffusion MRI brain imaging data. Most of the tools can be run both from the command line and as GUIs. In addition, FSL has features like segmentation and estimating fibre orientations (15). Moreover, FSL allows quantification of resting perfusion based on arterial Spin MRI. In addition, it also allows for physiological noise correction according to cardiac and respiratory data. It offers a simple graphical user interface and pipeline to enable users to interact with underlying command line tools. FSL is written in C++ and is supported by Linux, Mac OS X and Windows platforms.
ISAS (Ictal-Interictal SPECT Analysis by SPM)
ISAS is an objective tool used to analyse ictal and interictal SPECT scans conducted by SPM (statistical parametric mapping). Ictal SPECT aims to find the region of seizure onset when planning for epilepsy surgery. ISAS is built to compare the ictal and interictal SPECT scans of a patient to find the differences. These differences will be compared to a normal healthy database in order to identify the normal variation. Any significant effect in CBF (cerebral blood flow) then will be detected for further analysis (16). The tool is written in Matlab and is available on Windows, Unix, and Mac OS X platforms.
LIPSIA
course and regions of interest, and support the rendering of registrations and normalisations. Moreover, it also converts data into various data formats (17). LIPSIA provides a rapid and efficient implementation process. It was tested to undergo a standard analysis to process raw data from a test subject resulting in a statistical parametric map, in less than 10 minutes. LIPSIA is written in C and C++ language. It is available only in Unix platforms.
LONI PIPEline
LONI Pipeline was developed by Ivo et al. (18), and it is a stand-alone system compatible with the platforms of Windows and Linux. Actually, it is a graphical environment for construction, validation, and execution of advanced neuroimaging data analysis protocols (19). It allows the conversion of automated data, enables Grid computing support that automatically parallelises data-independent programs in a given analysis, provides simple user interface, and also provides an important library of computational tools. Hence, it facilitates decentralised computing, resource-interoperability, construction and validation of powerful neuroimaging data-analysis workflows. The data that is utilised by this tool is brain imaging data from the Alzheimer’s disease Neuroimaging Initiative (20). In addition, this tool is written in XML language, and it has a free license.
Mango
Mango, or Multi-image Analysis GUI, was developed by Saeed et al. (21). It is a stand-alone system compatible with Windows, Mac and Linux platforms. It is a non-commercial tool for viewing, editing and analysing volumetric medical images. Mango is written in Java language. It supports NIFTI, ANALYZE, NEMA, and DICOM formats, and it is able to load and save 2D, 3D, and 4D images. It provides tools for creating and editing regions of interest (ROI) within the images, surface rendering, image stacking (overlaying), filtering in space domain and histogram analysis, along with other functions that can be used in neuroimaging analysis for scientific (non-clinical purposes). The data from whole-brain maps and threshold activation likelihood estimation maps are visualised by this tool (22).
MIPAV
MIPAV stands for Medical Image Processing, Analysis, and Visualization and was developed by Bazin et al. (23) at the National Institute of Health. It is a stand-alone system compatible with the platforms of Windows, UNIX, and Macintosh OS X. It is a free licensed tool and written in Java language. It is a tool that enables quantitative analysis and visualisation of medical images of many modalities such as positron emission tomography (PET), MRI, CT, or microscopy. This tool helps researchers share research data and analyses via the Internet easily, thus improving their performance in research for medical disorders.
MRIcro
MRIcro was developed by Rorden & Brett (24), and it is a stand-alone system compatible with the platforms of Windows, Linux, and Macintosh OS X to view medical images. It requires tools to complement SPM, which is a tool that allows the specialist to analyse MRI, fMRI, and PET images. It enables efficient viewing and exporting of brain images, and it is also able to create Analyse format headers for exporting brain images to other platforms. This tool is only for the visualization of fMRI data. This tool has a free license, and it is written in C language.
MRtrix
MRtrix was developed by Tournier et al. (25), and it is a stand-alone system compatible with Windows, Unix, Linux, and Macintosh OS X operating systems. This tool performs diffusion-weighted MR white-matter tractography in a manner robust to crossing fibres, using constrained spherical deconvolution (CSD) and probabilistic streamlines. It has a free license and is written in C++ language. In addition, this tool uses diffusion-weighted data.
MRVision
resonance neuroimaging, f-MRI brain activation mapping, diffusion, perfusion mapping, and T2/ T1 mapping. In addition, this tool utilises rat brain data. It is a free licensed tool written in C++ language.
NITRC
NITRC stands for Neuroimaging Informatics Tools and Resources Clearinghouse and was developed by Goldszal et al. (27). This web-based tool is a neuroimaging informatics knowledge environment for magnetic resonance (MR), PET/ single-photon emission computed tomography (SPECT), CT, EEG/MEG, optical imaging, clinical neuroinformatics, imaging genomics, and computational neuroscience tools and resources. Moreover, it is a neuroimaging data repository that provides a cloud-based computing environment. It is free licensed tool written in HTML and MySQL language.
NeuroLens
NeuroLens was developed by Cloherty et al (18), and it is available for free download for academic and non-profit research use. It is an integrated environment, used for the analysis and visualisation of functional neuroimages. It is designed to produce very fast and flexible image processing via an easy user interface. NeuroLens is a stand-alone system compatible with the Macintosh OS X platform. The data from two rhesus macaque monkeys (Macaca mulatta) are applied in this tool. This tool is written in Objective-C programming language.
Olea Sphere
Olea Sphere was developed by Schiff (29), and it is a commercial tool. This is an image processing tool intended for picture archive, post-processing and communication. It standardises across vendors both viewing and analysis capabilities of functional and dynamic MRI and CT imaging datasets. Olea Sphere is compliant with the DICOM standard and Windows or Linux platforms. It runs on any standard off-the-shelf workstation, or it can be used through thin deployment. There are seven types of applications implemented in Olea Sphere, involved neuro, head and neck, prostate, breast, female pelvis, and cardiac. It is written in Java language.
PyMVPA
PyMVPA stands for Multivariate Pattern Analysis (MVPA) in Python and was developed by Hanke et al. (29). It is a stand-alone system compatible with the platforms of Windows, Linux, and Macintosh OS X. PyMVPA is a Python toolbox for multivariate pattern analysis of fMRI data. It offers an extensive framework with a high-level interface that includes a broad range of algorithms for classification, regression, feature selection, and data import and export. It is designed to integrate well with related software packages such as scikit-learn, shogun, MDP, etc.. Moreover, it takes the advantages of Python’s ability to access libraries written in a huge variety of programming languages and computing environments to interface with the wealth of existing machine-learning packages. It is written in Python language, and it has a free license.
Shanoir
Shanoir stands for Sharing NeurOImaging Resources and was developed by Hanson et al. (30). Shanoir is web-based tool that is an open source neuroinformatics platform designed to share, archive, search, and visualise neuroimaging data. It provides a user-friendly secure web access and offers an intuitive workflow to facilitate the collecting and retrieving of neuroimaging data from multiple sources and a wizard to make the completion of metadata easy. Shanoir offers an ontology-based data organisation (OntoNeuroLOG). Among other things, this facilitates the reuse of data and metadata, the integration of processed data and provides traceability through an evolutionary approach. It is written in Java language.
AIR
SDM
SDM stands for Signed Differential Mapping and is currently known as Seed-based d Mapping. SDM was developed by Zilles et al. (32) and it is a stand-alone system compatible with Windows, Linux, and Macintosh OS X platforms. Seed-based d Mapping is a statistical technique for meta-analyzing studies on differences in brain activity or structure using neuroimaging techniques such as fMRI, PET, etc.. It has the possibility to combine studies from which only peak coordinates are available with studies from which SPM t-maps are available, thus highly increasing the power of meta-analysis. It is written in C language and has a free license available for downloaded.
SPM
SPM stands for Statistical Parametric Mapping. SPM is a web-based system developed by Penny et al. (33). SPM is a statistical program used to determine the difference in recorded brain activity by using spatially extended statistical processes that are used to test hypotheses during functional neuroimaging experiments. This tool uses brain imaging data. SPM is a free licensed tool, and it is available throughout the neuroimaging community in many laboratories. It is a MATLAB based functions and subroutines tool with some externally compiled C routines.
TORTOISE
TORTOISE stands for Tolerably Obsessive Registration and Tensor Optimization Indolent Software Ensemble developed by Pierpaoli et al. (34), and it is a stand-alone system compatible with the platforms of Linux and Mac. It is an integrated software package for processing diffusion MRI data. It is non-commercial and is freely available for download at www.tortoisedti. org. It is composed of two modules named DIFF PREP and DIFF CALC. DIFF PREP aims at having a robust and reliable image registration-based correction for motion, eddy current distortion and EPI distortion. DIFF CALC offers tools for tensor estimation, as well as many tensor derived metrics, and ROI utilities. The software is highly customisable to the user’s individual needs, and also provides the ability to export both diffusion weighted images (DWIs) and tensor quantities to several other commonly used software packages. It is written in C and C++ programming language.
Discussion
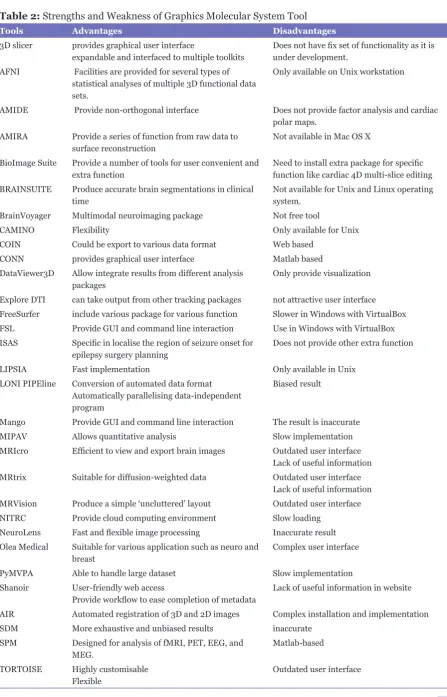
Many programs have been designed for molecular modelling and visualisation based on different criteria. However, each program has its own strengths and weaknesses. Some programs only support visualisation of protein molecules while others can support the visualisation of proteins and DNA, as well as other molecules. In addition, most of them provide more than just visualisation tools, like trajectories analysis for example, to meet various users’ needs. Furthermore, most programs generate the molecule image based on an uploaded file, either in PDF or cube file. However, some programs use the existing database information of the target molecule for the visualisation. Table 2 shows the main advantages and limitations of molecular modelling and visualisation software.
Conclusion
Table 2: Strengths and Weakness of Graphics Molecular System Tool
Tools Advantages Disadvantages
3D slicer provides graphical user interface
expandable and interfaced to multiple toolkits
Does not have fix set of functionality as it is under development.
AFNI Facilities are provided for several types of statistical analyses of multiple 3D functional data sets.
Only available on Unix workstation
AMIDE Provide non-orthogonal interface Does not provide factor analysis and cardiac polar maps.
AMIRA Provide a series of function from raw data to surface reconstruction
Not available in Mac OS X
BioImage Suite Provide a number of tools for user convenient and extra function
Need to install extra package for specific function like cardiac 4D multi-slice editing BRAINSUITE Produce accurate brain segmentations in clinical
time
Not available for Unix and Linux operating system.
BrainVoyager Multimodal neuroimaging package Not free tool
CAMINO Flexibility Only available for Unix COIN Could be export to various data format Web based
CONN provides graphical user interface Matlab based DataViewer3D Allow integrate results from different analysis
packages
Only provide visualization
Explore DTI can take output from other tracking packages not attractive user interface FreeSurfer include various package for various function Slower in Windows with VirtualBox FSL Provide GUI and command line interaction Use in Windows with VirtualBox ISAS Specific in localise the region of seizure onset for
epilepsy surgery planning
Does not provide other extra function
LIPSIA Fast implementation Only available in Unix LONI PIPEline Conversion of automated data format
Automatically parallelising data-independent program
Biased result
Mango Provide GUI and command line interaction The result is inaccurate MIPAV Allows quantitative analysis Slow implementation MRIcro Efficient to view and export brain images Outdated user interface
Lack of useful information MRtrix Suitable for diffusion-weighted data Outdated user interface
Lack of useful information MRVision Produce a simple ‘uncluttered’ layout Outdated user interface NITRC Provide cloud computing environment Slow loading
NeuroLens Fast and flexible image processing Inaccurate result Olea Medical Suitable for various application such as neuro and
breast
Complex user interface
PyMVPA Able to handle large dataset Slow implementation Shanoir User-friendly web access
Provide workflow to ease completion of metadata
Lack of useful information in website
AIR Automated registration of 3D and 2D images Complex installation and implementation SDM More exhaustive and unbiased results inaccurate
SPM Designed for analysis of fMRI, PET, EEG, and MEG.
Matlab-based
TORTOISE Highly customisable Flexible
Acknowledgement
This research is supported by a Fundamental Research Grant Scheme (Grant number: R.J130000.7828.4F720) from Malaysian Ministry of Education.
Conflicts of Interests
None.
Funds
Fundamental Research Grant Scheme (Grant number: R.J130000.7828.4F720).
Authors’ Contributions
Conception and design: MYM, MSO, MSM Analysis and interpretation of the data, drafting of the article: MYM, MSO
Final approval of the article: JY, FKCH Provision of study materials or patients: GS Obtaining of funding: MSM
Administrative, technical, or logistic support: SD
Correspondence
Dr Mohd Saberi Mohamad
BCh (Computer Network & Security) (UTM), MSc (Artificial Intelligence for Bioinformatics) (UTM), PhD (Osaka Prefecture University)
Artificial Intelligence and Bioinformatics Research Group
Faculty of Computing Universiti Teknologi Malaysia 81310 Skudai, Johor
Malaysia
Tel: +60-7-553 8788 Fax: +60-7-556 6164 Email: [email protected]
References
1. Raichle ME. Functional brain imaging and human brain function. J Neurosci. 2003;23(10):3959–3962.
2. Fedorov A, Beichel R, Kalpathy-Cramer J, Finet J, Fillion-Robin JC, Pujol S, et al. 3D Slicer as an image computing platform for the Quantitative Imaging Network. Magn Reson Imaging. 2012;30(9):1323– 1241. doi: 10.1016/j.mri.2012.05.001.
3. Cox RW. AFNI: software for analysis and visualization of functional magnetic resonance neuroimages.
Comput Biomed Res. 1996;29(3):162–173. doi: 10.1006/cbmr.1996.0014.
4. Loening AM, Gambhir SS. AMIDE: a free software tool for multimodality medical image analysis. Mol Imaging. 2003;2(3):131–137. doi: 10.1162/153535003322556877.
5. Stalling D, Westerhoff M, Hege H-C. 38 - Amira: A Highly Interactive System for Visual Data Analysis. In: Johnson CDHR, editor. Visualization Handbook. Burlington: Butterworth-Heinemann; 2005. 749-LXXVIII.
6. Papademetris X, Jackowski MP, Rajeevan N, DiStasio M, Okuda H, Constable RT, et al. BioImage Suite: An integrated medical image analysis suite: An update. Insight J. 2006;2006:209.
7. Shattuck DW, Leahy RM. BrainSuite: an automated cortical surface identification tool. Med Image Anal. 2002;6(2):129–142. doi: 10.1016/S1361-8415 (02)00054-3.
8. Goebel R. BrainVoyager--past, present, future.
Neuroimage. 2012;62(2):748–756. doi: 10.1016/j. neuroimage.2012.01.083.
9. Cook P, Bai Y, Nedjati-Gilani S, Seunarine K, Hall M, Parker G, et al. Camino: open-source diffusion-MRI reconstruction and processing. 2006.
10. Scott A, Courtney W, Wood D, de la Garza R, Lane S, King M, et al. COINS: An Innovative Informatics and Neuroimaging Tool Suite Built for Large Heterogeneous Datasets. Front Neuroinform.
2011;5:33. doi: 10.3389/fninf.2011.00033.
11. Whitfield-Gabrieli S, Nieto-Castanon A. Conn: a functional connectivity toolbox for correlated and anticorrelated brain networks. Brain Connect.
2012;2(3):125–141. doi: 10.1089/brain.2012.0073.
12. Gouws A, Woods W, Millman R, Morland A, Green G. DataViewer3D: An Open-Source, Cross-Platform Multi-Modal Neuroimaging Data Visualization Tool. Front Neuroinform. 2009;3:9. doi: 10.3389/ neuro.11.009.2009.
13. Leemans A, Jeurissen B, Sijbers J, Jones D. ExploreDTI: a graphical toolbox for processing, analyzing, and visualizing diffusion MR data. 2009.
14. Fischl B. FreeSurfer. Neuroimage. 2012;62(2):774– 781. doi: 10.1016/j.neuroimage.2012.01.021.
15. Jenkinson M, Beckmann CF, Behrens TE, Woolrich MW, Smith SM. Fsl. Neuroimage. 2012;62(2) :782-790. doi: 10.1016/j.neuroimage.2011.09.015
16. McNally KA, Paige AL, Varghese G, Zhang H, Novotny EJ, Jr., Spencer SS, et al. Localizing value of ictal-interictal SPECT analyzed by SPM (ISAS). Epilepsia.
2005;46(9):1450–1464. doi: 10.1111/j.1528-1167. 2005.06705.x.
18. Cloherty SL, Mustari MJ, Rosa MG, Ibbotson MR. Effects of saccades on visual processing in primate MSTd. Vision Res. 2010;50(24):2683–2691. doi: 10.1016/j.visres.2010.08.020.
19. Rex DE, Ma JQ, Toga AW. The LONI Pipeline Processing Environment. Neuroimage. 2003;19(3):1033–1048. doi: 10.1016/S1053-8119(03)00185-X.
20. Mueller SG, Weiner MW, Thal LJ, Petersen RC, Jack CR, Jagust W, et al. Ways toward an early diagnosis in Alzheimer's disease: the Alzheimer's Disease Neuroimaging Initiative (ADNI). Alzheimers Dement. 2005;1(1):55–66. doi: 10.1016/j.jalz.2005.06.003.
21. Sadigh-Eteghad S, Majdi A, Farhoudi M, Talebi M, Mahmoudi J. Different patterns of brain activation in normal aging and Alzheimer's disease from cognitional sight: meta analysis using activation likelihood estimation. J Neurol Sci. 2014;343 (1–2):159–166. doi: 10.1016/j.jns.2014.05.066.
22. Laird AR, Fox PM, Price CJ, Glahn DC, Uecker AM, Lancaster JL, Turkeltaub PE, Kochunov P, Fox PT. ALE meta-analysis: controlling the false discovery rate and performing statistical contrasts. Hum Brain Mapp. 2005;25(1):155–164. doi: 10.1002/ hbm.20136.
23. Bazin PL, Cuzzocreo JL, Yassa MA, Gandler W, McAuliffe MJ, Bassett SS, et al. Volumetric neuro image analysis extensions for the MIPAV software package. J Neurosci Methods. 2007;165(1):111–121. doi: 10.1016/j.jneumeth.2007.05.024.
24. Rorden C, Brett M. Stereotaxic display of brain lesions. Behav Neurol. 2000;12(4):191–200. doi: 10.1155/2000/421719.
25. Tournier J, Calamante F, Connelly A. MRtrix: diffusion tractography in crossing fiber regions. International
Journal of Imaging Systems and Technology.
2012;22(1):53–66. doi: 10.1002/ima.22005.
26. Behroozi M, Daliri MR. Software tools for the analysis of functional magnetic resonance imaging.
Basic and Clinical Neuroscience. 2012;3(5):71–83.
27. Goldszal AF, Davatzikos C, Pham DL, Yan MX, Bryan RN, Resnick SM. An image-processing system for qualitative and quantitative volumetric analysis of brain images. J Comput Assist Tomogr.
1998;22(5):827–837. doi: 10.1097/00004728-1998 09000-00030.
28. Schiff ND. Multimodal neuroimaging approaches to disorders of consciousness. J Head Trauma Rehabil.
2006;21(5):388–397. doi: 10.1097/00001199-2006 09000-00003.
29. Hanke M, Halchenko YO, Sederberg PB, Hanson SJ, Haxby JV, Pollmann S. PyMVPA: A python toolbox for multivariate pattern analysis of fMRI data.
Neuroinformatics. 2009;7(1):37–53. doi: 10.1007/ s12021-008-9041-y.
30. Hanson SJ, Matsuka T, Haxby JV. Combinatorial codes in ventral temporal lobe for object recognition: Haxby (2001) revisited: is there a "face" area?
Neuroimage. 2004;23(1):156–166. doi: 10.1016/j. neuroimage.2004.05.020.
31. Woods RP, Grafton ST, Holmes CJ, Cherry SR, Mazziotta JC. Automated image registration: I. General methods and intrasubject, intramodality validation. J Comput Assist Tomogr. 1998;22(1):139– 152. doi: 10.1097/00004728-199801000-00027.
32. Zilles K, Schleicher A, Langemann C, Amunts K, Morosan P, Palomero-Gallagher N,et al. Quantitative analysis of sulci in the human cerebral cortex: development, regional heterogeneity, gender difference, asymmetry, intersubject variability and cortical architecture. Hum Brain Mapp.
1997;5(4):218–221. doi: 10.1002/(SICI)1097-0193 (1997)5:4<218::AID-HBM2>3.0.CO;2-6.
33. Penny WD, Friston KJ, Ashburner JT, Kiebel SJ, Nichols TE. Statistical parametric mapping: the analysis of functional brain images: the analysis of functional brain images. Academic press; 2011.
34. Pierpaoli C, Walker L, Irfanoglu M, Barnett A, Basser P, Chang L, et al. TORTOISE: an integrated software package for processing of diffusion MRI data. 2010.
35. Craig PA, Michel LV, Bateman RC. A survey of educational uses of molecular visualization freeware.
Biochem Mol Biol Educ. 2013;41(3):193–205. doi: 10.1002/bmb.20693.
36. O'Donoghue SI, Goodsell DS, Frangakis AS, Jossinet F, Laskowski RA, Nilges M, et al. Visualization of macromolecular structures. Nat Methods. 2010;7 (3 Suppl):S42–55. doi: 10.1038/nmeth.1427.