http://www.sciencepublishinggroup.com/j/jccee doi: 10.11648/j.jccee.20180301.13
Variation of Ambient air Quality Scenario in Chittagong
City: A Case Study of Air Pollution
M. Arif Hossen, Asiful Hoque
Department of Civil Engineering, Chittagong University of Engineering & Technology, Chittagong, Bangladesh
Email address:
To cite this article:
M. Arif Hossen, Asiful Hoque. Variation of Ambient air Quality Scenario in Chittagong City: A Case Study of Air Pollution.Journal of Civil, Construction and Environmental Engineering. Vol. 3, No. 1, 2018, pp. 10-16. doi: 10.11648/j.jccee.20180301.13
Received: December 30, 2017; Accepted: February 8, 2018; Published: March 8, 2018
Abstract:
Chittagong, the commercial capital of Bangladesh, is experiencing crucial health impacts resulting from deficient air quality. The ambient air quality data for particulate matter as well as criteria of gaseous pollutants were assembled during December 2013 to December 2015 from the Continuous Air Quality Monitoring Station (CAMS) located at Agrabad, Chittagong. Analysis showed that during April- October, 24 hour average concentration of PM10 and PM2.5 were within the National Ambient Air Quality Standard (NAAQS) level but it increased about three times during the whole non-monsoon period (November-March).The highest values found of PM2.5 were 321.1µg/m3 in January, 2013 and 220.34µg/m3 in December 2015. Whether, the highest alarming concentration of PM10 was reported as 474µg/m3 in January 2007.The other gaseous pollutants such as SO2, NO2, O3 and CO remain well within the permissible limit except dry non-monsoon period. Theyearly average increase of Air Quality Index (AQI) value indicates the growth rate of air pollution in Chittagong city. The main responsible pollutant for air pollution is found PM2.5.
Keywords:
Air Quality, Gaseous Pollutants, AQI, PM2.5, PM101. Introduction
Chittagong city stands on the right bank of the river Karnaphuly. There are several sources of air pollution in Chittagong city, among them unfit vehicles and industries are notable. The numbers of mostly reconditioned vehicles are increasing in every year. One third of these vehicles do not have any fitness certificate. Due to port facility, this city is attractive for the investors to build up industry. A number of ‘Export Processing Zones (EPZ)’ has been established by the local and foreign investors (BBS, 2010). Most of the industries are not following the environmental rules and regulations. Along with this many urban areas and shopping and recreational facilities are present within the boundary of the study area considered where human exposure to air pollution caused by vehicular induced turbulence [2]. Though green landscape around Chittagong city and monsoon heavy rainfall helps to reduce the intensity of air pollution, a significant change in land uses and human intervention aggravate the degradation of air quality. The maximum temperature are between 29°C and 35°C in monsoon and minimum temperature are between 12°C and 17°C in winter.
The total annual rainfall throughout the city varies between 2159 mm (85 inches) and 3048 mm (120 inches) rising sometimes to 3810 mm (150 inches). On average approximately 80% of the rainfall occurs during the May to September monsoon. During summer season, winds are generally from the southeast. Easterly and northeasterly winds prevail during the winter periods. The 2011 National census determined that the Chittagong city corporation area had a population of approximately2592 thousands in approximately 558,097 households.
Air Research (NILU) conducted some research on air quality of Chittagong city.
Atmospheric pollution in urban areas is a major issue in many developing countries around the world. It is well recognized that air pollution has hazardous effects on human health causing respiratory diseases [9].Sulfur dioxide (SO2)
and nitrogen dioxide (NO2) are important primary pollutants
in the ambient air because of their adverse effects on human health and vegetation, their contributions to the acidification of the environment and the role of oxides of nitrogen (NO2)
in the formation of photochemical oxidants. NO2 contributes
to the buildup of tropospheric ozone (O3) and to the lifetime
of greenhouse gases [10] and thus be also a key species for global warming. Particulate air pollution can be generated by natural and anthropogenic activities. Anthropogenic sources can be stationary and mobile. It has been estimated in many countries that, traffic-related emissions constitute more than 50% of the total particulate air pollution [8].
Chittagong (latitude 22.22N, longitude 91.47E) has the largest port in Bangladesh, and is heavily trafficked, especially the central city area covering about 10 km2. The main road network in the city goes toward the port area and northward toward the industrial areas. These roads are also heavily trafficked, with persistent traffic jams most of the day. Trucks transporting goods between the port and the industrial areas constitute a significant part of the traffic, and the combination of the hilly nature of the area, the stop and start mode of the congested traffic, and the age and heavy loading of most of the trucks causes large emissions of black diesel smoke. Brick kilns are important source of building materials and pollution. Prior work in Dhaka has suggested a major role for brick kilns in producing air pollution there [4]. Vehicular emissions, as well as biomass/coal burning for cooking and in the brick kilns around the city, are the main contributor to these emissions [11].Ambient air quality standards for Bangladesh and WHO guideline is showing in the table 1.
Table 1. Ambient air quality standards for Bangladesh and WHO Guideline.
Pollutant Bangladesh standard WHO Guideline Averaging time
Carbon Monoxide (CO) (mg/m3) 10 (9 ppm) 10 8 hour(a)
40 mg m3/ (35 ppm) 30 1 hour(a)
Oxides of Nitrogen (NOx) (µg/ m3) 100 µg/ m3 (0.053 ppm) - Annual
Particulates (PM10) (µg/ m3) 50 µg/ m
3 15 Annual(b)
150 µg/ m3 50 24 hours(c)
Fine Particulates (PM2.5) (µg/ m3) 15 µg/ m
3 10 Annual
65 µg/ m3 25 24 hours
Ozone (O3) (µg/ m3)
235 µg m3/ (0.12 ppm) - 1 hour(d)
157 µg/ m3 (0.08 ppm) 100 8 hours
Sulfur dioxide (SO2) (µg/ m3)
80 µg/ m3 (0.03 ppm) - Annual
365 µg/ m3 (0.14 ppm) 20 24 hours(a)
Notes:
(a) Not to be exceeded more than once per year.
(b) The objective is attained when the annual arithmetic mean is less than or equal to 50 ug/ m3.
(c) The objective is attained when the expected number of days per calendar year with a 24- hour average of15 µg/ m3 is equal to or less than 1.
(d) The objective is attained when the expected number of days per calendar year with the maximum hourly average of 0.12 ppm is equal to or less than 1.
2. Methodology
The ambient air quality monitoring network Bangladesh consists of eleven (11) fixed Continuous Air Monitoring Stations (CAMS). There are two stations in Chittagong one at TV station, Khulshi and another at Agrabad. According to staff correspondence, the report of TV station CAMS is not reliable. That’s why choose Agrabad CAMS data for this research.
Multiple gaseous / PM analyzers as shown in Figure 1 are used for Continuous gaseous monitoring. Gaseous PM analyzers were made by Environment S.A., France. UV Fluorescence was used as SO2 analyzer; chemiluminescence
was used as NO2 analyzer, while NDIR principle was
employed to analyze CO. CH4 and non CH4 were measured
by Flame Ionization Detector. Particulate matter was analyzed by Beta Gauge analyzer and O3was measured by
UV Fluorescence. All instruments were certified by USEPA. An air quality index (AQI) is a number used by government agencies to communicate to the public how polluted the air currently is or how polluted it is forecast to become. As the AQI increases, an increasingly large
percentage of the population is likely to experience increasingly severe adverse health effects.
Figure 1. Air Quality Monitoring Equipment at Agrabad CAMS.
Ip = (Cp – BPLo)+ ILo
Where, IP = the index value for pollutant P;
= the truncated concentration of pollutant P; = the breakpoint that is ;
= the breakpoint that is ≤ ;
= the AQI value corresponding to ; = the AQI value corresponding to ;
3. Result & Discussion
From the analysis it is clear that, the concentration of all pollutants are below their respective standard limit (Table 1)
during monsoon period (April to October).
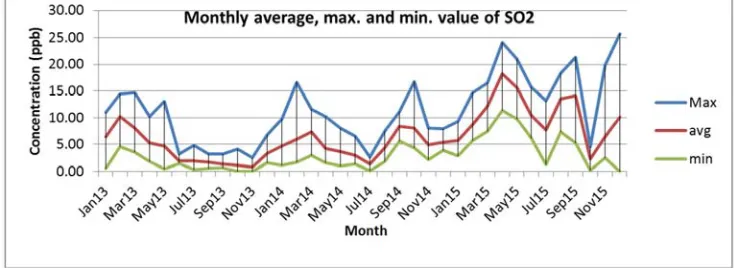
However, the average highest concentration of SO2 was
found in April, 2015. But the highest and lowest 24 hour monthly concentration of SO2 was 25.75 ppb and 0.00 ppb in
December, 2015 and October, 2013 respectively. The highest concentration of NO2 found 37.74 ppb in October, 2014. In
January 2013 and June 2015 highest and lowest 24 hour monthly average concentration of NO2was found to be 21.76
ppb and 0.09 ppb respectively.
All the value found of SO2 and NO2throughout the year
2013-2015 were within the standard limit. Figure 2 and figure 3 represent the maximum, minimum and average concentration of SO2 and NO2.
Figure 2. 24 hour average NO2 at CAMS, Chittagong (monthly average, maximum and minimum).
Figure 3. 24 hour average SO2 at CAMS, Chittagong (monthly average, maximum and minimum).
The National Ambient Air Quality Standard for PM2.5 is
65µg/m3 for 24 hour on average (Table 1) and for annual arithmetic mean the standard is 15 µg m3/. Figure 4 presented the individual PM2.5 data measured at CAMS in 2013- 2014.
It revealed clearly the seasonal variation of PM2.5
concentration in monsoon (April to October) and non-monsoon (November to March) period against the 24 hour average standard since December 2013. Moreover, from November to March PM2.5 exceeds 24 hour average standard.
The concentration starts to decrease from February and it continues till July and again it starts to increase from August and continues till January. In the period of April to October, the concentration of PM2.5 remains below the 24 hours
standard. In fact, 24 hour average PM2.5 concentration starts
to increase inOctober. The maximum concentration of PM2.5
has been observed in January, 2013 which is 321.1 µg/m3. It has behaved like other gaseous pollutants. The maximum and minimum value of PM2.5, 24 hour average concentration was
found to be 183.2µg m3/ in January 2013 and 18µg/m3 in July 2013 respectively.
The National Ambient Air Quality Standard for PM10 is 150µg/m3 for 24 hour average and for annual arithmetic mean the standard is 50 µg/m3 (Table 1). Figure 5 presents the individual PM10 data measured at CAMS in 2013-2014. 24
hour average monthly concentration of PM10 has been found
was the worst polluted month in terms of PM2.5 and PM10.
The highest values found of PM2.5 were 321.1µg/m3 and
PM10 were 474 µg/m3 in January, 2013.24 hour average
concentration in January 2007 and December 2008
respectively. The maximum and minimum value of PM10, 24
hour average concentration was found to be 289.9µg/m3 in January 2013 and 33.2µg/m3in September, 2013 respectively.
Figure 4. 24 hour average PM2.5 at CAMS, Chittagong (monthly average, maximum and minimum).
Figure 5. 24 hour average PM10 at CAMS, Chittagong (monthly average, maximum and minimum).
The Daily Air Quality Index (AQI) is calculated for the year 2013- 2015 considering six criteria pollutants (NO2,
SO2, CO, O3, PM2.5, and PM10). The maximum AQI was
found 371 in 10 January 2013 which classify as Hazardous. The responsible pollutants found for air pollution in Chittagong city is PM2.5. In almost all the cases, the
concentration of PM2.5 governed for AQI. The average AQI
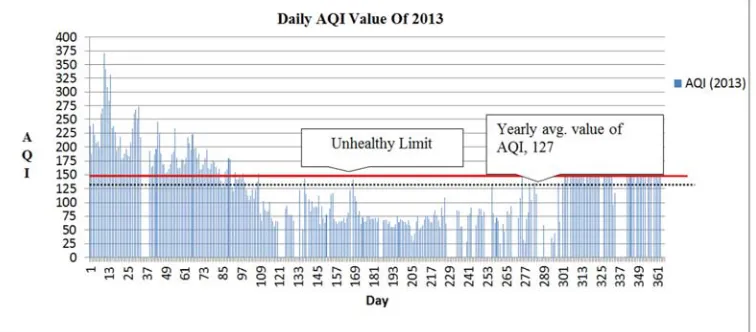
of the year 2013, 2014 and 2015 is 127, 132 and 133 respectively. This is the indication of increasing air pollution in Chittagong city. Figure 6 to figure 8 represent the daily AQI trend from 2013 to 2015.
Figure 7. Daily AQI for the year 2013.
Figure 8. Daily AQI for the year 2013.
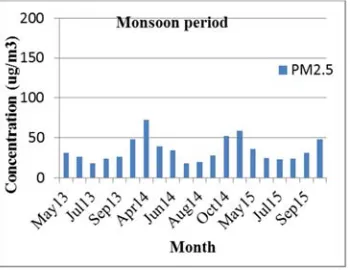
The concentration of most responsible pollutants for AQI PM2.5 considerably decrease in monsoon season, that’s why
the value of AQI remain below 100 which is categorized according to USEPA as moderate for health impact. The yearly average value of AQI for Chittagong city is above 100 which mean the environmental condition is unhealthy. Figure 7 & figure 8, represent the concentration of PM2.5 in
monsoon and non-monsoon period.
Figure 9. PM2.5 Concentration in monsoon period.
Figure 10. PM2.5 Concentration in non-monsoon period.
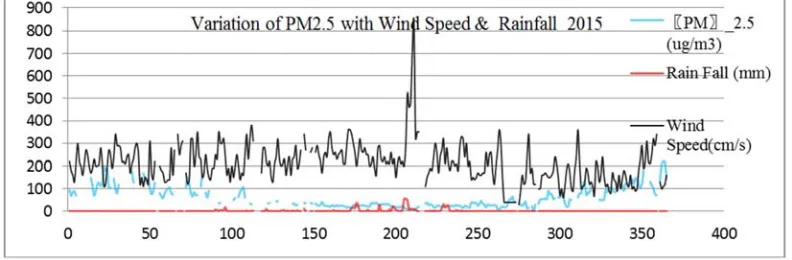
The pollutants concentration largely depends on meteorological parameters. When the rainfall and wind speed is high specially in monsoon period the concentration of PM2.5 slows down. The time series plot of PM2.5 and
metrological parameter presented in Figure 9 to 11, shows temporal (daily) variation of PM2.5 concentration with the
Figure 11. Temporal(daily) variation of PM2.5 concentration with variable wind speed & rainfall in 2013.
Figure 12. Temporal (daily) variation of PM2.5 concentration with variable wind speed & rainfall in 2014.
Figure13. Temporal (daily) variation of PM2.5 concentration with variable wind speed & rainfall in 2015.
4. Conclusion
Chittagong City is experiencing several problems due to air pollution. Though the problem is not too much acute like other busy city but it will face worse condition in upcoming days if proper steps would not been taken. Particulate matter is being identified as the main pollutant of concern. Data from the monitoring station reveals that the pollution from particulate matters greatly varies with climatic conditions. While the concentration level comes down the limit value in the monsoon period (April-October), it goes beyond the limit during non-monsoon time and sometimes even crosses three times during the non-monsoon period (November-March).
The extent of pollution level during non-monsoon period was found to be much higher than the standard level indicating alarming threat to the human health. The highest values found of PM2.5 were 321.1 µg/m3 in January, 2013 and
References
[1] Amos P.K. Tai, Loretta J. Mickley, Daniel J. Jacob. Correlation between Particulate Matter Concentrations and Meteorological Parameters at a Site in Ile-Ife, Nigeria. Ife Journal of Science, 14(1):83-93.
[2] Begum BA, Biswas SK, Nasiruddin M, Hossain AMS and Hopke PK. (2009). Source Identification of Chittagong Aresol by Receptor Modeling. Environmental Engineering Science., 26(3):679-689.
[3] Begum BA, Kamal M, Salam A, Salam MA and Biswas SK (2011). Assessment of particulate air pollution at Kalbagan and Shisumela area along the Mirpur Road. Bangladesh J. Sci. Ind. Res. 46(3):343-352.
[4] Begum BA, Kim E, Biswas SK and Hopke PK (2004).Investigation on sources of atmospheric aerosol at urban and semi-urban areas in Bangladesh. Atmos.Environ., 38: 3025-3038.
[5] Begum BA, Kim E, Biswas SK and Hopke PK (2006). Impact of banning two-stroke engine on airborne particulate matter concentrations in Dhaka, Bangladesh. J.Air Waste Manage. Asso.56:85-89.
[6] Begum BA, Saroar M, Nasiruddin M and Biswas SK
(2012).Gound-Level Concentration of Ozone in Ambient Air in Chittagong City. Bangladesh J. Sci. Ind. Res. 47(1):83-88.
[7] Brandon C (1997). Economic valuation of air and water pollution in Bangladesh. Workshop Discussion Draft, The World Bank.
[8] Colvile et al., 2000. The transport sector as a polluter
[9] Dockery DW, Pope CA, Xu XP, Spengler JD, Ware JH, Fay ME, Ferris BG and Speizer FE (1993) An association between air pollution and mortality in six U. S. cities. New England Journal of Medicine, 329: 1753-1759.
[10] Houghton, J. T., Jenkins, G. J. & Ephraums, J. J. (eds) (1990).
Climate Change, The IPCC Scientific Assessment. Cambridge University Press, Cambridge, 365 pp.
[11] Kassomenos P. (1993) Study of the atmospheric conditions during air-pollution episodes in the Greater Athens area. Ph.D. thesis, Department of Applied Physics, University of Athens, 173 pp. (in Greek).
[12] Rouf MA, Nasiruddin M, Hossain AMS and MS Islam. (2011). Trend of Particulate Matter PM 2.5 and PM 10 in Dhaka City. Bangladesh J. Sci. Ind. Res. 46(3): 389-398.