http://www.sciencepublishinggroup.com/j/sjams doi: 10.11648/j.sjams.20170502.14
ISSN: 2376-9491 (Print); ISSN: 2376-9513 (Online)
Determinants of Food Access of Old People in Dire Dawa
City, Ethiopia: An Ordinal Logistic Regression Analysis
Nibret Alene Bemanjo, Dawit Daniel Dando
Department of Statistics, College of Natural and Computational Sciences, Dire Dawa University, Dire Dawa, Ethiopia
Email address:
[email protected] (N. A. Bemanjo), [email protected] (D. D. Dando)
To cite this article:
Nibret Alene Bemanjo, Dawit Daniel Dando. Determinants of Food Access of Old People in Dire Dawa City, Ethiopia: An Ordinal Logistic Regression Analysis. Science Journal of Applied Mathematics and Statistics. Vol. 5, No. 2, 2017, pp. 85-93.
doi: 10.11648/j.sjams.20170502.14
Received: January 27, 2017; Accepted: February 18, 2017; Published: March 22, 2017
Abstract:
Although Ethiopia is a young country with 46 per cent of the population under the age of 14, over five per cent of the 81 million Ethiopians are aged 60 years or more. This proportion of older persons is anticipated to nearly double to nine per cent by 2050. There are several factors that could hinder old people access to food such as income, health status, household size, disability and others (HAIE, 2011). This objective of this study was to assess the old people access to food and its determinants in Dire Dawa city. Total samples of 947 old people were taken by using cluster sampling over proportional allocation to each kebele. Quantitative and qualitative data has been collected from aged persons in Dawit Aid for Aged persons Association, Asegedech Association and other appropriate enumeration areas. The descriptive analysis resulted that 72.76% were members of the associations. Most (74.3%) members of the organization have medium and above food access. Additionally their life have been improved in terms of obtaining medical, clothing and counseling service after they joined the organizations. The ordinal logistic regression identified income source, occupation, owning a house and type of membership organization as determinants of daily food access for the elderly.Keywords: Dire Dawa University, Elderly People, Food Access, Ordinal Logistic Regression, Ethiopia
1. Introduction
Ethiopia is located in the horn of Africa with a land area of about 1.1 million square kilometer and a population size of about 81 million persons in 2007; it is one of the largest and populous countries in Africa. It stood third in terms of population size and 9th in terms of geographic area in the whole of Africa. The country is divided into 9 federal states and two city administrations. Each regional state or city administration are sub-divided into zonal and Woreda (district) level administrations. The country is divided into 69 zones and 560 woredas. Woredas are the lowest administration with elected government [1].
Although Ethiopia is a young country with 46 per cent of the population under the age of 14, over five per cent of the 81 million Ethiopians are aged 60 years or more. This proportion of older persons is anticipated to nearly double to nine per cent by 2050. Older men who live up to 60 years can be expected to live an additional 15 years and older women
an additional 16 years after their 60th birthday [1].
adequacy is positively associated with self-rated health and quality of life among adults in higher-income countries [2]. However, their ability to provide consistent support is challenged through exclusion and discrimination.
1.1. Government’s View on Older Persons
The constitution of Ethiopia is the basis to ensure the welfare of the general public. The government is committed to institute affirmative action in terms of the disadvantaged and vulnerable people. This is explicitly stated in the developmental social welfare policy. As it is indicated in the policy, the underlying cause of old age poverty is lack of family support and absence of a comprehensive social security system. Moreover negative attitude, lack of community participation and lack of active involvement of relevant sectors exacerbated their plights.
To tackle theses severe social and economic problems of older persons the government recognizes the need to mobilize available resources, involve public at large as well as give support to regional governments, non-governmental organizations and institutions, which are engaged in the provision of social welfare services for the aged.
Ethiopia was one of the 124 state members of the UN who has participated in the first world assembly on Ageing that took place in Vienna, Austria in 1982 to discuss the economic, social, cultural and hum-anitarian implications on the tremendous increase of the ageing of the population. Since the endorsement of the Vienna International Plan of Action on Ageing, the country took initiative to adapt the plan into its national development plan. But due to the fact that it is a poor country, much of the plan could not be implemented as it was envisaged earlier [2].
1.2. Older Persons Association
Currently more that 60 older persons and pensioners associations are registered and established officially. The government is encouraging older persons and pensioners to be organized in these associations so that they voice their problems, rights and potential. The Ethiopian Elderly and pensioners National Association is an umbrella Association which was established with the aim to reduce old age poverty, advocate on behalf of older people and pensioners, provides training, encourage experience and improves the capacity of organizations working with older people and pensioners in Ethiopia. All association are facing a big challenge to fulfill their objectives by their limited capacity of finance and man power. The government, HelpAge International and to some extent UNFPA are the only ones to fund their programmes [2].
The first intervention taken was to provide institutional support and eventually the first residential home was built in Harar, eastern part of the country, by the name of Abraha Bahta Home for the Aged.
Dawit Aid for Aged Persons Association is a non-profit making a non-governmental association established in Dire Dawa as of 2006 and it is now registered by the Federal
Ministry of Justice Charities and Socities Agency in accordance to proclamation number 621/2009 and given the registration certificate and license.
It is engaged in helping destitute and poor older people who lack family assistance and very weak to earn their livelihood from labour. The association has started its efforts by pulling supports from different committed and interested individuals who are devoted to provide assistances to needy older people in realizing its vision and objectives. DAAPA is currently supporting over Nine Hundred destitute elder people in the Nine kebeles of Dire Dawa town and is also initiating its effort in Harar town as well [3].
It gives food aid collectively in central place and home to home to those severely weak. It also engaged in giving pre medical care three days per week in association with America Welfare Organization and has acquired agreement with the Dire Dawa health bureau to get free health service for the old people who come through DAAPA. It is also engaged in income generating schemes such as weaving and backyard gardening etc. Some of the ongoing good practices of the Association are adopting community based interventions, mobilizing all kebele administration into the issue, organizing very strong street walking event at city level to generate income, mobilizing higher education institution students to help elders and providing health and HIV/AIDS service to the elders through volunteer health professionals.
In Ethiopia like other developing countries, the problems of the elderly are the most prevalent and wide spread phenomenon. It is assumed that the most important underlying causes of these problems have been poverty, economic crises, civil war and drought associated with famine. It’s a result of these that the Ethiopian elderly are obliged to live in adverse destitution. For many years in the past most problems of older persons were addressed by families and communities through traditional support mechanisms. Strong associations exist between psychological well-being and physical health status in later life, particularly in relation to life-limiting illnesses [10].When the capacity of the family to support their elderly citizens becomes weakened, the philanthropic organizations and individuals realize that significant number of older persons with no family, abandoned and destitute should be assisted.
compared to other towns of the country which requires immediate intervention in areas of food (100%), clothing (80%), institutional support-PSS (22%) and Shelter maintenance support (28%) [3].
HelpAge International Ethiopia is the international organization working explicitly with and for older persons in Ethiopia. Although, some achievements have been made by HAIE to improve the quality of lives of older persons, more efforts should be exerted to advocate the support economic activity of older persons by expanding its support to areas untouched so far.
As sufficient food access is what the government keeps working on, and one of the Millennium development goals, to achieve, it gets worse with the aged ones. They need high food access to sustain their life healthy in addition to their other needs. Apparently, sustaining needs daily mealing which is not the case with the old folks here. Food insecurity for older persons is acute and a majority of destitute older persons are not meeting minimum daily food needs. Hence the main purpose of this study was to assess the old people access to food and its determinants in Dire Dawa city. In doing so it is possible to examine to what degree the predictors are associated with food access. Additionally comparison can be made between the old persons inside and outside the community based associations (Dawit Aid for Age Persons Association and Asegedech Asfaw old persons Aid and Rehabilitation organization) in terms of their food access.
2. Data and Methodology
2.1. Source of Data
The study was conducted on urban part of the Dire Dawa city administration which is located 515Kilometers to the east of Capital city, Addis Ababa, and 311 kilometers to the west of port Djibouti. The city is divided into Nine kebeles which all are to be incorporated as part of the study area. The total old population in the city administration is 16,463 of which 11,413 people reside in urban area where as 5050 live in the rural area [11].
The researchers used primary and secondary data for the study. The data was collected by preparing questionnaire for interview and observation. Enumerators, with continuous supervision, contacted each and every respondent face-to-face to get questionnaire filled. Additionally qualitative data has been collected from employee working on the Community based association about the service they provide for elderly folks. Furthermore, the consent of participant (old people), confirmed being fully informed of the study objectives prior to the interview. In order to avoid communication discrepancies between the data collector and the respondents, the questions had been translated to Amharic, Afan-Oromo and Somali. Data was collected taking individual kebele as a cluster and hence Cluster sampling was used after which proportional allocation to each Kebele was done later.
Packages: The packages used for data analysis are SPSS 21.0 and SAS.
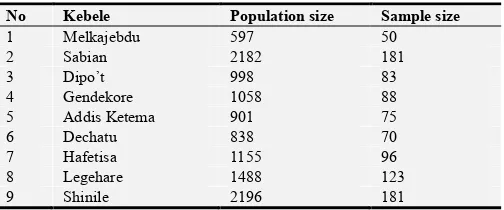
Table 1. Sampled individuals from each kebele.
No Kebele Population size Sample size
1 Melkajebdu 597 50
2 Sabian 2182 181
3 Dipo’t 998 83
4 Gendekore 1058 88
5 Addis Ketema 901 75
6 Dechatu 838 70
7 Hafetisa 1155 96
8 Legehare 1488 123
9 Shinile 2196 181
2.2. Data Analysis
Descriptive statistics together with graphical presentation was used for selected determinants. Chi-square values were calculated for selected determinants such as Means of income, owning a house, Living status, Mobility, Accident.
Ordinal Logistic Regression Model
Logistic regression is a popular modeling approach when dependent variable is dichotomous or polytomous as well. In this study the response variable is daily food access of old people which is categorized as ‘Low’, ‘Medium’ and ‘high’ per day i.e. Low daily food access represents once mealing per day, Medium daily food access represents twice mealing per day and High daily food access represents three, or more times mealing per day
This model allows one to predict outcomes, from a set of variables that may be continuous, discrete, dichotomous, or a mix of any of these. Hosmer and Lemeshow has described logistic regression focusing on its theoretical and applied aspect [5].
Model Specification
In the terminology of logistic regression analysis the odds of a success is defined to be the ratio of the probability of a success to the probability of a failure. Hence if p is the true success probability (i.e. old people life standard improvement in this study), the odd of a success is p/(1-p). When the odds is computed for the two different categories and the ratio is used, it is odds ratio.
On occasion, however, the response variable may have more than two levels, logistic regression can be employed by means of polytomous-or multicategory- logistic regression model. When the response categories are purely qualitative and not ordered in any way, the respective multilogit model is called Nominal polytomous regression but categories are frequently ordered in which case we use the more parsimonious and more easy category of the multilogit model called Ordinal logistic regression with proportional odds model.
= 1 ∶ < 1 = = (1)
= 2 ∶ < 2 = = (2)
The difference between the above two equations involves the intercept terms α1 and α2. The slopes β1 are the same in both the expressions. For the multiple regression case involving J ordered categories it becomes
= ! "
⋮
$ %
& '
( = ! ( ( ("
⋮ ( $ %
& '
The earlier two equations become for category j:
≤ = * + ,
-* + , - . = 1, 2, … , 1 − 1 (3)
Equation (3) is referred to as the proportional odds model. In this model each category of the J ordinal category response variable is considered in turn and the frequency of response atleast upto that point on the ordinal scale is compared to the frequency for all the rest combined, then the first and the second combined are compared to all the rest combined, and so on, which results in the original J-response table being converted into a series of J-1 sub tables, each with a binary categorization, lower or higher than the point on the scale. Taking the logit transformation of both sides yields the J -1 cumulative logits:
3 4 5 $6 7 86 7 8 9 = : + <( . = 1, … , 1 − 1 (4)
In the nominal case each of the J-1 parameter vectors ( is unique where as in the ordinal response the slope coefficient vectors ( are identical for each of the J – 1 cumulative logits but the intercept differs. As in the binary logistic regression case, each slope parameter can again be interpreted as the change in the logarithm of odds ration –this time the cumulative odds ratio- for a unit change in its associated predictor.
For an ordinal response variable with J categories, comparing adjacent categories, that is each category to the next category, leads to the model know as Adjacent-category logits [6]. It is defined for an individual or subject I to be:
3= > ?@+
?@,+A B = : + (
< , = 1, 2, … , 1 − 1 (5)
If we let the expected frequencies be modeled as in the above, then the above model is equivalent to:
3= >?@,+A
?@,+ B = : + (
< , = 1, 2, … , 1 − 1 (6)
In these to formulations the adjacent category model is obtained by the imposition of a constraint on the set of (J-1) equations in either of the above equations. Specifically we impose the constraint ( = ( for all j.
The most commonly used method of estimating the parameters of a logistic regression model is the method of Maximum Likelihood (ML). In this model the likelihood equations are non-linear explicit function of unknown parameters. Therefore, we use a very effective Non-linear iterative method to solve the equations which is known as iteratively reweighted least square algorithm. The significance of the estimated parameters was tested using Wald statistic. It is an alternative test which is commonly used to test the significance of the individual logistic regression coefficients for each independent variables
Parameter Estimation and Testing
The most commonly used method of estimating the parameters of a logistic regression model is the method of Maximum Likelihood (ML). In this model the likelihood equations are non-linear explicit function of unknown parameters. Therefore, we use a very effective Non-linear iterative method to solve the equations which is known as iteratively reweighted least square algorithm.
In general, the sample likelihood function is defined as the joint probability function of the random variables. Specifically, suppose (y1, y2…yn) be the n independent random observations corresponding to the random variables (Y1, Y2……Yn). Since the Yi is a Bernoulli random variable, the probability function of Yi is fi(Yi) = πiYi (1-πi) 1-yi; Yi = 0 or 1; i = 1, 2,..., n, since Y’s are assumed to be independent, the joint probability function or likelihood function is given by [7]:
4 , , … , C = ∏CF E 1 − $E
(7)
And the log-likelihood function as:
G*(H, ( , … , ( - = 3 IJK − ∑C
F *(H+ ( + ( + ⋯ + ( - − ∑ 3=N1 +CF
OPQ*(H+ ( + ( + ⋯ + ( -R (8)
The significance of the estimated parameters will be tested using Wald statistic. It is an alternative test which is commonly used to test the significance of the individual logistic regression coefficients for each independent variable (that is, to test the null hypothesis in logistic regression that a particular logit (effect) coefficient is zero i.e. H0:
β
i =0 againstβ
i ≠0). For a dichotomous independent variable, the Wald statistic (W) is2
ˆ ˆ var( )
i
i
W β
β
= (9)
For large sample size this statistic has an approximate chi-square distribution with one degree of freedom.
Model Diagnostics
qualities. Even though this is so, the data will go through the usual model diagnostics such as Checking for outliers and missing values, checking the degree of Multicollinearity between the covariates and setting them free if found to be victim of this problem.
Goodness –of- Fit test
Once a model has been developed, we would like to know how effective the model is in describing the outcome variable. This is referred to as goodness-of-fit. In testing the hypothesis that the model fits the data, the two common approaches are Pearson’s X2 statistic and the likelihood-ratio statistic G2 [6].
If our logistic regression model has a single, continuous, explanatory variable, then a test of fit can be constructed by grouping values of the explanatory variable into several intervals and using the Pearson chi-square statistic, which under the null hypothesis will have an approximate chi-square distribution with degrees of freedom equal to the number of groups minus two (the number of parameters in the model).However, if we have several explanatory variables, some of which are continuous, a test of fit becomes somewhat more difficult. If there are, for instance, two continuous explanatory variables, and we break up the range of values of each of them into several groups, we may find that there are sparse cells in the table. As the number of explanatory variables increases, the problem of sparse cells becomes more apparent.
Hosmer and Lemeshow proposed a different approach to grouping, one that does not depend on the number of explanatory variables. They proposed breaking up, not the ranges of values of continuous explanatory variables, but the probabilities estimated from the original, ungrouped data. The data set, of size n, is sorted according to the probabilities estimated from the final logistic regression model. Then the data set is partitioned into several (Hosmer & Lemeshow recommends 10) equal-sized groups. The first cell corresponds to the n/10 observations having the highest estimated probabilities. The next cell corresponds to the n/10 observations having the next highest estimated probabilities, etc. A Pearson-like statistic is constructed based on the observed and expected cell frequencies.
Let Y denote the response variable. Assume that the final model used q explanatory variables, and thus has q + 1 parameters. Let
Y
ijbe the observed value of the responsevariable for the jth observation in the ith group of the partition,
where i = 1, 2, …, g and j = 1, 2, …, ni. Then
1 i n ij j Y =
∑ is the
observed frequency in the ith cell of the partition. Let
0 1 0 1 ˆ ˆ exp ˆ ˆ ˆ 1 exp q k kij k ij q k kij k x x β β π β β = = +∑ = + +∑
denote the estimated success
probability for the jth observation in the ith cell of the
partition. Then 1 ˆ i n ij j π =
∑ is the expected cell frequency for the
ith cell of the partition. The statistic proposed by Hosmer and Lemeshow is 2 1 1 1 1 1 ˆ
ˆ 1 ˆ /
i i
i i
n n
ij ij
g j j
n n
i
ij ij i
j j Y HL n π π π = = = = = − ∑ ∑ =∑ − ∑ ∑ (10)
Hosmer and Lemeshow showed that, when the number of distinct patterns of covariate values equals the sample size, the null distribution of HL is approximately chi-square with d.f. = g – 2. They recommend using this test when sample size is greater than or equal to 400.
If the calculated value of the Hosmer-Lemeshow goodness-of-fit test statistic is greater than 0.05, we will not reject the null hypothesis that there is no difference between observed and model-predicted values, implying that the model estimates are adequate to fit the data at an acceptable level.
3. Results and Discussion
The Ethiopian government provides institutional care for older persons outside of the capital city Addis Ababa. The first is Bete selehome home for the aged. This institution is located 110 km north of Addis Ababa and provides shelter, food, clothing, free medical care and recreational facilities for more than 250 older persons. The other is Abraha Bahta home for the aged located in the eastern part of the country rendering institutional service for 220 older people [9]. The government also provides free medical service to the poor including the elderly. Similarly, in Dire Dawa city there are two non-profit community based associations established for serving elderly people. Namely DAAPA and Asegedech Asfaw aid for old peoples association. In fact, all old people in the city are not incorporated in these associations, the Figure 1 below showed about 689(72.76%) of sample old peoples were member of one of the associations, DAAPA/Asegedech, and the rest are not.
Figure 1. Respondents’ association membership.
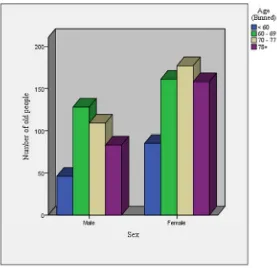
Figure 2. Age category by gender composition of the respondents.
The demographic characteristics result on Table 1 shows that from the total sample most When asked whether they were members of any association for old people about 94.3% from kebele four replied ‘yes’ and 49.7% from kebele said ‘No’.
Food Access status across kebeles were seen 44% and 36.5% of sample old people from kebele one and kebele nine
respectively responded their daily food access is Low while 40.9% and 30.7% respondents from kebele four and five say high. The minimum household size of sample old people in the city showed one person while the maximum fifteen and the average family size of all sample old people was calculated to three individuals.
Table 2. Socio-demographic characteristics of old people across Kebeles in Dire Dawa City.
Variable K-01(%) K-02(%) K-03(%) K-04(%) K-05(%) K-06(%) K-07(%) K-08(%) K-09(%)
Member of Association
Yes 38(76) 91(50.3) 60(72.3) 83(94.3) 63(84) 56(80) 84(87.5) 77(62.6) 137(75.7)
No 12(24) 90(49.7) 23(27.7) 5(5.7) 12(16) 14(20) 12(12.5) 46(37.4) 44(24.3)
Food Access Low 22(44) 55(30.4) 28(33.7) 22(25) 21(28) 25(28) 35(35.7) 40(32.5) 66(36.5)
Medium 14(28) 96(53) 30(36.1) 30(34.1) 31(41.3) 31(41.3) 45(46.9) 75(61) 79(43.6)
High 14(28) 30(16.6) 25(30.1) 36(40.9) 23(30.7) 14(20) 16(16.7) 8(6.5) 36(19.9)
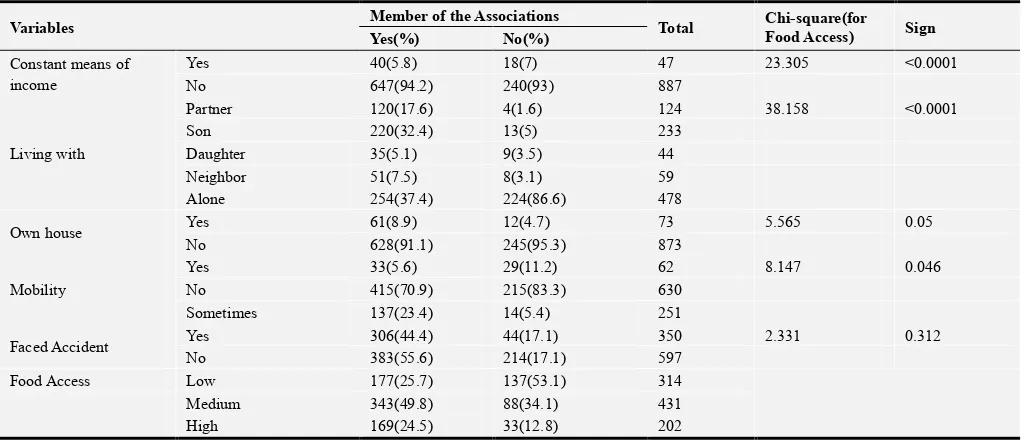
In an effort to understand whether respondents in the associations were better off or not indicators related to their means of income, access to food and others were investigated. As it can be seen in the Table 2 from the respondents within the associations 647(94.2%) do not have constant means of income where as from those not members of the associations 240(93%) do not have constant means of income. Low income may be temporary in which case it is less harmful to a person’s wellbeing, status or self-image. Unfortunately the situation goes beyond the issue of low income for this group of Ethiopian elderly people. They (especially those receiving institution based care) have no income and no support from family or the state and lived in a state of constant hunger and without shelter. It can also be seen that from their respective population i.e. members and not members, much of old people (7%) not in the associations have constant means of income.
When we look into their status of living, most of the old people, 478, 233 and 124 live alone, with their son and partner (Husband) respectively. Older women live alone than older men [1]. Additionally 91.1% of those in the associations and 95.3% of those out of the associations do not own their house. The result also suggested that larger number of old people (11.2%) are engaged in any kind of mobility, mostly looking for water, that those in the association (5.6%). From both groups of old people larger (70.9% from the associations and 83.3% from not in the associations) amounts do not mostly move around. Problem of access to shelter, including shortage of houses to rent, and poor condition of the houses were identified to be among the most important Vulnerability of Older People in Ethiopia concerns of poor older people.
When asked whether they faced any kind of accident in the lifetime 44.4% of those in the associations and 17.1% from the aged out of associations responded as ‘yes’. Similarly about 55.6% (association members) and 17.1% (not members) responded ‘No. Further analysis for cause of the accident revealed that fire and car accident were their mostly reported incidence of accident.
Table 2 also included the test of associations between different predictors and food access of the old people. The result suggested that there exists statistically significant associations between constant means of income, status of living which is who they live with, owning house and constant mobility have association with daily food access of the aged.
Table 3. Test of Association between predictor variables and Food access of old people.
Variables Member of the Associations Total Chi-square(for
Food Access) Sign Yes(%) No(%)
Constant means of income
Yes 40(5.8) 18(7) 47 23.305 <0.0001
No 647(94.2) 240(93) 887
Living with
Partner 120(17.6) 4(1.6) 124 38.158 <0.0001
Son 220(32.4) 13(5) 233
Daughter 35(5.1) 9(3.5) 44
Neighbor 51(7.5) 8(3.1) 59
Alone 254(37.4) 224(86.6) 478
Own house Yes 61(8.9) 12(4.7) 73 5.565 0.05
No 628(91.1) 245(95.3) 873
Mobility
Yes 33(5.6) 29(11.2) 62 8.147 0.046
No 415(70.9) 215(83.3) 630
Sometimes 137(23.4) 14(5.4) 251
Faced Accident Yes 306(44.4) 44(17.1) 350 2.331 0.312
No 383(55.6) 214(17.1) 597
Food Access Low 177(25.7) 137(53.1) 314
Medium 343(49.8) 88(34.1) 431
High 169(24.5) 33(12.8) 202
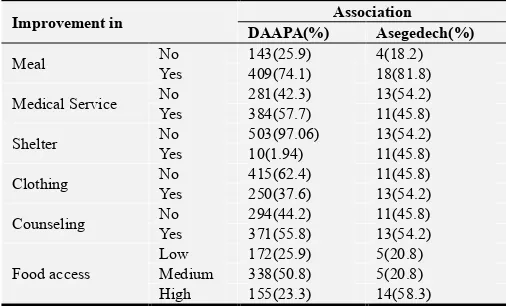
Different services offered by the two old people associations were investigated and shown in Table 3 from the Dawit Associations for Aged people part, it can be seen that 91.9%, 41.7%, 42.1%, 55.6% responded that they receive meal, medical service, clothing and counseling service respectively from the associations where as the most reported (71.6%, 58.3% and 57.9%) missing service were shelter, medical service and clothing respectively.
It can be seen from the Asegedech Association for aged people that 66.5%, 50%, 50% and 54.2% reported that they are getting medical service, clothing and shelter respectively. Additionally all of the respondents in this association reported that they get meal service.
The social capital of the respondents in DAAPA was higher than those in Asegedech. 239(36.3%) and 107 (16.2%) in DAAPA reported that they have higher and very higher interaction with other members of the association where as only 4.2% and 29.2% in Asegedech reported that they have higher and very higher social interaction with other members of their association.
Table 4. Services offered by Dawit Aid for Aged People Associations (DAAPA) and Asegedech Elderly Association.
Variables Association
DAAPA(%) Asegedech(%)
Meal No 33(8.1) 0(0)
Yes 373(91.9) 14(100)
Medical Service No 14(58.3) 231(33.5)
Yes 10(41.7) 458(66.5)
Shelter No 476(97.94) 12(50)
Yes 10(2.06) 12(50)
Clothing No 385(57.9) 12(50)
Yes 280(42.1) 12(50)
Counseling No 295(44.4) 11(45.8)
Yes 370(55.6) 13(54.2)
Interaction
Very lower 282(42.8) 10(41.7)
Lower 31(4.7) 6(25)
Higher 239(36.3) 1(4.2)
Very higher 107(16.2) 7(29.2)
clothing and counseling they receive were improved after they joined DAAPA. This shows that this association is doing best in providing meal and has much to do in providing clothing for these elderly. It can also be said that the medical and counseling service is not very much satisfactory as only about half of the respondents reported that it improved their life.
Additionally 81.8%, 45.8%, 45.8% 54.2 % and 54.2% reported that their meal, medical service they get, shelter, clothing and counseling they receive were improved after they joined Asegedech Association indicating that the association is offering comparatively good service in meal and clothing. It has to also be noted that more than half of the respondents reported the medical service they get didn’t improve after they joined the association.
The food access result suggested that in both of the associations the elderly life have improved after they became member of the association because 50.8%. 23.3% from DAAPA and 20.8%, 58.3% from Asegedech Association reported they are getting medium and high food access respectively.
Table 5. Improvements of old people needs after joining Dawit Aid for Aged People Associations (DAAPA) and Asegedech Elderly Association.
Improvement in Association
DAAPA(%) Asegedech(%)
Meal No 143(25.9) 4(18.2)
Yes 409(74.1) 18(81.8)
Medical Service No 281(42.3) 13(54.2)
Yes 384(57.7) 11(45.8)
Shelter No 503(97.06) 13(54.2)
Yes 10(1.94) 11(45.8)
Clothing No 415(62.4) 11(45.8)
Yes 250(37.6) 13(54.2)
Counseling No 294(44.2) 11(45.8)
Yes 371(55.8) 13(54.2)
Food access
Low 172(25.9) 5(20.8)
Medium 338(50.8) 5(20.8)
High 155(23.3) 14(58.3)
Logistic Regression Analysis
The ordinal logistic regression was fit after the bivariate regression analysis. Predictors which were statistically insignificant were discarded and not brought up to the final model where as the predictors in Table 5were all significant in the bivariate analysis. The goodness-of-fit statistics which uses Pearson and Deviance Chi square statistic were both not statistically significant showing that the null hypothesis that the model fits the data well is not rejected. This indicated that the fitted ordinal model is appropriate for the data.
The final model Table 5 in turn refined and resulted that Income, Occupational status, Owning a house and association member ship were significant variables that predicted food access of the old people. Controlling for other variables old people who don’t own house have 47% lower odds of having food access of medium or more compared to those who do have their own.
Aged people that are members of DAAPA have 61% lower odds than those who are in Asegedech Association in have a
medium or more access to food. Aged people that reported their occupation status as unemployed have 73% less odds of having a food access medium or more compared to the retired controlling for other predictors. The odds of medium or more food access for those who said they have constant source of income is 3.87 times than those reported as they don’t have constant source of income controlling for the rest of the predictors
Table 6. Estimates of Coefficient Ordinal Logistic Regression Model.
Predictor Estimate Std. Error Wald Sig.
Age .005 .007 .419 .518
Family Size -.046 .032 2.061 .151
Sex Male .209 .181 1.334 .248
Income Yes 1.354 .345 15.367 .000**
Educ. Stat Literate .004 .225 .000 .986
Occupation Employed -1.168 .848 1.898 .168
Occupation Unemployed -1.324 .567 5.453 .020*
Occupation Professional -1.091 .684 2.547 .110
Own House No -.640 .264 5.858 .016*
Association DAAPA -.918 .441 4.339 .037*
4. Conclusion and Recommendations
The main results from this study suggest that respondents that are member of the elderly association have no comparative advantage than those out of the organization in generating constant source of income and therefore membership into elderly associations has no significant contribution to improve income. Living status examination also showed that regardless of the membership most of the old people lead their life on their own. Older people within the association were found to be having a better food access than those not in the associations. Comparing their life before and after joining the organizations half of the members reported that the medical service, clothing and counseling they get were improved indicating positive contribution of the organization. Therefore it can be concluded that membership improved the food access of the elderly and the major determinants were source of income, occupational status, owning household and association membership. In addition owning a house, having constant source of income and membership in Asegedech result in better odds of food access.
The results of this study are found to be very encouraging to keep supporting old people and organizations engaged on them. This study further indicated that in addition to supporting the elderly, specific attention should be given to alleviate their food access shortage by taking the following into consideration.
Plan has to be devised to establish constant income source and housing problems of the elderly
Further regular follow up studies has to be conducted in order to address the problem from its grass root level
Acknowledgment
We are pleased to extend our gratitude to Dawit, head of Dawit Aid for Aged Persons Association and Asegedech for their support in the course of this work. They also understood our great concern for the quality of the data and made sure that the data were collected with high care day by day. We would also like to thank all the elderly that took part in this study with patience while being asked by our enumerators. We also take this opportunity to thank Dire Dawa University for financing this study.
References
[1] Glyn W. Humphreys, Mihaela D. Duta, Livia Montana, Nele Demeyere, Cathal McCrory, Julia Rohr, Kathleen Kahn, Stephen Tollman, Lisa Berkman (2016). Cognitive Function in Low-Income and Low-Literacy Settings: Validation of the Tablet-Based Oxford Cognitive Screen in the Health and Aging in Africa: A Longitudinal Study of and indepth Community in South Africa (HAALSI).
[2] Theresa E. Gildner, Melissa A. Liebert, Benjamin D. Capistrant, Catherine D’Este, J. Josh Snodgrass Paul Kowal (2016). Perceived Income Adequacy and Well-being Among Older Adults in Six Low- and Middle-Income Countries. [3] Cooper, J. K. and Kohlmann, T.(2001). Factors associated
with health status of older Americans’, Age and Ageing, Vol. 30: 495-501.
[4] Central Statistical Authority (2007).Summary and Statistical Report of the 2007 Population and Housing Census Results, Ethiopia.
[5] Hosmer, D.W. and Lemishow, S. (2000). Applied Logistic Regression, 2nd ed., John Wiley & Sons, New York, NY. [6] Agresti, A. (1990). Categorical Data Analysis. John Wiley &
Sons, New York, NY.
[7] Sarkar, S.K. and H. Midi (2010). Importance of assessing the model adequacy of binary logistic regression. Journal Applied Science. 10: 479-486.
[8] MLSA (2006) National Plan of Action on older persons (1998 - 2007) E.C.
[9] Dawit Aid for Aged People Association (2006). Free Health and Older People Technical Working Group. Dire Dawa. [10] Fahey and Murray (1994). Health and Autonomy Among the
Over 65s in Ireland. Dublin: National Council for the Elderly. [11] Minsitry of Finance and Economic Development (2010):
Annual Report.
[12] Gilleard, C. & Higgs, P. (2005). Contexts of Ageing: Class, Cohort and Community. Cambridge: Polity Press.
[13] Erikson, E. (1980). Identity and the Life Cycle: A Reissue. New York: Norton.
[14] Help Age International Ethiopia (2011). A study of older people’s livelihoods in Ethiopia.