Published online March 20,2014 (http://www.sciencepublishinggroup.com/j/ijmsa) doi: 10.11648/j.ijmsa.20140302.17
Phase transformations and thermodynamics of binary
systems Fe
2
О
3
- V
2
O
5
and Fe
2
О
3
- MnO at high
temperatures
Rossitza Paunova
*, Radost Alexandrova, Maksim Marinov
Department of Ferrous Metallurgy and Metal Foundry, University of Chemical Technology and Metallurgy, Sofia, Bulgaria
Email address:
[email protected] (R. Paunova), [email protected] (R. Paunova)
To cite this article:
Rossitza Paunova, Radost Alexandrova, Maksim Marinov. Phase Transformations and Thermodynamics of Binary Systems Fe2О3 - V2O5
and Fe2О3 - MnO at High Temperatures. International Journal of Materials Science and Applications. Vol. 3, No. 2, 2014, pp. 49-57.
doi: 10.11648/j.ijmsa.20140302.17
Abstract:
The phase transformations and thermodynamics of the binary systems of Fe2O3-MnO2 as well as Fe2O3-V2O5have been investigated. Pure oxides, waste vanadium catalyst (containing ∼4.12% V2O5) and manganese carbonate ore
concentrate containing ∼ 44.56% MnO have been used for preparation of the mixtures. The purpose of these investigations was to study phase transformations, some thermodynamic characteristics of waste products, containing Fe-Mn-V-Si-O and further producing real Fe-Mn-V alloys from this products. Two methods have been used to study these systems. Four mixtures were prepared for the investigation: mix 1 - pure oxides - V2O5, Fe2O3, SiO2; mix 2 - waste vanadium catalyst,
Fe2O3; mix 3 - pure oxides - MnO2, Fe2O3, SiO2; mix 4 - manganese concentrate, Fe2O3. Phase transformations have been
defined by DTA and X-ray analysis up to 1473K. The formation of new phases FeV2O4 and MnFe2O4 (Jacobsite) in the
samples can be formed up to this temperature only if in the initial materials there is waste vanadium catalyst and manganese concentrate. In the temperature range 853K – 953K solid solution between Fe2О3 and Мn2О3 is formed (for
pure oxides – mix3) and then it decomposes peritectically at 1203K. The oxygen potential, respectively Gibbs energy in the temperature range 1073К – 1173К has been calculated using EMF method with reference electrode Ni/NiO. Gibbs energy values for mix 1 and mix 2 are very close compared to the theoretical indications calculated for Fe2O3. Gibbs energy for
mix 3 is in compliance with the data of manganese oxide.
Keywords:
DTA Analysis, EMF Method, Gibbs Energy1. Introduction
The systems Fe-Mn-O and Fe-V-O have been discussed by a number of authors. They have studied the systems from different aspects.
Lina Kjellqvist and Malin Selleby[1] assessed the ternary system Fe-Mn-O. A part of the binary Mn–O system was reassessed. The thermochemistry of iron manganese oxide spinels was studied by Sophie Guillemet-Fritsch et al. [2]. Takashi Miyano and Nicolas J. Beukes [3] discussed quantitatively the phase relations in the system Mn-Fe-Si-O. The phase relations involve major oxide minerals of the ores, namely, braunite, braunite II, hausmannite, bixbyite, jacobsite, and hematite. They were constructed under quartz-deficient conditions, using existing and estimated thermodynamic data and mineral assemblages from the ores.
Phase equilibrium of the MnxFeyO system (Fe/Mn = 2)
was studied in the temperature range 1223 – 1393K and in the oxygen partial pressure interval from 101 to 105 Pa by measuring the electrical conductivity of the weight of the sample [4].
To define the Fe-Mn-O and Fe-V-O systems not only by Mössbauer spectroscopy and X-ray analyses [6, 7] were used but also they were analyzed thermogravimetrically [4, 5, 10].
Thermodynamics of these systems has been studied by a number of authors [8, 9, 12, 13, 14] Jacob, K. T. and Alcock, C. B. [12] calculated the measurements using solid oxide galvanic cells incorporating ZrO2-CaO and
ThO2-YO1.5 electrolytes by the help of electromotive force
The system Fe2O3-MnO-V2O5-SiO2 is included in the
chemical composition of the waste products of the chemical and metallurgical industry.
Vanadium catalyst is used for the sulfur acid production. It is deposited as a waste product after its deactivation and this product is charged again with a fresh catalyst. Annually between 500 and 1000 tons of vanadium catalyst are released from sulfur acid production and at the same time it contains significant quantity of deficit vanadium. The toxicity of the vanadium causes certain environmental problems which is an additional consideration to look for ways to utilize this valuable waste product. Vanadium catalyst utilization is too expensive and it is also inefficient. The ore-bed in the region of the village of Obrochishte (Varna area) contains large stocks of relatively poor manganese carbonate ore (Мn nearly 23 %). Despite the great number of experiments for its use, it was utilized as an addition to manganese agglomerate in the production of manganese alloys. Bulgarian manganese ore and waste vanadium catalyst cut down the production cost of Mn-V ferroalloy production (electro ore-smelting process) considerably.
In the present work, the phase changes in the systems Fe-V-O and Fe-Mn-O were studied at heating up to 1473K. Pure oxides of iron, manganese, vanadium and waste materials (waste vanadium catalyst and manganese concentrate) were used as initial materials. Some thermodynamic characteristics of those systems were determined. The main purpose is further obtention of real complex Fe-Mn-V alloys from these waste products.
2. Experimental
2.1. Materials and Apparatus
The nominal chemical composition (mass %) of the manganese concentrate is shown in Table 1. The nominal chemical composition (mass %) of waste vanadium catalyst is shown in Table2.
Table 1. Chemical composition of manganese concentrate, %.
MnO CO2 FeS2 Fe2O3 P2O5 SiO2 MgO CaO Al2O3
44,56 19,33 2,25 1,79 0,31 12,4 2,00 3,90 2,10
Table 2. Chemical composition of waste vanadium catalyst, %.
V2O5 Fe2O3 SiO2 K2O Na2O Al2O3 SO3
4,12 3,4 57,12 6,71 3,93 0,82 23,88
Pure Fe2O3, MnO, V2O5, SiO2 oxides were also used as
initial materials. Their quantities are in such correlations as those in manganese concentrate and waste vanadium catalyst.
Four mixtures were prepared for the experiments. Mix 1 – pure oxides (mass.,%) - V2O5 – 5.0 g; Fe2O3 –
25.0g ; SiO2 – 70.0g.
Mix 2 - waste vanadium catalyst 121.35 g and Fe2O3 - 21 g.
(21g Fe2O3 is different from the needed quantity of iron in
the mixture).
Mix 3 - pure oxides (mass.,%) MnO – 45.0g (55.15g MnO2); SiO2 13.0g; Fe2O3 – 42.0g.
Mix 4 – manganese concentrate 100g and Fe2O3 – 40.21g
(40.21g Fe2O3 is different from the needed quantity of iron
in the mixture).
The samples were prepared as tablets with φ = 8.0mm and P = 1.9atm for a thermodynamics study of the systems.
The mixtures were investigated by DTA method within the temperature range 293K-1473K using thermogravimetrical apparatus STA PT1600 with specifications: temperature range -150 – 1750oC; heating rate 0.1 to 100oC/min; measuring range - ±25.2500mg; accuracy - ±1% full scale.
The samples initial weight was as follows: mix 1 – 56.3 mg; mix 2 – 59.2 mg; mix 3 – 57.8 mg; mix 4 – 55.5 mg. The heating rate was 10оС/min. The obtained derivatograms were registered as well as the differential changes of temperature as the mass changes.
The mixtures were studied also by EMF method within the temperature range 293K-1173K. The basic arrangement of the experimental cell 2 was the same as in paper [15]. Ni/NiO was used as a reference electrode.
The following galvanic cells were used in this work Pt|Fe2O3-V2O5 and Fe2O3- WVC ||ZrO2(CaO)||Ni,NiO|Pt
P’O2 P’’O2
WVC- waste vanadium catalyst
Pt|Fe2O3-MnO2 and FMC ||ZrO2(CaO)|| Ni,NiO|Pt
P’O2 P’’O2
FMC- Fe2O3- Mn concentrate
The Delta G°(T) (Ni O) values were reported by a number of authors [16-18]. The values of delta G°T (Ni O)
have been cited in this paper
Ni + ½ O2 = NiO
Delta G(f)(o)( NiO ) = -233651 + 84,893 T, J / mol
2.2. DTA Results and Discussion
On Fig.1 a derivatogram of mixture 1 (pure oxides Fe2O3,
V2 O5 and SiO2) is shown. The analysis of DТА curves
shows the presence of intense endothermal effect at almost about 108o C (381K) and two rather weak intension endothermal effects at 672o C (945K) and 882o C(1155K). The first one corresponds to the sample mass losses in the table (with 13.33%) that is a result from dehydration processes (evaporation of dampness). The other two endothermal effects reflect most probably the polymorphous transition of SiO2 in α -cristobalite and
αFe2O3 in γFe2O3. The following one is not well defined;
the shallowed endothermal effect at temperature about 1155oC (1428K) relates to the sample melting. On the ТG curve in that temperature range the mass change is not marked or if it is, the values are too low. The supplementary X-ray analysis, on Fig. 2, shows that in the obtained product the phases of Hematite (Fe2O3) have been
and vanadium was not registered. This result demonstrates keeping of vanadium (V5+) oxidation degree and also the data of binary system V2O5-Fe2O3 that shows absence of
chemical compounds between them.
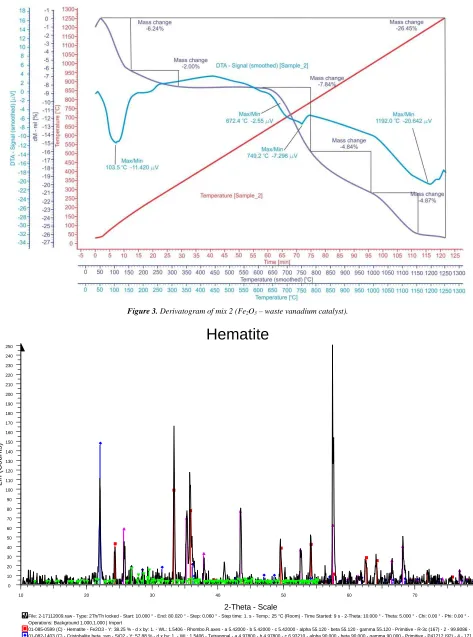
If the above results are compared to thermal changes and phase formation of mix 2 (with waste vanadium catalyst) on Fig.3 it is seen, that at low temperatures about 104oC (377K) and 202oC (475K) two endothermal effects are observed in accordance with mass loss – 6.24 % and 2.00%. Those two effects are results of the physical dampness separation as well of the residual waste sulfur in the vanadium catalyst. In the temperature range from 580oC (853K) up to 750oC (1023K) one exothermal effect is marked as a result of solid-phase interaction between the oxides and the formation of ferrovanadium FeV2O4 [19]. In
contrast to mixture 1, where vanadium is as V2O5,in the
mixture 2 (with waste vanadium catalyst) it is present in lower degree of oxidation which makes possible the formation of FeV2O4. These suppositions are confirmed by
the X-ray analysis data, shown on Fig. 4, where apart from Hexagonal Quartz, Tetragonal Cristobalit, Rhombo Hematite FeV2O4 is also found. In the temperature range
580 – 750oC the mass sample is decreased by 7.84%, which shows that the gas SO3 separation is possible because it is
about 24% in the initial chemical composition of the catalyst. Mix 2 melts at temperature about 1192оС (1465K).
On Fig.5 a derivatogram of mixture 3 (pure oxides the Fe2O3-MnO2-SiO2) is shown. On DТА curve two
endothermal effects and one exothermal are observed. The dampness separates at temperature about 77oC (350K). The exothermal peak begins at temperature about 380oC (653K) and the end is at temperature about 580oC (853K), and its maximum is at temperature about 480oC (753K). In that temperature range the formation of a solid solution between Fe2O3 and Mn2O3 takes place. A transformation from a
peritectic type that decompose at about 950oC (1223K) [20] to a solid solution between Mn2O3 + Mn3O4 is possible.
The temperature of the peritectic decompose is close to that on the experimental DTA curve (Т ~ 941оС) (Т ~ 1214K) where the endothermal effect appears. In that temperature range, the sample mass begins to increase (by 4,52%). The most possible reason for that is the dissociation of MnО2 by the scheme: MnO2→ Mn2O3→
Mn3O4→MnO because we add MnО2 to the mixture
instead of MnO. The X-ray analysis, shown on Fig. 6, confirms the above statement because orthorhombic Mn2O3, rhombic hematite Fe2O3, tetragonal
hausmannite (Mn3O4) are present in the outputs as well
as tetragonal α-cristobalit. At temperature about 1131оС
(1404K) sample melting can be seen.
On Fig.7 the derivatogram of mixture 4 (Fe2O3 and
Mn concentrate) is shown. On DТА curve, the same effects as in mix 3 are observed. The dampness evaporates at temperature about 88oC (361K) and an endothermal effect is registered. In the temperature range 380 – 480оС (653K – 753K) solid solutions are formed between iron and manganese oxides.
Endothermal effect appears at about 580оС (853K) as a result of CO2 separation that is contained in the
manganese concentrate, obtained from poor carbonate ore. That fact is confirmed by TG curve as well, where the sample mass is reduced by 15.9 %, in comparison with mix 3. In the temperature range from about 680оС
(953K) to about 940 оС (1213K) three endotharmal effects are observed with weak intensity respectively weak mass change. Those effects most probably are a result of Jacobsite MnFe2O4 formation [20, 7]. Sample
melting can be seen at about 1179оС (1352K). The X-ray analysis, on Fig.8, shows that in the output of mix 4 phases – tetragonal Hausmannite (Mn3O4), Rhombic
Hematite (Fe2O3) and cubic Jakobsite (MnFe2O4) are
present.
2.3. EMF Results and Discussion
The overall cell reaction could be written as the sum of the reactions occurring at the cathode and anode. The cathode reaction was
NiO + 4e- = Ni + 2O2 - (1)
The anode reaction was
Me3O4 + 2O2- = 3MeO + 4e- (2)
where Me3O4 is Fe3O4 (magnetite) or Mn3O4
(hausmannite); MeO is FeO (hematite), MnO or V2O3. The apparent partial pressure of the oxygen (generated by the concentrate) could be determined by the equation
E=2,3.RT/nF(log10(PO2’’)ref.-log10(P’O2)exp. (3)
where E is – the measuared EMF, [V]; R is – the gas constant, 8,314 [deg K-1mol-1]; n depicts the number of electrons taking part in the reaction; F – Faraday constant, 96500 [kJ C g.equivalent-1] ; log10(P’’O2)ref. –
oxygen pressure of the reference electrode; log10(P’O2)exp. – oxygen pressure of the system studied.
Using the Ni/NiO reference electrode the partial pressure of the oxygen in the mixtures was
log10(P’O2)exp.=-E.n.F/2,3.R.T–24406/T+8,867 (4)
The results obtained are listed in Table 3 and Table 4. The results of EMF were obtained as average values of a number of measurements in the course of more than 30 min for every temperature under investigation.
Figures 5 and 6 represent the temperature dependence of delta G (T) on the obtained experimental data. The compared graphs on Fig.9 show very close Gibbs energy values for mix 1 and 2. The X-ray analysis of mix 1 output shows the presence of Hematite (Fe2O3) whereas in mix 2 output apart from
Hematite (Fe2O3) there is also FeV2O4. So we can
Figure 1. Derivatogram of mix 1 (pure oxides Fe2O3, V2O5 and SiO2).
Figure 3. Derivatogram of mix 2 (Fe2O3 – waste vanadium catalyst).
Hematite
00-010-0173 (I) - Corundum, syn - Al2O3 - Y: 29.52 % - d x by: 1. - WL: 1.5406 - Rhombo.H.axes - a 4.75800 - b 4.75800 - c 12.99100 - alpha 90.000 - beta 90.000 - gamma 120.000 - Primitive - R-3c (167) - 6 - 25 01-074-0766 (C) - Iron Vanadium Oxide - Fe6.5V11.5O35 - Y: 5.49 % - d x by: 1. - WL: 1.5406 - Triclinic - a 10.20900 - b 9.38700 - c 6.56400 - alpha 100.520 - beta 94.350 - gamma 98.850 - Primitive - P-1 (2) - 1 - 01-082-1403 (C) - Cristobalite beta, syn - SiO2 - Y: 57.88 % - d x by: 1. - WL: 1.5406 - Tetragonal - a 4.97800 - b 4.97800 - c 6.93210 - alpha 90.000 - beta 90.000 - gamma 90.000 - Primitive - P41212 (92) - 4 - 171 01-085-0599 (C) - Hematite - Fe2O3 - Y: 38.25 % - d x by: 1. - WL: 1.5406 - Rhombo.R.axes - a 5.42000 - b 5.42000 - c 5.42000 - alpha 55.120 - beta 55.120 - gamma 55.120 - Primitive - R-3c (167) - 2 - 99.8086 - Operations: Background 1.000,1.000 | Import
File: 2-17112009.raw - Type: 2Th/Th locked - Start: 10.000 ° - End: 80.020 ° - Step: 0.060 ° - Step time: 1. s - Temp.: 25 °C (Room) - Time Started: 9 s - 2-Theta: 10.000 ° - Theta: 5.000 ° - Chi: 0.00 ° - Phi: 0.00 ° -
L
in
(
C
o
u
n
ts
)
0 10 20 30 40 50 60 70 80 90 100 110 120 130 140 150 160 170 180 190 200 210 220 230 240 250
2-Theta - Scale
10 20 30 40 50 60 70 80
Figure 5. Derivatogram of mix 3 (pure oxides Fe2O3, MnO2, SiO2)
Manganese Oxide
01-077-1316 (A) - Cristobalite low, syn - SiO2 - Y: 2.40 % - d x by: 1. - WL: 1.5406 - Tetragonal - a 4.97090 - b 4.97090 - c 6.92780 - alpha 90.000 - beta 90.000 - gamma 90.000 - Primitive - P41212 (92) - 4 - 171.1 01-080-0382 (C) - Hausmannite - Mn3O4 - Y: 17.39 % - d x by: 1. - WL: 1.5406 - Tetragonal - a 5.76500 - b 5.76500 - c 9.44200 - alpha 90.000 - beta 90.000 - gamma 90.000 - Body-centered - I41/amd (141) - 4 - 3 01-087-1166 (C) - Hematite - Fe2O3 - Y: 36.68 % - d x by: 1. - WL: 1.5406 - Rhombo.H.axes - a 5.03530 - b 5.03530 - c 13.74950 - alpha 90.000 - beta 90.000 - gamma 120.000 - Primitive - R-3c (167) - 6 - 301.904 01-073-1826 (C) - Manganese Oxide - Mn2O3 - Y: 68.69 % - d x by: 1. - WL: 1.5406 - Orthorhombic - a 9.41180 - b 9.41770 - c 9.42330 - alpha 90.000 - beta 90.000 - gamma 90.000 - Primitive - Pbca (61) - 16 - 83 Operations: Background 1.000,1.000 | Import
File: 3.raw Type: 2Th/Th locked Start: 10.000 ° End: 80.000 ° Step: 0.040 ° Step time: 1. s Temp.: 25 °C (Room) Time Started: 8 s 2Theta: 10.000 ° Theta: 5.000 ° Chi: 0.00 ° Phi: 0.00 ° X: 0.0 mm
-L
in
(
C
o
u
n
ts
)
0 100 200 300 400 500 600 700 800 900 1000 1100 1200 1300
2-Theta - Scale
10 20 30 40 50 60 70 80
Figure 7. Derivatogram of mix 4 (Fe2O3 - manganese concentrate).
Jacobsite syn, precipitated
01-085-0599 (C) - Hematite - Fe2O3 - Y: 6.58 % - d x by: 1. - WL: 1.5406 - Rhombo.R.axes - a 5.42000 - b 5.42000 - c 5.42000 - alpha 55.120 - beta 55.120 - gamma 55.120 - Primitive - R-3c (167) - 2 - 99.8086 - I/ 01-080-0382 (C) - Hausmannite - Mn3O4 - Y: 7.10 % - d x by: 1. - WL: 1.5406 - Tetragonal - a 5.76500 - b 5.76500 - c 9.44200 - alpha 90.000 - beta 90.000 - gamma 90.000 - Body-centered - I41/amd (141) - 4 - 31 01-088-1965 (C) - Jacobsite syn, precipitated - (Mn.6Fe.4)(Mn.4Fe1.6)O4 - Y: 96.76 % - d x by: 1. - WL: 1.5406 - Cubic - a 8.49700 - b 8.49700 - c 8.49700 - alpha 90.000 - beta 90.000 - gamma 90.000 - Face-cent Operations: Displacement 0.250 | Background 1.000,1.000 | Import
File: 4-17112009.raw - Type: 2Th/Th locked - Start: 9.869 ° - End: 79.919 ° - Step: 0.060 ° - Step time: 1. s - Temp.: 25 °C (Room) - Time Started: 9 s - 2-Theta: 9.869 ° - Theta: 5.000 ° - Chi: 0.00 ° - Phi: 0.00 ° - X:
L
in
(
C
o
u
n
ts
)
0 10 20 30 40 50 60 70 80 90 100 110 120 130 140 150 160 170 180 190 200 210 220 230 240 250 260 270 280 290 300 310 320
2-Theta - Scale
10 20 30 40 50 60 70
Table 3. Gibbs energy values depending on temperature for mix 1 and 2.
Mix 1 Ref. Electrode Ni/NiO Mix 2 Ref. Electrode Ni/NiO
T,K E, V
log
10(
)
exp.2
O
P
DeltaG(T), J/mol T, K E, V
log
10(
P
O2)
exp.Delta G(T), J/mol 1083 0,328 -12,9639 - 268345 1083 0,327 -12,9453 - 267959 1103 0,331 -12,7033 - 267805 1103 0,330 -12,6849 - 267419 1123 0,333 -12,4339 - 266880 1123 0,332 -12,4159 - 266494 1143 0,334 -12,1563 - 265569 1143 0,333 -12,1386 - 265183 1163 0,336 -11,9056 - 264643 1163 0,335 -11,8883 - 264258 1173 0,338 -11,8007 - 264567 1173 0,335 -11,7491 - 263409
Table 4. Gibbs energy values depending on temperature for mix 3 and 4.
Mix 3 Ref. Electrode Ni/NiO Mix 4 Ref. Electrode Ni/NiO
T, K E, V
log
10(
)
exp.2
O
P
DeltaG(T), J/mol T, K E, V
log
10(
P
O2)
exp.Delta G(T), J/mol
1073 0,342 -13,3896 - 274597 1073 0,329 - 13,1449 - 269579
1098 0,346 -13,0572 - 274019 1098 0,333 - 12,8181 - 269002
1133 0,348 -12,5523 - 271821 1133 0,337 - 12,3563 - 267575
1163 0,350 -12,1487 - 270047 1163 0,339 - 11,9577 - 265801
1173 0,350 -12,0073 - 269198 1173 0,340 - 11,8351 - 265339
Figure 9. Comparative graphs for temperature dependance of deltaG for
mix 1 and mix 2.
Figure 10. Comparative graphs for temperature dependence of delta G for
mix 3 and mix 4.
The compared graphs on Fig.10 show lower Gibbs energy values for mix 4 than for mix 3. The X-ray analysis of mix 3 output shows presence of Mn2O3, Fe2O3,Mn3O4.
So we can compare experimental data for Delta G with the
data for Mn2O3, Mn3O4 [9]. In the product of mix 4 there is
Mn3O4 Fe2O3 and Jakobsite (MnFe2O4). Probably its
formation is the cause for the lower value of Gibbs energy in mix 4.
3. Conclusion
As a result of the carried out experimental study the following more important conclusions can be drawn:
The phase transformations reaching up to 1473K and the formation of new phases of FeV2O4 and MnFe2O4
(Jacobsite) in the samples can be formed only if in the initial materials there is a waste vanadium catalyst and manganese concentrate.
A solid solution between Fe2О3 and Мn2О3 is formed
(for pure oxides – mix3) in the temperature range 853K – 953K and then it decomposes peritectically at 1203K.
Based on the experimental results of the heating of different mixtures containing oxides of iron, manganese and vanadium the relationship of Delta GoT = f(T) for the
temperature range 1073K – 1173К was obtained, using EMF method with a reference electrode Ni/NiO. Gibbs energy values for mix 1 and mix 2 are very close compared to the theoretical indications calculated for Fe2O3. Gibbs
energy for mix 3 is in compliance with the data of manganese oxide.
References
[1] Lina Kjellqvist and Malin Selleby, Thermodynamic
Assessment of the Fe-Mn-O System, Journal of Phase Equilibria and Diffusion, (2010), Volume 31, Number 2, pp113-134.
[2] Sophie Guillemet-Fritsch, Alexandra Navrotsky, Philippe
Tailhades, Hervé Coradin and Miaojun Wang,
[3] Takashi Miyano and Nicolas J. Beukes, Physicochemical environments for the formation of quartz-free manganese oxide ores from the early Proterozoic Hotazel Formation, Kalahari manganese field, South Africa, Economic Geology, 1 May 1987; vol. 82; No 3; pp 706-718.
[4] Toshihide Tsuji, Yamato Asakura, Toshiyuki Yamashita,
Keiji Naito, Phase equilibria of the MnFeO system
(Fe/Mn = 2), Journal of Solid State Chemistry, December 1983, Volume 50, Issue 3, Pages 273-280.
[5] P. Franke, R. Dieckmann, Thermodynamics of iron
manganese mixed oxides at high temperatures, Journal of Physics and Chemistry of Solids, Volume 51, Issue 1, 1990, 49-57.
[6] Bonsdorf G., Schafer K., Teske K., Langbein H., Ullmann H.,
Stability region and oxygen stoichiometry of manganese ferrite, Solid state Ionics, 1 July 1998, Volume 110, Number 1, pp. 73-82(10).
[7] M A B de Araujo, T V V Costa, M C A Lima, H A Maia and
V W Vieira, Thermal transformations of natural jacobsite
(Mn, Fe)3O4, Physica Scripta, 1989, Volume 40, Number 5,
682.
[8] A. D. Pelton, H. Schmalzried, J. Sticher, Thermodynamics
of Mn3O4 — Co3O4, Fe3O4 — Mn3O4, and Fe3O4 — Co3O4
Spinels by Phase Diagram Analysis, Article first published online: 21 JUN 2010, Berichte der Bunsengesellschaft für physikalische Chemie, Volume 83, Issue 3, pp 241-252.
[9] K.T.Jacob, A. Kumar and Y.Waseda, Gibbs Energy of MnO:
Measurement and Assessment, Journal of Phase equilibrium and Diffusion, Vol 29, Number 3, June, 2008, pp222 – 230.
[10] P.P. Stander and C. P. J. Van Vuuren, The high temperature
oxidation of FeV2O4, Thermochimica Acta, Volume 157,
Issue 2, 30 January 1990, Pages 347-355.
[11] Masataka Wakihara, Yoshio Shimizu* and Takashi Katsura,
Preparation and magnetic properties of the FeV2O4
-Fe3O4 system, Journal of Solid State Chemistry, Volume 3,
Issue 4, November 1971, Pages 478-483.
[12] Jacob, K. T. ; Alcock, C. B. , The oxygen potential of the
systems Fe+FeCr2O4+Cr2O3 and Fe+FeV2O4+V2O3 in the
temperature range 750-1600°C, (1975), Metallurgical and Materials Transactions B, 6 (2). pp. 215-221.
[13] Masataka Wakihara and Takashi Katsura, The Phase
Equilibria in the FeO-Fe2O3-V2O3 system at 1500K, Bulletin
of the Chemical Society of Japan, Vol.44, №11 (1971),
pp3043-3046.
[14] A Petric, K T Jacob, Thermodynamic Properties of Fe3O4
-FeV2O4 and Fe3O4-FeCr2O4 Spinel Solid Solutions, Journal
of the American Ceramic Society, Volume 65, Issue 2, February 1982, pages 117–123.
[15] R. Paunova – “Thermodynamics study of reduction of
titanium magnetite concentrate with solid carbon”, “Metallurgical and Materials Transaction” B, 33B, 4, 2002, p 633 –638.
[16] Z.Moser, K. Fitzner and W. Zakulski – Bulletin de
l’Academie Polonaise des Sciences, 1975, vol.XXIII, No3, 243-248.
[17] Eva Jacobsson and Erik Rosen – Scandinavian Journal of
Metallurgy,1981, 10, 39-43.
[18] O. Sjoden, S. Seetharaman and L.I. Staffansson –
Metallurgical Transaction, 1986, vol.17B, 179-184.
[19] M.I.Gassik, Liakishev N.P., Emlin V.I., Theory and
technology production ferroalloys, Moscow, Metallurgy, 1988, p. 428.
[20] Arnulf Muan and Shigeyuki Sōmiya, Am.J. Sci., 260 , 233
(1962).
[21] S.I. Filippov – “Theoria metallurgicheskih processov”,