http://www.sciencepublishinggroup.com/j/ijtet doi: 10.11648/j.ijtet.20180401.12
ISSN: 2575-1743 (Print); ISSN: 2575-1751 (Online)
Developing Forecasts and Trends for Post Concession
Performance of Onne Seaport: Framework for Performance
Improvement
Godfrey Chigozie Emeghara, Theophilus Chinonyerem Nwokedi, Chinyeaka Nwokodi Nwoloziri
Department of Maritime Management Technology, Federal University of Technology, Owerri, Nigeria
Email address:
To cite this article:
Godfrey Chigozie Emeghara, Theophilus Chinonyerem Nwokedi, Chinyeaka Nwokodi Nwoloziri. Developing Forecasts and Trends for Post Concession Performance of Onne Seaport: Framework for Performance Improvement. International Journal of Transportation Engineering and Technology. Vol. 4, No. 1, 2018, pp. 11-19. doi: 10.11648/j.ijtet.20180401.12
Received: January 24, 2018; Accepted: February 24, 2018; Published: March 28, 2018
Abstract:
This paper examines the post concession performance of Onne seaport Nigeria. It obtained time series data covering a period of ten years on the performance indicators of Cargo throughput, Berth Occupancy rate and ship traffic volume of Onne seaport from the Nigerian ports Authority. The Secondary Data were collected from the Nigerian Ports Authority statistical reports for the period 2006-2015 of each performance indicator as basis for measuring sustainability and improving seaport performance. The moving average method of forecasting and trend analysis was used to analyze the collected data. It was found that there exist inconsistency in the post concession performance trend of the port and that seaport performance over the years covered in the study has not been sustained to remain high. The study recommended the development of performance benchmarks for each performance indicator as targets which port authorities and terminal operators must seek to achieve and /or exceed.Keywords:
Forecasts, Trends, Post-Concession, Port, Performance1. Introduction
National ports are very crucial as they serve as the major gateway to the national economy [1]. Reference [2] infers that in today’s global commerce, seaports or maritime transport plays an important role of being many nations’ major gateway for international trade and are a good instrument for measuring the economic health of any nation. The Nigerian ports are very vital to national economic development and accounts for about 90% of imports and export commodities [3]. It is also believed that the Nigerian seaports as a hub and central port may account for about 70% of all seaborne trade in the West African sub-region [4]. Hence, the operational performance of the nation’s seaports would be of international reputation to meet the needed requirements and objectives as a hub port to satisfy the numerous port users.
The port is a receptive point for both import and export commodities and provides infrastructures for handling the necessary operations relevant to the movement of import and
model. Under this model, the port suffered from various challenges such as poor funding, political instability and vices, poor reform policies and managerial incompetence which resulted into poor performance of the Nigerian ports as it is reflected in low ship turnaround time, capital flight, high cost of port operation and demurrages due to delays in ship and cargo clearance [5]. However, in 2006, the federal government as seeking solutions to these challenges introduces port reform of 2006 which gave rise to port concessioning and privatization and subsequently changing the port administrative system from a service port model into a landlord port model. This implies that the introduction of 2006 port reform that brought about port concessioning and privatization has ceded the port infrastructures and operation of port facilities to the hands of private operators called the terminal operators or the concessionaires and NPA becomes their landlord.
Nigeria major ports concessioned include – Lagos ports (Apapa and Tin can Island), Port Harcourt port, Onne port, Warri port and Calabar port. Port concession simply means an arrangement whereby the government or its agency on contract agreement with a private merchant who has undertaken the responsibility of operating the port facilities and providing port services to the port users for a given period of time. It implies that the government will hand over the public infrastructure of the port system to the private operator who will manage and operate those facilities and provide services to the masses. Concession is also a process whereby the government gives the right to operate port facilities and/or deliver port services of public utility to private concessionaires, in agreement for the concessionaires to build and manage the subject of the
concession or to manage the delivery of service at the concessionaire’s own risk [6]. Reference [7] puts it in this way, a concession arrangement is one in which the government (or her agency) grants the right to fund, build, own, improve, upgrade, maintain or operate a public infrastructure for better performance and charge users for the cost of services provided. This is oftentimes referred to as Private Public Partnership (PPP). The concession of the ports is based on two contract terms: first is Build Operate and Transfer (BOT), whereby the private operator builds, operates and transfer the superstructures at the end of the concession contracts. Second is the LOT, which is lease, operate and transfer whereby the concessionaire need not to build but operates, maintains and transfer assets at the end of concession contract. This was basically for the warehouses, sheds and land areas.
Onne port is situated along Ogu creek and Bonny River. It is a part of Odido clan in the Eleme Local Government Area of Rivers State. It is an important port serving major purposes in the area. It has series of quays with facilities for cargo handling up to 60,000grt. Onne is also the main base for the offshore activity in the region, and a large number of supply vessels call at Onne every week. It provides store, fresh water, fuel bunkers and repair services for vessel /ships at the port. Onne port is divided into two major terminals; Federal Ocean Terminal (FOT) and Federal Lighter Terminal (FLT). Onne Port has been concessioned to three (3) Private Terminal Operators namely: Messrs Intel Nig. Ltd., Brawal Shipping Limited and West African Container Terminal. The concessionaires, terminals and berths concessioned are shown in the table below:
Table 1. Terminal Operators in Onne Seaport.
Terminal Operator (FLT) Terminal Berths Contact
Brawal Shipping Ltd A 1 Investment House, 3 Grace Ave., Elelenwo, PH - Rivers State Intel Nig. Limited B 2, 3 and 4 Km 16 Portharcourt –Aba Expressway, PH, Rivers State Terminal Operators (FOT) Terminal Berths Contact
Intel Nig. Limited A 1, 2, 3, 4,5,6, 9 ,10, 11 Enterprise House, Road South, FOT. Onne Oil & Gas Free Zone, Onne Rivers State WACT B 7 , 8 Federal Ocean Terminal Onne, Rivers State
Source: NPA bulletin.
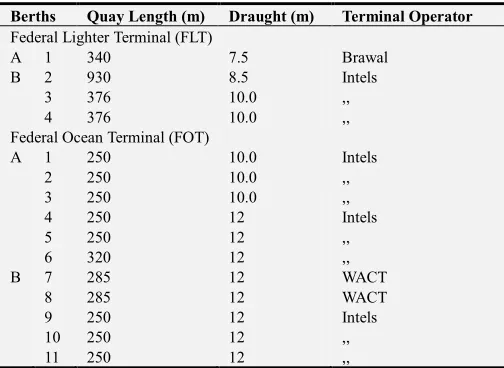
Table 2. Berth characteristics of Onne Port.
Berths Quay Length (m) Draught (m) Terminal Operator
Federal Lighter Terminal (FLT)
A 1 340 7.5 Brawal B 2 930 8.5 Intels
3 376 10.0 ,,
4 376 10.0 ,,
Federal Ocean Terminal (FOT)
A 1 250 10.0 Intels
2 250 10.0 ,,
3 250 10.0 ,,
4 250 12 Intels
5 250 12 ,,
6 320 12 ,,
B 7 285 12 WACT
8 285 12 WACT
9 250 12 Intels
10 250 12 ,,
11 250 12 ,,
Source: NPA bulletin.
some of these port challenges which led to long ship turnaround time, low berth occupancy rate, low cargo throughput etc and subsequently a total poor performance of the ports. The NPA therefore introduces a port reform policy of concession to bring in needed expertise in the area of operations which will improve port performance. Various researches have noted that concession has enhanced ports performance since commencement. It has drastically improved the cargo throughput, berth occupancy rate, ship turnaround time, labour productivity, port revenue generation and ship traffic over the years. So many studies have been carried out on the circumstances necessitating the Nigerian Ports concession and the initial outcomes [10] [11] has looked at effects of port reform on cargo throughput level at Onne seaport; a comparative study before and after reform policy implementation. [11] has in another work measured the efficiency level in Nigerian seaports after reform policy implementation of Onne and rivers seaports. Many others have examined if some of the basic objectives of port concession were achieved five years after concession in Nigerian ports [7]. Reference [12] also have examined the performance of Nigerian ports; pre and post concession era. However, no known study have evaluated the sustainability of seaport performance in concession implementation era of Nigerian ports, hence the need for this study.
1.1. Objectives of the Study
The objective of the study is to raise forecasts and trends for port performance parameters (indicators) such that the sustainability and improvement of seaport performance in post concession era can be ensure by comparing the subsequent performance levels with forecasts and ensuring that the trend of improvement in productivity witnessed in the post concession era is maintained. The study aims to use past levels of cargo throughput, ship turnaround time, berth occupancy rate, and ship traffic volume performances of the port to raise forecast and trends that may serve useful purposes in planning subsequent productivity performances of the Onne seaport terminal.
1.2. Literature Review
[11] Infers that Ports around the world play strategic roles in the development of domestic and international trade of any country whether it is a developing or developed country. Furthermore, that in a globalized world where distances are becoming squeezed, ports play an active role in sustaining the economic growth of any maritime country.
[13] added that in the modern world of a fast growing technology, ports are playing the role of an industry, not just passive actor in transportation but also in complete supply chain management and this is why it is said that “ports are more than piers” that is, more than just infrastructure or a complex infrastructure. It is essential that ports provide efficient, adequate and competitive services to the satisfaction of ship-owners and other port users including the concessionaires and host nations particularly in terms of
revenue generation [11]. If the ports fail, ship-owners who may see the ports too costly or too slow would likely not find it beneficial doing business in such an unproductive port. They will definitely go elsewhere to have their desired satisfaction. Hence if ports do not provide cost-effective services, imports will cost more for consumers and exports will not be competitive on world markets, national revenue will decline as well the standard of living of all people.
[1] argued that ports are not only functioning as a logistics chain in transportation for inter-change, but they function as a self-sustaining industry that is linked with domestic and international trade. At some places, ports also act as a foreign exchange earner not only in the form of transshipment or hub port but as part of supply chain management by providing other logistics services to the industry. That is why a port needs to be treated as an industry rather than just a pier. [1] further identifies that Nigeria has a total of eleven ports and eight oil terminals organized in three zones of Western, Central and Eastern zones. The central zone with its headquarters in Warri and the Eastern zone with its headquarters in Port Harcourt are predominantly oil terminals, although Warri, Sample, Koko, Port Harcourt, Calabar and the Federal ocean terminal Onne are important general cargo ports.
For the ports to perform better or more efficiently in this concession era, the management of the port should not only be concerned with the demand and supply of throughput but with institutional framework, application of technology, marketing strategy and ultimately economic impact of the development and implementation of projects or programmes [13]. This, will invariable yield good performance when the ports are of international reputation and standard.
The magnitude, scope and persistence of failure of Nigeria’s ports before the concession exercise were alarming. Ports administrators were continuously demanding for massive subsidies and yet the ports delivered only intermittent and substandard services. The returns on these large investments were generally poor, and in some cases negative, with an especially low rate of return relative to the large amount of resources invested in them [15]. Net outflows from the government to the ports were estimated at US$2 billion annually [14] [15]. All these pointed to the inefficiencies of the ports administration of pre-concession. The reasons for the poor performance of Nigerian Ports and other public enterprises from history tend to have a uniform pattern globally and range from the presence of conflicting and interwoven roles determined by politicians, prevalence of uncompleted contracts and subsidies from government [15]. These more or less aid internal inefficiencies, issues of excessive bureaucratic controls, to government interference and intervention, and other public service culture of undermining and compromising efficiency and optimum productivity [15].
may be considered analogous to public private partnerships (PPPs) and Private Finance Initiatives (PFIs) and or seen as an arm of privatization (if defined broadly). Privatization of public utility or enterprises has become a key component of the structural reform process around the world and a globalized strategy for the anticipated port performance for many economics in many parts of the world today. This has gained popularity in recent times but yet is an old innovation as it was first practiced by the French government in the water project of 1776 [16].
Section168 of the draft Ports and Harbour Authorities Bill defines a ‘concession’ as an arrangement between an Authority and a third party pursuant to which such third party shall be authorized to provide a port service or operate a port facility in accordance with the bill [16]. This implies that the concessionaires operating the facilities and providing service to the port users will do so at their own cost. It is believed that privatization of terminals through concession contracts would be a valuable option if port competition is effective, but not necessarily in cases where competition needs to be created by regulation [17].
The Federal Government of Nigeria embarked on the concession of Nigerian Ports essentially to solve the protracted problems of inefficiency, corruption, mismanagement, and huge debts that characterize the Nigerian ports [18]. Various authors have inferred that the rationale behind the Nigerian Port concession includes the $34 million indebtedness of the NPA, the redundancy of 24 out of 83 managers as well as its poor management structure [18] [19] [20] [21]. Furthermore, going by the supposed vision statement of the Nigerian ports, it wishes to be the leading hub Port in West and Central Africa, to deliver efficient port services in a safe, secure and customer-friendly environment. Its’ core value includes efficiency, customer satisfaction, safety and security innovation. However, business at the Nigerian seaports was bedeviled with difficulties summarized below by [12] which necessitated the port concession or reform programme:
(i).Turnaround time for ships was too long and usually calculated in weeks, sometimes months, depending on the cargo being loaded or discharged.
(ii). Cargo-handling plants and equipment owned by the NPA were few and mostly unserviceable, leading to shipping companies hiring these machines from private sector sources after having paid NPA.
(iii). Dwell time for goods in ports was prolonged due to poor port management, long table bureaucracy bottleneck and that led to port congestion.
(iv). Corruption soared high among the agents, labor contractors and various service providers at the port.
(v). Nigerian seaports were rated as one of the costliest seaports in the world, as a result of the compounded problems.
(vi).Many port premises and quay aprons had fallen to disuse and failed road sections inside the ports made movement of goods within port grounds cumbersome and very slow.
(vii).Following the seaport congestion, complaints of untraceable or missing cargoes were being regularly lodged against the NPA, all to no avail.
(viii) Security inside Nigerian seaports was compromised by the activities of miscreants as theft and pilferage became the order of the day.
The concept of efficiency is very vague and proves difficult to apply in a typical port organization extending across production, trading and service industries. Ports are complex and multi-parts organizations in which institutions and functions often intersect at various levels [21] [11]. There are many ways of measuring port efficiency although it could be reduced to three broad categories viz. – physical indicators, factor productivity indicators and economic and financial indicators [20]. Physical indicators are generally referred to time measures concerned with the port operations such as ship turnaround time, ship waiting time at port, berth occupancy rate, ship waiting time at berth, cargo throughput, and cargo dwell time or how long it takes for unloaded cargo to leave the port. Factor productivity indicators examine maritime labour efficiency of the port operation; it measures both labour and capital required to load or unload goods from a ship. Lastly, economic and financial indicators are usually related ports revenue generation, for example, operating surplus or total income and expenditure related to gross registered tonnes (GRT) or net registered tones (NRT) or charge per twenty foot equivalent (TEUs). The evaluation of port performance is needful to assess the economic and social impacts of a seaport on its respective hinterland.
1.2.1. Objectives of Nigerian Ports Concession
The basic objectives of Port reform or concession exercise was to increase efficiency in port operation and performance, decrease cost of port services to stakeholders, decrease cost to the government for the support of port sector and attract private sector participation so as to free public resources for private services [2]. Following the recommendations of the project monitoring committee (CPCS, World Bank & Royal Haskoning), the Landlord port model was chosen. The landlord port model in essence entails the NPA being responsible for port planning and regulatory tasks as related to safety, security and environment and maintains ownership of port infrastructures [10]. Under this arrangement, the private sector would be responsible for marine and terminal operations, construction, cargo handling operations, dock labour management, purchase and ownership of superstructure and equipment, also manage commercial risks associated with their concession operations, and maintain direct contacts with shippers, who would pay the operators directly without interference from the port authority, finance and implement investments and maintenance for superstructure and equipment; pay suitable compensation to the Port Authority for concessioning the land and the operations [11] [10].
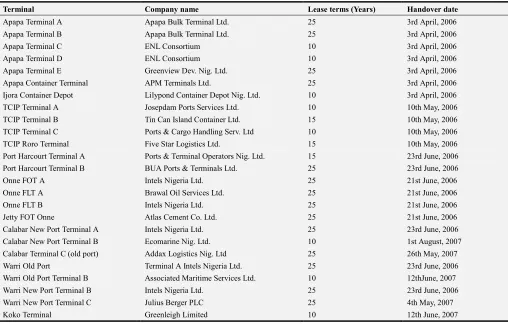
Table 3. Post Concession Terminals in Onne Seaport and their Lease Terms.
Terminal Company name Lease terms (Years) Handover date
Apapa Terminal A Apapa Bulk Terminal Ltd. 25 3rd April, 2006 Apapa Terminal B Apapa Bulk Terminal Ltd. 25 3rd April, 2006
Apapa Terminal C ENL Consortium 10 3rd April, 2006
Apapa Terminal D ENL Consortium 10 3rd April, 2006
Apapa Terminal E Greenview Dev. Nig. Ltd. 25 3rd April, 2006 Apapa Container Terminal APM Terminals Ltd. 25 3rd April, 2006 Ijora Container Depot Lilypond Container Depot Nig. Ltd. 10 3rd April, 2006 TCIP Terminal A Josepdam Ports Services Ltd. 10 10th May, 2006 TCIP Terminal B Tin Can Island Container Ltd. 15 10th May, 2006 TCIP Terminal C Ports & Cargo Handling Serv. Ltd 10 10th May, 2006 TCIP Roro Terminal Five Star Logistics Ltd. 15 10th May, 2006 Port Harcourt Terminal A Ports & Terminal Operators Nig. Ltd. 15 23rd June, 2006 Port Harcourt Terminal B BUA Ports & Terminals Ltd. 25 23rd June, 2006
Onne FOT A Intels Nigeria Ltd. 25 21st June, 2006
Onne FLT A Brawal Oil Services Ltd. 25 21st June, 2006
Onne FLT B Intels Nigeria Ltd. 25 21st June, 2006
Jetty FOT Onne Atlas Cement Co. Ltd. 25 21st June, 2006 Calabar New Port Terminal A Intels Nigeria Ltd. 25 23rd June, 2006 Calabar New Port Terminal B Ecomarine Nig. Ltd. 10 1st August, 2007 Calabar Terminal C (old port) Addax Logistics Nig. Ltd 25 26th May, 2007 Warri Old Port Terminal A Intels Nigeria Ltd. 25 23rd June, 2006 Warri Old Port Terminal B Associated Maritime Services Ltd. 10 12thJune, 2007 Warri New Port Terminal B Intels Nigeria Ltd. 25 23rd June, 2006 Warri New Port Terminal C Julius Berger PLC 25 4th May, 2007
Koko Terminal Greenleigh Limited 10 12th June, 2007
Source: Nigerian Ports Authority Brand Manual (2005).
1.2.2. Performance of Nigerian Ports in Concession Era
The activities and operation of the Nigerian Ports were commercialized in 1992 under the name, “Nigerian Ports Plc”. However, considering the fact that the government still wholly owns the ports, the name was reverted in October 1996 back to its original name, “Nigerian Ports Authority”. This reversion however, did not in any way affect the commercialization policy as a reform model to improve ports services. This was one of the earlier attempts to vitalize the port system before the recent port reform of the present concession and privatizations of the port facilities and operations.
The concession reform of the Nigerian ports has really improved the ports performance in productivity and efficiency. References [1] [11] observed that the efficiency improved at the ports after the reforms of 2006, as cargo dwell time and turnaround time of vessels reduced to an average of 2.45days as compared to an average of 6.85days and 10.43days before the reforms. He equally found out that infrastructural modernization and equipment enhancement reduced delays of cargo discharge at the ports thus increasing efficiency of the ports.
References [12] [11] opined that port concession is very viable in a national economy because of its significance as a global tool for port development and unquantifiable gains to
the economy, eliminating poor quality services and delays at the ports. He concluded that private operators would be more reasonable in their dealings to avoid government revocation of their license and unnecessary public reaction; freeing up of government funds for other priority developmental projects; attracts and uses foreign investment and technology and also port concessioning will expose the private sector concern for a more efficient service than government (NPA) in port service delivery.
Previous studies observes that port performance of pre- and post-concession of Nigerian ports revealed a fluctuation in cargo movement from 1956 to 2005 while the cargo throughput continues to increase unabated from 2006 to 2012 [9] [14]. The researchers added that concession of the port must have been responsible for this upward movement in cargo trend. There was a remarkable increase in inward and outward cargo movement during the post concession era in comparison to the pre concession era.
ports of Onne and Rivers. The reform also led to more private investment in the ports’ existing and new facilities and the introduction of a World Class service in port operation. The researcher concludes that the Ports of Onne and Rivers are performing better under the reform programme of the Federal Government of Nigeria. The researcher finally recommends that urgent need for a regulator to appraise the performance of the reform programme from time to time as provided by the agreement and for the full adoption and utilization of management information system (MIS) to aid performance efficiency.
Reference [10] in the study of the effect of port reform on cargo throughput level at Onne seaport observed that Onne ports have drastically improved on the quantity and quality of cargo handling equipment since after the concession reforms. [30] further noted that low productivity of an average Nigeria dockworker as well as the private terminal operators owing to lack of training and retraining of the abundant unskilled dockworkers has been reduced since after the reforms of the ports as they were evident in the ports prior to the port concessioning.
Reference [11] on his findings suggests that there is a significant relationship between vessel turnaround time, cargo throughput, ship traffic and also revenue generation of Port Harcourt and Onne ports. This was a report of his study on port performance of the Nigerian ports; a case study of Onne and Port Harcourt ports. The study further accounts for better performance of the ports particularly in ship turnaround time, cargo throughput, ship traffic and revenue generation in port concession era.
2. Methodology
Data collected were from two main sources; primary and secondary data. The primary data collected were from field survey, interview and questionnaires. The data collected from the primary source were not used for analyses. The
researcher only used primary data as yard stick to compare the data from secondary sources. The secondary data were collected from textbooks, journals, publications, media, NPA monthly and annual report bulletin, Onne annual report on port statistics, dissertation, Internet etc. The researcher only used the secondary data for analyses. Parameters such as Ship traffic volume, Cargo throughput, Ship turnaround time, percentage berth occupancy rate were used as variables for the evaluation.
The aim of the study is to evaluate the sustainability of seaport performance of the concession era of Nigerian ports; a case study of Onne of ports for a period of ten years 2006-2015. The researcher on this study chooses to use a Simple Moving Average (SMA) as a statistical tool to analyze the data collected on this study. A Simple Moving Average (SMA) is formed by computing the two year moving average for each of the port performance indicators over a period of ten years 2006-2015. Moving average is an average that moves as old data is dropped, new data comes available. This causes the average to move along the time series.
The implication is that it will enable the researcher to ascertain the average port performance of each indicator for the period from 2006-2015 and to ensure if there is sustainability in performance of the port for over the periods stated on this research.
Given the average port performance as
, − 1, … … . . , − ( − 1)
= + − 1 + ⋯ , ( − 1)
= 1 −
= + – −
!ℎ = #, = $ $% & '$ (
3. Data Presentation and Result
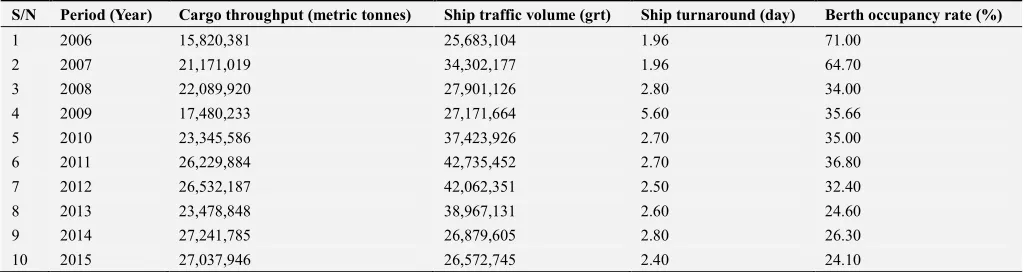
Table 4. Onne port operational statistics from 2006-2015.
S/N Period (Year) Cargo throughput (metric tonnes) Ship traffic volume (grt) Ship turnaround (day) Berth occupancy rate (%)
1 2006 15,820,381 25,683,104 1.96 71.00
2 2007 21,171,019 34,302,177 1.96 64.70
3 2008 22,089,920 27,901,126 2.80 34.00
4 2009 17,480,233 27,171,664 5.60 35.66
5 2010 23,345,586 37,423,926 2.70 35.00
6 2011 26,229,884 42,735,452 2.70 36.80
7 2012 26,532,187 42,062,351 2.50 32.40
8 2013 23,478,848 38,967,131 2.60 24.60
9 2014 27,241,785 26,879,605 2.80 26.30
10 2015 27,037,946 26,572,745 2.40 24.10
4. Discussion of Results
Table 5. Forecasts of Post Concession Cargo Throughput Performance Using Simple Moving Average.
S/N Period (Year) Cargo throughput (metric tonnes) 2 Year moving average
1 2006 15,820,381
2 2007 21,171,019 18,495,700
3 2008 22,089,920 21,630,470
4 2009 17,480,233 19,785,077
5 2010 23,345,586 20,247,057
6 2011 26,229,884 20,412,910
7 2012 26,532,187 21,630,470
8 2013 23,478,848 19,785,077
9 2014 27,241,785 20,247,057
10 2015 27,037,946 20,412,910
Source: Author’s calculation.
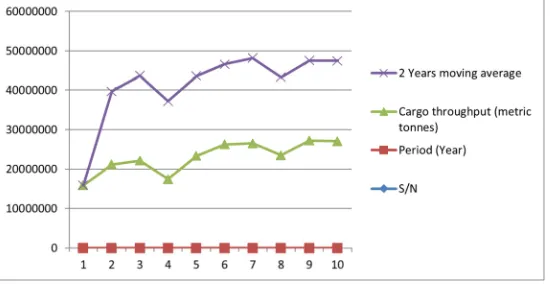
Table1 shows the moving average for cargo throughput in two-year intervals for the period 2006-2015. The moving average of cargo throughput performance of the port is not steady rather it is fluctuating showing that there is no sustainability in the trend of performance. Thus inconsistency in cargo throughput performance might mire the objectives of
the port reform exercise as performance might relapse into poor performance trend of the pre concession era. There is therefor need to develop benchmark tonnage which the seaport authority must employ as guide in order that cargo throughput performance of the seaport doesn’t relapse into the pre concession era poor performance.
Figure 1. Trend line moving average for cargo throughput 2006-2015.
The trend line shows a series of rising and falling (inconsistency) in the performance forecasts for cargo throughput. This further supports the need for determining performance target benchmark for sustainable improvement in cargo throughput of Onne port.
Table 6. Forecasts of post concession ship traffic volume (GRT) Performance using simple moving average.
S/N Period (Year) Ship traffic
volume (grt)
2 Year moving average
1 2006 25,683,104
2 2007 34,302,177 29,992,641 3 2008 27,901,126 31,101,652 4 2009 27,171,664 27,536,395 5 2010 37,423,926 32,297,795 6 2011 42,735,452 40,079,689 7 2012 42,062,351 42,398,902 8 2013 38,967,131 40,514,741 9 2014 26,879,605 32,923,368 10 2015 26,572,745 26,726,175
Source: Author’s calculation.
The table indicates an inconstancy in the ship traffic volume performance of the seaport. With some subsequent
year performances declining and being less than some preceding year performances, an indication that performance sustainability may not be assured at the long run. This equally calls for need for a target/benchmark ship traffic volume performance which the port must strive to always meet without allowing performance to decline below the benchmark into the poor pre concession performance trend.
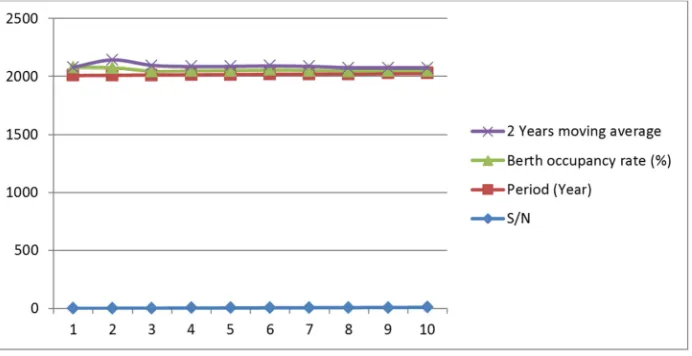
Table 7. Forecasts of Post Concession of berth occupancy Performance using moving average.
S/N Period (Year) Berth occupancy
rate (%)
2 Year moving average
1 2006 71
2 2007 64.7 67.85
3 2008 34 49.35
4 2009 35.66 34.83
5 2010 35 35.33
6 2011 36.8 35.9
7 2012 32.4 34.6
8 2013 24.6 28.5
9 2014 26.3 25.45
10 2015 24.1 25.2
We can deduce from the table 4 that there is no sustainability in berth occupancy rate at Onne port. Looking at the table, in 2007 the port recorded high rate of 65.87% on average which shows drastic reduction from 2008 and continuously reduced to 25% on average in 2015. Thus berth
occupancy performance of the seaport has failed to be sustained to maintain the high performance level of 2007. Performance models need therefore be determined and target benchmark be determined for berth occupancy rate of Onne seaport.
Figure 2. Trend line moving average for berth occupancy rate.
The trend line also suggests diminishing and low berth occupancy rate/performance of the port. Hence, there is no sustainable improvement in berth occupancy rate of Onne port.
5. Conclusion and Recommendation
The forecasts and trends depict inconsistencies in cargo throughput, ship traffic volume, and berth occupancy performances of Onne seaport. This implies that the present trend performance of the seaport has not been sustained remain optimally high as declining and performances has been witnessed as evidenced in the result of the analysis, suggesting once more inconsistency and fluctuation in performance. The study also recommend as follows:
Performance benchmarks should be determined for cargo throughput, ship traffic volume and berth occupancy performances of the seaport based on previous performance levels to serve as targets which Port Authorities and Terminal operators must strive to achieve and exceed.
Quantitative Performance models must developed for each performance indicator fo proactively determining how performances can be influenced positively to exceed and/or level performance benchmarks.
Subsequent performances of the must must be guided by use of quantitative models developed for such to ensure that performances does not decline below benchmarks or relapse into the poor performance trend of the pre concession era.
References
[1] Chioma Yingigba Jaja (2011): “Freight traffic at Nigerian seaports; problem and Prospect”. Medwell Journals. Vol. 6 (1), 250-258, 2012. Retrieved online:
http://www.medwelljournals.com/fulltext/?doi=sscience. 2011.250.258.
[2] Ogunsiji, A. S. & Ogunsiji, O. O. (2010). Consummate precision of strategic management approach on transport logistics and physical distribution for port performance efficiency: A case study of Nigerian Ports. Journal of Emerging Trends in Economics and Management Sciences, 1 (2), 96-101.
[3] Ogunsiji, A. S. & Ogunsiji, O. O. (2011). Comparative ports efficiency measurement in developing nations: A matching framework analysis (MFA) approach. European Journal of Social Sciences, 18 (4), 625-631.
[4] Nwoloziri, C. (2007): Effects of Port Concession on Labour Force of Nigerian Ports Authority. An Unpublished Project presented to the Department of Maritime Management Technology, F. U. T Owerri.
[5] Ndikom, O. B, (2006): The Essentials of Port Reforms: The Nigerian Experience. Lagos: Bunmico Publishers.
[6] Tsvetkov A. (2010): Strategy for the development of the transport infrastructure of the Republic of Bulgaria through Concession mechanisms. Bulgarian Minister of Transport, Information, Technology and Communication. Retrieved from: http://www.traceca-org.org/fileadmin/fm- Presentation_Concessions_0310_en.pdf.
[7] Oghojafor B. E. A, Kuye O. L and Alaneme G. C (2012): Concession as a Strategic Tool for Ports Efficiency: An Assessment of the Nigerian Ports. American Journal of Business and Management Vol. 1, No. 4, 2012, 214-222.
[8] Leighland, J and Palsson, G. (2007): Washington, DC: Public Private Infrastructure Advisory Facility.
[9] De Monie, G, (1994): Mission and Role of Port authorities; Processing of the world port privatization conference, London.
[11] Okeudo G. N (2013): Effect of Port Reform on Cargo Throughput Level at Onne Seaport Nigeria. A Comparative Study Before and After Reform Policy Implementation. Journal of Business and Management (IOSR-JBM) e-ISSN: 2278-487X, p-ISSN: 2319-7668. Volume 12, Issue 1 (Jul. - Aug. 2013), PP 71-78. Retrieved from www.iosrjournals.org.
[12] Victor O, Ikechukwu A., Obioma R, Callistus C., and David A. (2015): Infrastructure Financing and Management: The Impact of Concession on the Operations and Performance of Nigerian Seaports. Journal of Behavioural Economics, Finance, Entrepreneurship, Accounting and Transport, 2015, Vol. 3, No. 2, 65-70. Available online at http://pubs.sciepub.com/jbe/3/2/1.
[13] Prakash, G. (2005): Port Planning as a Strategic Tool: A Typology; Institute of Transport and Maritime Management Antwerp.
[14] De Monie, G. (1987): Measuring and Evaluating Port Performance and Productivity,-UNTAD Monograph on port management no. 6 and The International Association of Ports and Harbour (IAPH).
[15] De Langen, P. W, Nijdam, M. H. and Van der Horst, M. (2006): New Indicators to Measure Port Performance, proceedings of the IAME conference, July 12-14, Melorne, Australia.
[16] Filani, O. (2008): Maritime Productivity Today. Journal of Transport Studies. Vol 3 (1).
[17] The Nigerian Voice (2011): Five years after ports concessioning, stakeholders raise fresh concerns. Retrieved from: http://www.thenigerianvoice.com/nvnews/51349/1/fiveyears- after-ports-concessioning- stakeholders-.html.
[18] Ehbenine, O. A, (2009): Impact of Port Privatization and Concessioning and the future of Nigerian ports.
[19] Okeudo, G. N. (2013): Measurement of Efficiency Level in Nigerian Seaport after Reform Policy Implementation. Case Study of Onne and Rivers Seaport, Nigeria. Journal of Business and Management (IOSR-JBM) e-ISSN: 2278-487X, p-ISSN: 2319-7668. Volume 12, Issue 5 (Jul. - Aug. 2013), PP 46-55. Retrieved from www.iosrjournals.org.
[20] Trujillo, L. & Nombella, G. (1999): Privatization and regulation of the seaport industry. Policy Research Working Paper 2181. Washington D. C. The World Bank.