ORIGINAL ARTICLE
THE EFFECT OF INDUCED VISUAL STRESS ON
THREE DIMENSIONAL PERCEPTION
Faudziah Abd-Manan
Department of Optometry, Faculty of Allied Health Sciences Universiti Kebangsaan Malaysia
Jalan Raja Muda Abd Aziz 50300 Kuala Lumpur
Previous studies have shown that stress on the vergence and accommodation systems, either artificially induced or naturally occurring, results in small misalignment of the visual axes, reduces binocular visual acuity and produces symptoms of ocular discomfort. This study examines the effect of artificially induced visual stress using ophthalmic prisms on three dimensional perception on 30 optometry students ages ranging from 19 to 29 years old. 6D base-in prisms, equally divided between the eyes (3D base-in each) was used to induce stress on the visual system producing misalignment of visual axes known as fixation disparity. The fixation disparity is quantified using near vision Mallett Unit and an enlarged scaled diagram. Stereoscopic perception was measured with the TNO test, with and without the presence of stress and the results was compared. Wilcoxon’s matched pair ranked tests show statistically significant difference in the stereo thresholds of both conditions, p = 0.01 for advancing stereopsis and p = 0.01 for receding stereopsis, respectively. The study concludes that visual stress induced by prisms, produce misalignment of the visual axes and thus reduces three dimensional performance.
Key words : visual stress, prism induced, stereopsis, stereoacuity
Introduction
Visual stress refers to stress on the vergence and accommodation systems that results in visual
measurement is performed during dissociated condition and “fixation disparity” (or associated heterophoria) when the misalignment is observed during associated viewing (9).
The TNO test
The TNO test (15) uses random-dots stereograms of anaglyphs pairs printed in red and green. Projected stereoscopic perception is experienced when the stereograms are viewed through the red and green spectacles. The test provides a series of test plates ranging from Plate I to IV for screening purposes and Plate V to VII to measure stereopsis at retinal disparity levels of 480, 240, 120, 60, 30 and 15 sec arc when viewed at 40 cm viewing distance.
The test object in the TNO test is a flat circular surface with 60 degree sector apparently missing, which appears to either advance or recede from the plane of the background. When the plate is presented right side up, the circle with a missing sector appears to advance from its surround towards the viewer and when the test plate is presented upside down, it appears to recede from its background. A subject is required to tell whether the missing sector is at the top, bottom, left, or right side of the circle. Figure 1 shows a picture of the TNO test booklet with the red and green spectacles. Figure 2 is the graphic diagrams of the hidden test objects for the Plates V to VII presented right side up and Figure 3 when the test plates is presented upside down.
Materials and Methods
Subjects for this study were optometry students ages ranging from 19 to 29 years old. The
following procedures were performed on every subject to make sure they fullfill the required criteria for the study :
1. External examination and ocular history to make sure they have good ocular health. 2. Accurate refraction that gives best Snellen
visual acuity of 6/6 or better in each eye. 3. Cover test at a distance and near, that only
exhibit small degree of heterophoria to orthophoria.
4. Pass the stereotest on the Plate I of the TNO.
A pilot study was carried out to examine the threshold difference between the advancing view and the receeding appearance of the TNO test object on the subjects. This is to establish the stereoscopic status of the subjects.
A TNO test and a Mallett Unit for near vision were used to measure stereoacuity and the presence of stress on binocular vision, respectively. A frame measuring 8” x 4” was used to hold the TNO plate which was placed on top of the Mallett Unit (Figure 4). A specially constructed bifiltered spectacles (Figure 5) was used for the measurent of stereoacuity and the presence of fixation disparity due to the stress. The top half of the right eyepiece was fitted with the red filter and green filter on the left top half. The bottom halves of both eyepieces were fitted with crossed polaroid filters. Subjects wore the bifiltered spectacles on top of their best refractive
Figure 2: The graphic diagram of the hidden test object for the test Plates V to VII presented right side up. The numbers showed on each plates represent the levels of image disparities second of arc.
corrections throughout the test.
The pilot study was carried out with threshold stereopsis using the test plates presented rightside up and upside down. The objective of this experiment was to measure the threshold stereopsis when the test plates were presented rightside up and when the test plates were presented upside down. With the former, the test object appeared to advance from its surround while with the latter, the test object appeared to recede from its background plane, respectively.
Subjects’ stereoacuity were measured in two sessions, sessions A dan B. During session A the threshold stereopsis with the test plates first presented rightside up, followed later with the upside down position was meaured. For Session B, which was performed a day later, the order of presentation of the test plates was reversed. An allowance of 10 seconds was given to the subject to identify the positions of the hidden test objects during the test. Upon presentation of new stereoplates, subject’s left eye was covered for 10 second whilst the right eye fixated on the central letter X of the OXO on the Mallett Unit. The monocular occlusion was aimed to temporarily interrupt binocular vision, this having been reported as being adequate in minimising the transient stereoscopic learning effect from random-dots stereograms (23). The procedure was carried out for all the stereo-test plates both presented rightside up and upside down.
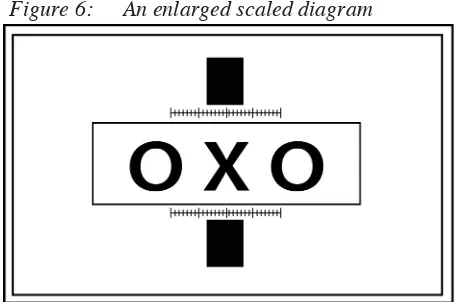
The main study was carried out on stress vergence and accommodation systems which was induced using 6D base equally divided between the two eyes (3D base-in each). The prisms were placed in a pair of Halberg clip-on trial frames, over the bifiltered spectacles. Subjects were asked to view the nonius lines on the face of the Mallett Unit for 10 seconds through the poloroid section of the
bifiltered spectacles. Misalignment of the visual axes on the Mallett Unit was measured using an enlarged scaled diagram in minutes of arc (23). The diagram is showed in Figure 6. Subjects were later asked to look through the red and green filter and view the TNO test plates for 10 seconds. Subject’s left eye was covered for 10 second during which a new test plate was introduced whilst the right eye fixated on the central X of the OXO on the Mallett Unit. The monocular occlusion was aimed to temporarily interrupt binocular vision to minimise the learning effect on stereo perception (22) and was thought adequate in minimising the transient effect of prism adaptation (24). This procedure was carried out for all the stereo-test plates both presented rightside up and upside down. The presence of visual axes misalignment was again verified. The mean pre and post fixation disparity measurements were taken as the value of visual axes misalignment present during the stereopsis assessment.
Results
Pilot study
A test for normality of the data is not ‘normally’ distributed due to truncated scale on the TNO test (15). Table 1 shows the medians and modes to summarise the central tendency of the data which is non parametric. The means and the standard deviations (SDs) of the findings are also included, as in the other tables, for reference purposes. The large SDs of the data are not indications for intersubjects variations of the stereothresholds but more of the effects from the truncated scales of the measurement.
Wilcoxon’s signed ranked tests (Z) show no significant difference between stereoacuity measured with the test objects appeared as advancing and receeding. For Session A, where advancing stereoacuity was measured first before receeding stereoacuity, show Z = -0.14, p = 0.89, µ = 0.01, which is not significant (NS) and Session B, where receeding stereoacuity was measured first and advancing stereoacuity second, shows Z = -1.41, p = 0.16, µ = 0.01 also NS.
The differences between two occasions of stereoacuity measurement are also statistically not significant, suggesting no learning effects on the TNO test. Advancing stereoacuity measured 1st and 2nd times show Z = -1.04, p = 0.30, µ = 0.01, (NS) and receeding stereoacuity measured 1st and 2nd times shows Z = -0.45, p = 0.66, µ = 0.01, (NS). The main study
The central tendencies of the results showing the medians, modes, means and SDs are summarised in Table 2 below. Table 3 shows the medians, modes, means and SDs of the overall threshold stereopsis, measured without and with the presence of visual stress.
In the absence of stress, the threshold for advancing stereopsis showed medians and modes of 30 (30) sec arc and 30 (60) sec arc for threshold receeding stereopsis, whilst in the presence of induced visual stress, the means and modes for advancing and receeding stereoacuities reduced to 60 (120) sec arc and 60 (60) sec arc, respectively. As for the means and SDs, the threshold advancing stereopsis are 48.50 (SD±41.63) sec arc and 53.50 (SD±43.09) sec arc for threshold receeding stereopsis without stress, and 89.00 (SD±70.24) sec arc for advancing and 94.00 (SD±65.32) sec arc for receeding stereopses with the presence of visual stress, respectively.
The stress due to the prisms was shown to
cause eso-fixation disparity in most cases (87%). The mean of the ocular deviation is 2.46 (SD ±1.48) min arc eso-fixation disparity. Paradoxical fixation disparity (25) was not observed.
As for the medians and modes of the overall threshold stereopsis (Table 3), the value without stress is 30 (30) sec arc; whilst with the presence of induced visual stress the threshold values increased 60 (60) sec arc, respectively. The means and SDs are 51.00 (SD±41.00) sec arc without stress and increase to 91.50 (SD±60.30) sec arc with induced visual stress, respectively.
Stereo thresholds obtained from advancing and receeding stereopses with and without prisms were also compared. In all cases, the results showed no significant difference between the two presentations of the TNO test, which confirmed and were consistent with the findings in the Part 1 of this study.
The Wilcoxon’s matched pair test (Z) results between stereoacuity without and with stress in advancing stereopsis show Z = -3.46, p = 0.01, µ = 0.01 and Z = -3.45, p = 0.01, µ = 0.01 for receeding stereopsis. Result comparing the overall advancing and receeding stereoacuity shows Z = -3.56, p = 0.01, µ= 0.01. The findings indicated stereoacuity measured without and with the presence of visual stress is statistically significant in all cases.
Discussion
WITH 6D BASE-IN WITHOUT PRISM Fixation Disparity (min.arc) -0 0 TNO Advancing (sec.arc) 30 30 48.50 ±41.63 TNO Receeding (sec.arc) 30 60 53.50 ±43.09 Fixation Disparity (min.arc) -2.46 ±1.48 TNO Advancing (sec.arc) 60 120 89.00 ±70.24 TNO Receeding (sec.arc) 60 60 94.00 ±65.32 Median Mode Mean SD
Table 2: Medians and modes for the threshold for advancing and receeding stereopses measured with the presence of prism induced stress as shown by the presence of fixation disparity from the 30 subjects. The means and SDs of the data are also included.
Table 1: Medians and modes for stereoacuity with the test object appeared advancing and receeding
SESSION A SESSION B (1st) Advancing (sec.arc) 30 30 79.00 ±115.42 (2nd) Receeding (sec.arc) 30 30 80.00 ±114.89 (1st) Receeding (sec.arc) 45 30 82.00 ±114.22 (2nd) Advancing (sec.arc) 30 30 76.00 ±114.44 Median Mode Mean SD
WITHOUT
WITH
to be the case.
Theoretically, crossed stereopsis occurs when fixation is in front of the position of an object of interest whilst for uncrossed stereopsis, it occurs when convergence is beyond or further away behind the viewing target. During the TNO test, it is not possible to determine precisely the convergence position. It is doubtful also if the state of convergence does have any effect on the appearence of the TNO test object since the advancing and receeding appearance of the three dimensional effects of the test object are the result from inward the outward shift of the superimposed half images printed on the test plates.
The study also shows that there is no significant difference between the threshold stereoacuity measured on the first or the second occasion of viewing which suggests no learning effect has occured. The absence of monocular cues in TNO test has been thought to be the contributing factor which prevents the effect of learning in projection stereopsis with random-dot stereograms. Julesz, the founder of random-dot stereograms argued that stereoscopic learning could occur by monitoring the vengeance performance using a preceeding stimulus for fixation embedded within the random-dots (26). This was rejected by Frisby and Clatworthy (27). They repeated Julesz’s experiment for which they also included non-cyclopean contours outlining the stereo-figure and a fixation point to assist fixation, and found that none of these conditions improved stereoacuity nor the perception time during a subsequent learning phase. The results of the study has shown, fixation disparity induced by prisms significantly increases threshold stereopsis. This supports the work of Cole and Boisvert (28) and disputes the report of Ogle et al., (29) who claimed that fixation disparity should have no effect on stereoacuity since fusion is not required for perception of depth. It seems that, although stereopsis can occur in the absence of fusion (29-31) and without the presence of accurate
the stereo-test distance by varying the disparity between dichoptic stimuli by presenting the two eyes with two separate images in a stereoscope, hence creating error in the vergence precision. He found that stereoacuity degraded rapidly with increasing disparity.
The degradation in stereoacuity with increasing disparity is thought to correspond with the increasing size of binocular receptive fields distal from the central Panum’s area. Rustein (35) reported that fixation disparity results in a shift in the horopter from its original position. Surrounding the horopter is a zone of singleness associated with Panum’s fusional area. If fixation disparity shifts the horopter slightly proximal or distal to the fixation point, there should also be a shift in the zone of singleness which corresponds to the region of stereoscopic vision within the Panum’s area. Rustein believed that only a shift in the spatial region of the horopter will occur, which alters the stereo-perception, not a change in the size of the area or the sensitivity of the Panum’s area. This suggests that the effect of induced fixation disparity on stereoacuity is only transient. Cole and Boisvert (27) indicated that the reduction in stereoscopic perception during artificially created fixation disparity would be apparent only if viewing time is restricted. Clearly, if unlimited viewing time is allowed, the vergence adaptive mechanisms might gradually decrease the existence of the induced fixation disparity hence diminishing its effect on stereopsis.
as a small boost in the activity of any units able to successfully inhibit each other, but if the inhibition is severe, it lowers the response of the cortical units concerned with disparity detection.
The findings of this study conclude that prism-induced stress on the visual systems lowers stereoscopic threshold. The TNO test for stereopsis can be used to detect the effect. This suggests that a TNO test can be used to detect the presence of stress on the vergence and accommodation system. A follow-up study in future set up clinically would provide useful data.
Acknowledgement
The author would like to thank Associate Professor Khalid Abdullah for his help with the statistical analysis of the data.
Correspondence :
Dr. Faudziah Abd-Manan,
Department of Optometry, Faculty of Allied Health, Sciences, Universiti Kebangsaan Malaysia,
Jalan Raja Muda Abd Aziz, 50300 Kuala Lumpur, Malaysia.
References
1. Sheedy, J.E. Fixation disparity analysis of oculomotor imbalance. Am. J. Optom. Physiol. Opt. 1980;57 :632-39.
2. Pardhan, S. and Gilchrist, J. The effect of monocular defocus on binocular contras sensitivity. Ophthal. Physiol. Opt. 1990;11:33-6.
3. Pickwell, L.D., Jenkins, T.C.A. and Yekta, A.A. The effect of fixation disparity and associated ‘phoria of reading at an abnormally close distance. Ophthal. Physiol. Opt. 1987;7:345-47.
fixation disparity in oculomotor problems Am. J. Physiol. Opt. 1977;54:474-78.
9. Yekta, A.A. and Pickwell, L.D. The relationship between heterophoria and fixation disparity. Clin. Exp. Optom. 1986;69:228-31.
10. Jenkins, T.C.A., Pickwell, L.D. and Abd-Manan, F. Effect of induced fixation disparity on binocular visual acuity. Ophthal. Physiol. Opt. 1992;12:229-301.
11. Jenkins, T.C.A., Abd-Manan, F., Pardhan, S. and Murgartroyd, R.N. Effect of fixation disparity on distance binocular visual acuity. 1994;14:129-31.
12. Jenkins, T.C.A., Abd-Manan, F. and Pardhan, S. Fixation disparity and near visual acuity. Ophthal.Physiol. Opt. 1994;15:53-58.
13. Mallett, R.F.J. A new fixation disparity test and its application. Optician. 1983;186: 11-15.
14. Mallett, R. Techniques of investigation of binocular vision anomalies: In: Edwards, K., Llewellyn, R. eds Optometry. Butterworth, London. 1988:270-84. 15. Walraven, J. Amblyopia screening with random-dot
stereograms. Am. J. Ophthal. 1975;80:893-900.
16. Larson, W.L. Effect of TNO red-green glasses on local stereoacuity. Am.J. Optom. Physiol. Opt. 1988;65 :157-61.
17. Reading, R.W. Binocular vision : foundation and applications. Butterworth, London. 1983.
18. Larson, W.L. An investigation of the difference in stereoacuity between crossed and uncrossed disparities using Frisby and TNO tests. Optom. Vis. Sci. 1990;67:157-61.
19. Regan, D. and Spekreijse, H. Electrophysiological correlate of binocular depth perception in man. Nature. 1970;225:92-4.
20. Woo, G.C.S. and Silanpaa, V.S. absolute stereoscopic thresholds as measured by crossed and uncrossed disparity. Am. J. Optom. Physiol. Opt. 1979;56 :350-55.
27. Frisby, J. and Clatworthy, J.L. Learning to see complex random-dot stereograms. Perception. ;4:137-78. 28. Cole, R. G. and Boisvert, R.P. Effect of fixation
disparity on stereoacuity. Am. J. Optom. ;51:206-13, 1974
29. Ogle, K.N., Marten, T.G. and Dyer, J.A. Oculomotor imbalance in binocular vision and fixation disparity. Henry-Kimpton, London. 1967.
30. Tyler, C.W. Sensory processing of binocular disparity. In: Schor, C.M. and Ciuffreda, K.J. eds. Vergence eye movements: basic and clinical aspects. Butterworth-London. 1983;199-295.
31. Siderov, J. and Harwerth, R.S. Precision of stereoscopic depth perception from double images. Vis. Res. 1993;33:1553-560.
32. Steinman, R.M. and Collewijn, H. Binocular retinal image motion during active head rotation. Vis. Res. 1980;20:415-29.
33. Erklens, C. J. and Collewijn, H. Eye movements and stereopsis during diplopic viewing of moving random-dot stereograms. Vis. Res. 1985; 25:1689-700. 34. Blakemore, C. The range and scope of binocular
discrimination in man. J. Physiol. (1970);211:599-622.
35. Rustein, R.P. Fixation disparity and stereopsis. Am. J. Optom. Physiol. Opt. 1977;54:550-55.