1
Evaluation of a Dual Isolation Width Acquisition (DIWA) method for
isobaric labelling ratio decompression
Theodoros I. Roumeliotis1,3,*, Hendrik Weisser2,3, Jyoti S. Choudhary1,3,* 1The Institute of Cancer Research, Chester Beatty Laboratories, London SW3 6JB, UK
2STORM Therapeutics Limited, Moneta Building, Babraham Research Campus, Cambridge CB22 3AT, UK 3
Wellcome Sanger Institute, Wellcome Genome Campus, Cambridge CB10 1SA, UK
*
correspondence:
T.I.R.: [email protected]
J.S.C.: [email protected]
Abbreviations:
CID, Collision-Induced Dissociation
DIWA, Dual Isolation Width Acquisition
HCD, Higher-energy Collisional Dissociation
HILIC, Hydrophilic Interaction Chromatography
iTRAQ, Isobaric Tags for Relative and Absolute Quantification
IW, Isolation Width
KO, Knockout
PSM, Peptide Spectrum Matches
RP, Reversed Phase
2
ABSRACT
Isobaric labelling is a highly precise approach for protein quantification. However, due to the
isolation interference problem, isobaric tagging suffers from ratio underestimation at the MS2
level. The use of narrow isolation widths is a rational approach to alleviate the interference
problem; however, this approach compromises proteome coverage. We reasoned that
although a very narrow isolation window will result in loss of peptide fragment ions, the
reporter ion signals will be retained for a significant portion of the spectra. Based on this
assumption we have designed a Dual Isolation Width Acquisition (DIWA) method, in which
each precursor is first fragmented with HCD using a standard isolation width for peptide
identification and preliminary quantification, followed by a second MS2 HCD scan using a
much narrower isolation width for the acquisition of quantitative spectra with reduced
interference. We leverage the quantification obtained by the “narrow” scans to build linear
regression models and apply these to decompress the fold-changes measured at the
“standard” scans. We evaluate the DIWA approach using a nested two species/gene knockout
TMT-6plex experimental design and discuss the perspectives of this approach.
Keywords: proteomics, isobaric labelling, TMT, iTRAQ, interference, ratio compression, isolation width, Orbitrap
INTRODUCTION
Stable isotope labelling of peptides using isobaric reagents such as iTRAQ and TMT enables
the multiplexed analysis of proteomes with deep quantitative coverage1-2. This barcoding strategy has provided comprehensive proteomic portraits of large collections of human cancer
3
high precision11 but imperfect accuracy due to ratio underestimation caused by co-fragmentation of ions with mass-to-charge ratios within the isolation window of the targeted
precursors12. Although this problem rarely affects the direction of protein abundance change, many applications can significantly benefit from increased accuracy; examples include the
determination of protein localization13, identification of specific protein-protein interactions in pull down assays14-15, and verification of protein deletions in gene out or knock-down experiments or in samples with natural genomic variation16. Several groups have proposed solutions to alleviate the interference problem and thereby improve isobaric
labelling quantification accuracy. Ow et al. demonstrated that the ratio compression can be
decreased using high-resolution HILIC fractionation which achieves maximum orthogonality
and reduces MS sampling complexity17. An alternative approach by Savitski et al. improves accuracy by fragmentation of the peptides close to their maximum chromatographic peak
height18. Elimination of ratio distortion in a two-proteome model utilizing MS3 for further fragmentation of b- or y- ions specific to the targeted precursor was reported by Ting et al.19. McAlister et al. have further enhanced the sensitivity of the MS3 method using isolation
waveforms with multiple frequency notches20. The latter is currently the method of choice for counteracting interference in isobaric labelling experiments using tribrid mass spectrometry.
The QuantMode method developed by Wenger et al. is based on gas-phase purification, by
manipulation of either mass or charge through expedient proton-transfer ion-ion reactions and
has also been shown to improve quantitative accuracy21. Using data analysis methods, Wuhr et al. showed that precursor-specific quantitative information can be retrieved at the MS2
level from the complement reporter ion cluster22. Notably, Shliaha et al. evaluated the utility of ion mobility for additional precursor purification in data-dependent acquisition mode and
presented evidence for improved accuracy, especially in combination with narrowed
4
quantification can be obtained at the MS2 level with the combination of extensive peptide
fractionation, narrow precursor isolation and y1 ion-based interference detection24.
Prompted by empirical observations of isobaric-labelled peptide MS2 spectra, we argue that
although a very narrow isolation window will result in severe loss of backbone fragment ions,
rendering the spectra unsuitable for peptide identification, the reporter ion signals will remain
intense enough to generate quantitative information for a significant portion of the spectra.
Based on this assumption we have designed a Dual Isolation Width Acquisition (DIWA)
method, in which each precursor is first fragmented with HCD using a standard isolation
width for peptide identification and preliminary quantification, followed by a concomitant
MS2 HCD fragmentation using a much narrower isolation width for the acquisition of
quantification-only spectra with reduced interference. We leverage the quantitative values
obtained by the “narrow” scans to build linear regression models and apply these to
decompress the fold-changes measured at the “standard” scans. Here, we evaluate the DIWA
method using a nested two species/gene knockout TMT-6plex model and discuss the
potential of this approach.
METHODS
Experimental design overview
To alleviate the interference problem at the MS2 level we have designed an acquisition
method on an LTQ-Orbitrap Velos in which each precursor is fragmented twice back-to-back
with HCD using a different isolation width at each scan event (1st MS2 scan 2.0 Th / 2nd MS2 scan 0.1 or 0.2 or 0.3 Th) (Figure 1A). Slightly different collision energies are used in each of the two HCD spectra to mark their isolation width of origin. The aim of the method is to
collect MS2 spectra devoid of interference in the isobaric tags which can be used to model
5
width. To evaluate this approach we have performed a TMT-6plex experiment using the
mixed-proteome model19 in combination with the use of a CRISPR-cas9 gene knockout (KO). We analysed a mixture of Escherichia coli tryptic peptides at ratios 2:1, 4:1, 8:1 (×2
each) and tryptic peptides from three human cell lines (hiPSC ARID1A KO, hiPSC WT and
CL-40) at ratios 1:1:1 (Figure 1B). Three TMT channels (129,130,131) were overlapping between E. coli and Human peptides whilst three channels (126,127,128) were used for
interference-free E. coli peptides.
6
To simulate lower-abundant changing proteins, we spiked the E. coli peptides at 2.5 to
20-fold lower total amount per channel compared to the human peptides. This represents a
scenario of high interference; in a real experiment it is more likely that the differentially
regulated proteins will cover the entire protein abundance dynamic range rather than the
mid-to-low abundant portion only. The labelled peptides were fractionated with high-pH
reversed-phase HPLC and the 25 fractions were analyzed on an LTQ Orbitrap Velos. The analysis of
the fractions was performed three times at three different “narrow” isolation widths (0.1, 0.2
and 0.3 Th). Finally, linear regression models were generated by plotting the “standard”
against the “narrow” isolation peptide logarithmic ratios for each sample comparison. All
primary peptide log2ratios were calibrated through these models. We chose to model the
compression effect by Deming regression, which is more appropriate when both the
dependent and independent variables are measured with error, thus facilitating the
comparison of two assays designed to measure the same analyte.
Sample preparation and LC-MS analysis
The hiPSC CRISPR-cas9 and the CL-40 cell pellets were obtained as described previously5. The cell pellets were homogenized in 150 μL 0.1 M triethylammonium bicarbonate (TEAB),
1% sodium deoxycholate (SDC), 10% isopropanol with probe sonication for 3×5 sec with
pulses of 1 sec at 40% amplitude (EpiShear) followed by boiling at 90 °C for 5 min. Samples
were re-sonicated and centrifuged at 10,000 rpm for 10 min. Lyophilized Escherichia coli
whole protein extract (Bio-Rad) was dissolved in 200 μL 0.1 M TEAB, 0.1% SDS divided
into aliquots of 10 μL each and diluted up to 100 μL. The protein content of each aliquot was
precipitated by the addition of 30 μL TCA 8 M for 30 min at 4 °C. The protein pellets were
washed twice with ice-cold acetone and finally re-suspended in 40 μL 0.1 M TEAB, 0.1%
7
concentration was measured with the Coomassie Plus Bradford Protein Assay (Pierce)
according to manufacturer’s instructions. Duplicate aliquots of 20 μg (TMT: 126 and 131),
10 μg (TMT: 127 and 130), and 2.5 μg (TMT: 128 and 129) of E. coli protein and aliquots of
50 μg of hiPSC ARID1A KO (TMT: 129), hiPSC WT (TMT: 130) and CL-40 (TMT: 131)
were prepared for trypsin digestion. Cysteines were reduced with 5 mM tris-2-carboxyethyl
phosphine (TCEP) for 1 h at 60 °C and blocked by 10 mM iodoacetamide (IAA) for 30 min
at room temperature in dark. Trypsin (Pierce, MS grade) solution was added at a final
concentration of 70 ng/μL to each sample for overnight digestion. The peptide samples were
finally labelled with the TMT-6plex reagents (Thermo Scientific) according to
manufacturer’s instructions. The TMT peptide mixture was acidified with 1% formic acid
and the precipitated SDC was removed by centrifugation. Offline peptide fractionation was
based on high pH Reverse Phase (RP) chromatography using the Waters XBridge C18
column (2.1 x 150 mm, 3.5 μm) on a Dionex Ultimate 3000 HPLC system at a 0.85%
gradient with flow rate 0.2 mL/min. Mobile phase A was 0.1% ammonium hydroxide and
mobile phase B was 100% acetonitrile, 0.1% ammonium hydroxide.
LC-MS analysis was performed on the Dionex Ultimate 3000 UHPLC system coupled with
the LTQ Orbitrap Velos mass spectrometer (Thermo Scientific). Samples were analysed with
the Acclaim PepMap RSLC C18 capillary column (75 μm × 50 cm, 2 μm, 100 Å). Mobile
phase A was 0.1% formic acid and mobile phase B was 80% acetonitrile, 0.1% formic acid.
The gradient separation method was as follows: for 85 min gradient up to 38% B, for 10 min
up to 95% B, for 10 min isocratic at 95% B, re-equilibration to 5% B in 5 min, for 10 min
isocratic at 5% B. For the DIWA method, the five most abundant multiply charged precursors
within 380-1500 m/z were selected with FT mass resolution of 30,000 and isolated for HCD
fragmentation twice with isolation width 2.0 and 0.1 or 0.2 or 0.3 Th in an Nth order double
8
energy was set at 40 for the standard scans and at 41 for the narrow scans. Tandem mass
spectra were acquired at 7,500 FT resolution with 40 seconds dynamic exclusion and 10 ppm
mass tolerance. FT maximum ion time for full MS experiments was set at 200 ms and FT
MSn maximum ion time was set at 50 ms. The AGC target vales were 3×10e6 for full FTMS
and 5×10e5 for MSn FTMS. For optimum ion transmission efficiency, we performed an
S-lens cleaning prior to the analysis. Additionally, we evaluated the effect of the narrow
isolation widths on the total ion current at the HCD-MS2 level (CE=40, max IT=100) of the
m/z 1,422 precursor peak of the ESI positive calibration mix. We noted an 1.7, 2.3, 2.7 and 6
-fold signal decrease as the isolation width was decreased from 2.0 to 1.0, 0.5, 0.3 and 0.1 Th
respectively in a linear fashion (R2=0.98).
Data processing
The MS2 spectra collected with collision energy 40 (“standard” scans) were searched against
Uniprot human (reviewed only) and Escherichia coli entries using SequestHT in Proteome
Discoverer 2.2. The precursor mass tolerance was set at 30 ppm and the fragment ion mass
tolerance was set at 0.02 Da. Static modifications were: TMT6plex at N-termini/K, and
carbamidomethyl at C. Dynamic modifications included oxidation of M and deamidation of
N/Q. The data were processed twice, first with maximum collision energy 40 for
quantification using the “standard” scans and second with minimum collision energy 41 for
quantification using the “narrow” scans (Reporter Ions Quantifier node). Quantification was
based on un-normalized signal-to-noise (S/N) values. Peptide confidence was estimated with
the Percolator node. Peptide FDR was set at 0.01 and validation was based on q-value and
decoy database search. Deming regression was performed in RStudio with the “deming”
package. A matrix containing the log2ratios: 131/129, 131/130 and 130/129 for the standard
9
provided in supporting information. The mass spectrometry proteomics data have been
deposited to the ProteomeXchange Consortium via the PRIDE25 partner repository with the dataset identifier PXD010571.
RESULTS
To evaluate the depth of proteome coverage and the accuracy level that can be achieved by
the dual isolation width acquisition method, we performed a proof-of-concept
TMT6plex-based analysis of varying amounts of spike-in E. coli protein extract into human protein
lysates of equal total amounts representing different cell types. For straightforward
implementation of the method, we used an LTQ-Orbitrap Velos platform in which the
method editor already allows the setup of dual acquisitions (e.g. CID-HCD). The application
of the DIWA method in the two-proteome model resulted in the quantification of 6,724 total
human and E. coli unique protein groups at isolation width (IW) 2.0. This level of proteome
coverage is in line with previous studies using similar instrumentation9. A subset of 6,132 (91%) proteins were also fully quantified at the narrowest isolation width 0.1, confirming that
the isobaric tags remain at quantifiable levels for the majority of the peptides despite the
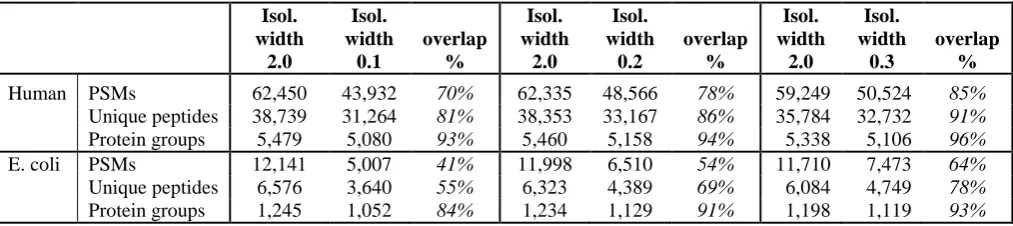
significant loss of the peptide fragment ion signals (Table S1). As expected, the percentages of quantified PSMs, peptides and protein groups increased as the narrow scan windows were
opened to 0.2 and 0.3 (Table 1, Tables S2 and S3). The overall lower quantification coverage of E. coli peptides and proteins is due to their lower abundances compared to
human proteins and due to the 8-fold lower sample load in two of the TMT channels. These
low-intensity TMT channels were more frequently below the quantification limit compared to
the human samples, resulting in smaller number of fully quantified E. coli PSMs. Notably,
10
possibly due to the fact that the monoisotopic peak of doubly charged peptides is the most
intense within their isotopic cluster yielding more efficient isolation. However, multiply
charged peptides appeared to have overall lower precursor intensities (Figure S1C) suggesting that isolation efficiency depends on both the isotopic cluster pattern and precursor
intensity. Overall, at isolation width 0.1, we observed a median 10-fold reduction in the mean
S/N for the human peptides with 87% of these retaining a signal-to-noise ratio greater than 5.
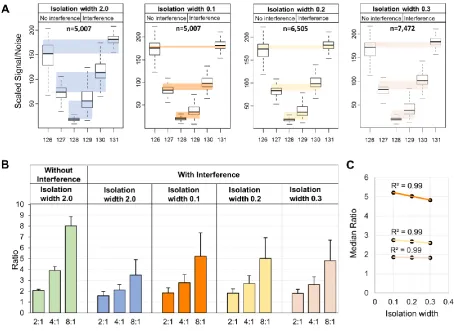
Next, we evaluated the correction efficiency of the DIWA method using the E. coli PSMs
fully quantified in the different isolation widths. Significantly less TMT signal distortion was
found using the narrow isolation widths as shown by the difference between the medians of
the expected (without interference) and measured (with interference) scaled quantitative
values between the replicate channels (Figure 2A). Although the compression effect was not eliminated, the narrow isolations yielded significantly improved ratios (Figure 2B).
Table 1. Number and comparative percentages of PSMs, unique peptides and protein groups quantified at each isolation width for human and E.coli samples.
Isol. width 2.0 Isol. width 0.1 overlap % Isol. width 2.0 Isol. width 0.2 overlap % Isol. width 2.0 Isol. width 0.3 overlap %
Human PSMs 62,450 43,932 70% 62,335 48,566 78% 59,249 50,524 85% Unique peptides 38,739 31,264 81% 38,353 33,167 86% 35,784 32,732 91% Protein groups 5,479 5,080 93% 5,460 5,158 94% 5,338 5,106 96% E. coli PSMs 12,141 5,007 41% 11,998 6,510 54% 11,710 7,473 64% Unique peptides 6,576 3,640 55% 6,323 4,389 69% 6,084 4,749 78% Protein groups 1,245 1,052 84% 1,234 1,129 91% 1,198 1,119 93%
Specifically, in isolation width 0.1, the percent error was decreased from 59% to 35% for the
higher ratio 8:1 and from 21% to 11% for the lower ratio 2:1. For example, while 67% of the
ratios measured at isolation width 2.0 were below 4 for the expected ratio 8:1, 73% of these
were above the 4-fold threshold using the narrow acquisition. Additionally, the ratio
11
the compression effect could be modelled by the isolation width gradient to predict the ratios
at isolation widths close to zero. Because the use of the narrowest isolation width yielded the
smallest interference, for all downstream analysis we use only the data obtained at isolation
width 0.1. Two example identification and quantification spectra matched to ghrB (E. coli)
and ARID1A (human) peptides are shown in Figure 3. Both peptides suffered significant ratio compression at the “standard” isolation width due to high precursor interference,
however the second HCD scan at isolation width 0.1 provided more accurate quantification
(Figure 3, right panels). Specifically, at the “standard” scan, the ARID1A peptide displayed a 3.9-fold down-regulation in the ARID1A knock-out cells suggesting an in-complete
silencing of the gene. However, the narrow MS2 scan of the same precursor ion revealed a
19-fold reduction of the protein product. The latter is more likely to reflect a complete
knock-out, particularly when the previously described spatial constraints on protein quantification
by TMT26, that do not permit proper discrimination of truly missing proteins are taken into consideration. Interestingly, both MS2 spectra of these Arginine-ending peptides contain a
peak at m/z 376.27 which is a characteristic y1 ion from Lysine-ending interfering peptide as
12
13
Figure 3. Example spectra for E. coli and human peptides. Precursor ion cluster, annotated HCD MS2 fragment ion spectrum and TMT signal-to-noise values at “standard” and “narrow” isolation widths for a peptide matched to E. coli ghrB gene (top panel) and for a peptide matched to human ARID1A (bottom panel). Unassigned peaks are shown in grey font on the MS2 spectra.
As the narrow isolation widths did not provide quantification for about 25-35% of the
respective “standard” scans, we next aimed to model the compression effect using linear
regression and to calibrate all primary quantifications obtained at the “standard” scans. Upon
manual examination of the quantification spectra, we found that the narrow isolation widths
were not always effective in reducing isolation interference. To identify the E. coli spectra
with significant reduction of the interference upon the application of narrower precursor
selection and therefore to model the compression effect more accurately, we computed the
ratio 129(IW 0.1)/129(IW 2.0) of the scaled abundances as a metric for the magnitude of
correction. In this instance, a low ratio (large difference in signal intensity) would suggest
effective correction by the narrow scan whereas a high ratio would suggest insufficient
correction or spectra with originally low interference. Examples of quantification spectra with
14
peptide features are associated with effective correction by the narrow scans, we next
correlated this ratio metric with peptide m/z, charge, precursor intensity and isolation
interference (the percentage of ion signal not attributed to the targeted precursor within a
specified isolation window as reported by ProteomeDiscoverer software) (Figure S2B). We found that peptides with lower m/z, charge and precursor intensity (positively correlated) and
high isolation interference (negatively correlated) are more effectively corrected by the
narrow scans. Therefore, we can enrich for peptides that are effectively corrected by the
narrow scans in samples with unknown protein abundances, by applying cutoffs to these
features. Consequently, we selected doubly charged PSMs, with m/z and precursor intensity
smaller than the median of all PSMs (<698.4 and <2.4E+6 respectively) as well as isolation
interference greater than the median of all PSMs (>18.2%) as input for the Deming regression
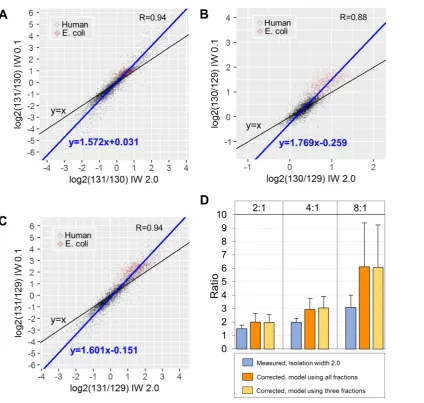
analysis (n=3,616). To model the compression effects we generated the scatterplots of the
selected PSMs using the logarithmic ratios from IW 2.0 scans against their counterparts at IW
0.1. We observed a linear response with Pearson’s R>0.88 and Deming regression slope>1.57
for three comparisons (131/130, 130/129 and 131/129) indicative of the compression effect
(Figure 4A, 4B and 4C). Using the slope and the intercept of these linear models we calibrated the log2ratios acquired at IW 2.0 for all human and E. coli PSMs. To evaluate the
decompression efficiency, we retrieved the calibrated E. coli PSM log2ratios, converted to
2log2ratio and computed the mean ratio per protein. This analysis showed that the
regression-based calibration could decompress the original ratios up to 1.9-fold on average (Figure 4D). For example, in the expected ratio 8:1 only 28 proteins (2%) had a ratio greater than 5 at the
standard isolation width however in the calibrated values, 820 proteins (66%) were above this
threshold. This improvement can have important implications in statistical analysis and
identification of differentially expressed proteins when specific cut-offs are applied. As the
15
predictive models could be built using a smaller subset of PSMs from only three randomly
selected fractions. Indeed, a very similar degree of decompression could be achieved from
only a subset of the fractions (Figure 4D and Supporting information). This suggests that all peptide fractions could be analysed with a usual TMT method for maximum proteome
coverage, followed by the DIWA re-run of only a few fractions for regression analysis and
retrospective decompression of all the original ratios. Additionally, correlation analysis
showed that the percent error at IW 2.0 is positively correlated with charge state and isolation
interference and negatively correlated with precursor intensity, m/z and Sequest
cross-correlation score (Xcorr) (Figure S2C). These characteristic features could be utilized to build more accurate predictive models using machine learning approaches (e.g. Support
Vector Regression). Overall, our feasibility experiment shows that the acquisition of an
additional HCD scan event at a narrow isolation width immediately after the acquisition of a
standard MS2 scan for the same precursor, can be used to enhance accuracy of quantification
for the majority of the identified peptides. Moreover, the dual isolation data can be used to
model the compression effect by linear regression extending the coverage of the ratio
16
Figure 4. Deming regression models and ratio decompression. Scatter plots of the (A) 131/130, (B) 130/129 and (C) 131/129 logarithmic ratios at isolation width 2.0 (x-axis) versus isolation width 0.1 (y-axis). D) Bar plots of the E. coli protein ratios (average of PSM ratios) before and after decompression at the different theoretical ratios. Error bars represent standard deviation.
CONCLUSIONS
The selection of precursor ions using narrow isolation windows is a rational approach to
reduce peptide co-fragmentation and therefore to improve isobaric labelling-based
quantification at the MS2 level. However, this approach yields very low proteome coverage
17
this limitation, we have designed a novel method based on sequential HCD-HCD activation
in a dual isolation width mode followed by modelling of ratio compression and correction.
We have tested the method on an LTQ Orbitrap Velos system with a common Nth-order
double play method. Importantly, apart from some additional data analysis steps, the DIWA
approach does not require major changes in sample preparation protocols or specialized
instrument configuration adjustments of the LTQ-Orbitrap systems (Velos and Elite). Using a
two-proteome model and a CRISPR-cas9 gene knockout, we show that the method achieves
comprehensive proteome coverage and preliminary quantification of all peptides while the
additional narrow isolation width can improve the quantitative accuracy for a significant
portion of these. Furthermore, the low-interference spectra can be used as “pseudo-internal
standards” to model the compression effect by linear regression in a sample-specific manner.
With appropriate factory-level tuning of the minimum isolation width setting, the
enhancement offered by the DIWA method has the potential to be universal to other
platforms, such as benchtop Q-Exactives or Q-TOFs, that can only perform isobaric labelling
quantification at the MS2 level. We expect a variation in the DIWA performance depending
on the geometries of different spectrometry platforms and their isolation efficiencies and
therefore further tests and optimizations are warranted. Moreover, the combination of DIWA
with previously described approaches such as gas-phase purification or the recently described
high-field asymmetric waveform ion mobility spectrometry (FAIMS)27
could further improve
the accuracy of isobaric labelling at the MS2 level. Future developments in mass
spectrometry technology, which improve isolation efficiency and analytical speed in
combination with intelligent precursor selection decision trees could further boost the
sensitivity and accuracy of the method. We conclude that the DIWA approach can provide
18
implementation offers the foundations for further developments and offers universal
applicability.
SUPPORTING INFORMATION
The following supporting information is available free of charge at ACS website
http://pubs.acs.org:
Deming Regression analysis R-code and models
Figure S1. Bar plots of quantitative coverage
Figure S2. Correction efficiency correlation with peptide features
Table S1. Peptide Spectrum Matches for DIWA IW2.0/IW0.1
Table S2. Peptide Spectrum Matches for DIWA IW2.0/IW0.2
Table S3. Peptide Spectrum Matches for DIWA IW2.0/IW0.3
AUTHOR CONTRIBUTIONS
Conceptualization: T.I.R., J.S.C.; Experiments: T.I.R.; Data analysis: T.I.R., H.W.; Writing original draft: T.I.R., J.S.C.; Final draft/editing: all
NOTES
The authors declare no competing financial interest.
ACKNOWLEDGMENTS
We thank Ultan McDermott and Stacey Price for donating the CL-40 cell pellet, David J. Adams for donating the human iPS WT and ARID1A KO cell pellets, Lu Yu for her help with mass spectrometry quality control and Daniel Bode for discussions about data analysis. This work was funded by a core grant from the Wellcome Trust (098051).
REFERENCES
19
2. O'Connell, J. D.; Paulo, J. A.; O'Brien, J. J.; Gygi, S. P., Proteome-Wide Evaluation of Two Common Protein Quantification Methods. J Proteome Res 2018,17 (5), 1934-1942.
3. Zhang, H.; Liu, T.; Zhang, Z.; Payne, S. H.; Zhang, B.; McDermott, J. E.; Zhou, J. Y.; Petyuk, V. A.; Chen, L.; Ray, D.; Sun, S.; Yang, F.; Chen, L.; Wang, J.; Shah, P.; Cha, S. W.; Aiyetan, P.; Woo, S.; Tian, Y.; Gritsenko, M. A.; Clauss, T. R.; Choi, C.; Monroe, M. E.; Thomas, S.; Nie, S.; Wu, C.; Moore, R. J.; Yu, K. H.; Tabb, D. L.; Fenyo, D.; Bafna, V.; Wang, Y.; Rodriguez, H.; Boja, E. S.; Hiltke, T.; Rivers, R. C.; Sokoll, L.; Zhu, H.; Shih, I. M.; Cope, L.; Pandey, A.; Zhang, B.; Snyder, M. P.; Levine, D. A.; Smith, R. D.; Chan, D. W.; Rodland, K. D.; Investigators, C., Integrated Proteogenomic Characterization of Human High-Grade Serous Ovarian Cancer. Cell 2016,166 (3), 755-765.
4. Mertins, P.; Mani, D. R.; Ruggles, K. V.; Gillette, M. A.; Clauser, K. R.; Wang, P.; Wang, X.; Qiao, J. W.; Cao, S.; Petralia, F.; Kawaler, E.; Mundt, F.; Krug, K.; Tu, Z.; Lei, J. T.; Gatza, M. L.; Wilkerson, M.; Perou, C. M.; Yellapantula, V.; Huang, K. L.; Lin, C.; McLellan, M. D.; Yan, P.; Davies, S. R.; Townsend, R. R.; Skates, S. J.; Wang, J.; Zhang, B.; Kinsinger, C. R.; Mesri, M.; Rodriguez, H.; Ding, L.; Paulovich, A. G.; Fenyo, D.; Ellis, M. J.; Carr, S. A.; Nci, C., Proteogenomics connects somatic mutations to signalling in breast cancer. Nature 2016,534 (7605), 55-62.
5. Roumeliotis, T. I.; Williams, S. P.; Goncalves, E.; Alsinet, C.; Del Castillo Velasco-Herrera, M.; Aben, N.; Ghavidel, F. Z.; Michaut, M.; Schubert, M.; Price, S.; Wright, J. C.; Yu, L.; Yang, M.; Dienstmann, R.; Guinney, J.; Beltrao, P.; Brazma, A.; Pardo, M.; Stegle, O.; Adams, D. J.; Wessels, L.; Saez-Rodriguez, J.; McDermott, U.; Choudhary, J. S., Genomic Determinants of Protein Abundance Variation in Colorectal Cancer Cells. Cell Rep 2017,20 (9), 2201-2214.
6. Lapek, J. D., Jr.; Greninger, P.; Morris, R.; Amzallag, A.; Pruteanu-Malinici, I.; Benes, C. H.; Haas, W., Detection of dysregulated protein-association networks by high-throughput proteomics predicts cancer vulnerabilities. Nat Biotechnol 2017,35 (10), 983-989.
7. Svinkina, T.; Gu, H.; Silva, J. C.; Mertins, P.; Qiao, J.; Fereshetian, S.; Jaffe, J. D.; Kuhn, E.; Udeshi, N. D.; Carr, S. A., Deep, Quantitative Coverage of the Lysine Acetylome Using Novel Anti-acetyl-lysine Antibodies and an Optimized Proteomic Workflow. Mol Cell Proteomics 2015,14 (9), 2429-40.
8. Rose, C. M.; Isasa, M.; Ordureau, A.; Prado, M. A.; Beausoleil, S. A.; Jedrychowski, M. P.; Finley, D. J.; Harper, J. W.; Gygi, S. P., Highly Multiplexed Quantitative Mass Spectrometry Analysis of Ubiquitylomes. Cell Syst 2016,3 (4), 395-403 e4.
9. Mertins, P.; Udeshi, N. D.; Clauser, K. R.; Mani, D. R.; Patel, J.; Ong, S. E.; Jaffe, J. D.; Carr, S. A., iTRAQ labeling is superior to mTRAQ for quantitative global proteomics and phosphoproteomics.
Mol Cell Proteomics 2012,11 (6), M111 014423.
10. Hogrebe, A.; von Stechow, L.; Bekker-Jensen, D. B.; Weinert, B. T.; Kelstrup, C. D.; Olsen, J. V., Benchmarking common quantification strategies for large-scale phosphoproteomics. Nat Commun 2018,9 (1), 1045.
11. Chong, P. K.; Gan, C. S.; Pham, T. K.; Wright, P. C., Isobaric tags for relative and absolute quantitation (iTRAQ) reproducibility: Implication of multiple injections. J Proteome Res 2006,5 (5), 1232-40.
12. Ow, S. Y.; Salim, M.; Noirel, J.; Evans, C.; Rehman, I.; Wright, P. C., iTRAQ underestimation in simple and complex mixtures: "the good, the bad and the ugly". Journal of proteome research 2009,
8 (11), 5347-55.
13. Christoforou, A.; Mulvey, C. M.; Breckels, L. M.; Geladaki, A.; Hurrell, T.; Hayward, P. C.; Naake, T.; Gatto, L.; Viner, R.; Martinez Arias, A.; Lilley, K. S., A draft map of the mouse pluripotent stem cell spatial proteome. Nat Commun 2016,7, 8992.
14. Bai, Y.; Markham, K.; Chen, F.; Weerasekera, R.; Watts, J.; Horne, P.; Wakutani, Y.; Bagshaw, R.; Mathews, P. M.; Fraser, P. E.; Westaway, D.; St George-Hyslop, P.; Schmitt-Ulms, G., The in vivo brain interactome of the amyloid precursor protein. Mol Cell Proteomics 2008,7 (1), 15-34.
20
D'Santos, C. S.; Carroll, J. S., A quantitative mass spectrometry-based approach to monitor the dynamics of endogenous chromatin-associated protein complexes. Nat Commun 2018,9 (1), 2311. 16. Wu, L.; Candille, S. I.; Choi, Y.; Xie, D.; Jiang, L.; Li-Pook-Than, J.; Tang, H.; Snyder, M., Variation and genetic control of protein abundance in humans. Nature 2013,499 (7456), 79-82. 17. Ow, S. Y.; Salim, M.; Noirel, J.; Evans, C.; Wright, P. C., Minimising iTRAQ ratio compression through understanding LC-MS elution dependence and high-resolution HILIC fractionation.
Proteomics 2011,11 (11), 2341-6.
18. Savitski, M. M.; Sweetman, G.; Askenazi, M.; Marto, J. A.; Lang, M.; Zinn, N.; Bantscheff, M., Delayed fragmentation and optimized isolation width settings for improvement of protein identification and accuracy of isobaric mass tag quantification on Orbitrap-type mass spectrometers.
Anal Chem 2011,83 (23), 8959-67.
19. Ting, L.; Rad, R.; Gygi, S. P.; Haas, W., MS3 eliminates ratio distortion in isobaric multiplexed quantitative proteomics. Nature methods 2011,8 (11), 937-40.
20. McAlister, G. C.; Nusinow, D. P.; Jedrychowski, M. P.; Wuhr, M.; Huttlin, E. L.; Erickson, B. K.; Rad, R.; Haas, W.; Gygi, S. P., MultiNotch MS3 enables accurate, sensitive, and multiplexed detection of differential expression across cancer cell line proteomes. Anal Chem 2014,86 (14), 7150-8.
21. Wenger, C. D.; Lee, M. V.; Hebert, A. S.; McAlister, G. C.; Phanstiel, D. H.; Westphall, M. S.; Coon, J. J., Gas-phase purification enables accurate, multiplexed proteome quantification with isobaric tagging. Nature methods 2011,8 (11), 933-5.
22. Wuhr, M.; Haas, W.; McAlister, G. C.; Peshkin, L.; Rad, R.; Kirschner, M. W.; Gygi, S. P., Accurate multiplexed proteomics at the MS2 level using the complement reporter ion cluster. Anal Chem 2012,84 (21), 9214-21.
23. Shliaha, P. V.; Jukes-Jones, R.; Christoforou, A.; Fox, J.; Hughes, C.; Langridge, J.; Cain, K.; Lilley, K. S., Additional precursor purification in isobaric mass tagging experiments by traveling wave ion mobility separation (TWIMS). J Proteome Res 2014,13 (7), 3360-9.
24. Niu, M.; Cho, J. H.; Kodali, K.; Pagala, V.; High, A. A.; Wang, H.; Wu, Z.; Li, Y.; Bi, W.; Zhang, H.; Wang, X.; Zou, W.; Peng, J., Extensive Peptide Fractionation and y1 Ion-Based Interference Detection Method for Enabling Accurate Quantification by Isobaric Labeling and Mass Spectrometry. Anal Chem 2017,89 (5), 2956-2963.
25. Vizcaino, J. A.; Csordas, A.; Del-Toro, N.; Dianes, J. A.; Griss, J.; Lavidas, I.; Mayer, G.; Perez-Riverol, Y.; Reisinger, F.; Ternent, T.; Xu, Q. W.; Wang, R.; Hermjakob, H., 2016 update of the PRIDE database and its related tools. Nucleic Acids Res 2016,44 (22), 11033.
26. O'Brien, J. J.; O'Connell, J. D.; Paulo, J. A.; Thakurta, S.; Rose, C. M.; Weekes, M. P.; Huttlin, E. L.; Gygi, S. P., Compositional Proteomics: Effects of Spatial Constraints on Protein Quantification Utilizing Isobaric Tags. J Proteome Res 2018,17 (1), 590-599.