DOI: 10.14738/abr.612.5843.
Nugroho, M. (2018). The Effect of Economic Value Added (EVA), Market Value Added (MVA), Refined Economic Value Added (REVA) on Stock Prices and Returns Stock at Manufacturing Industries Who Listed on Indonesia Stock Exchange (BEI).
Archives of Business Research, 6(12), 173-188.
The Effect of Economic Value Added (EVA), Market Value Added
(MVA), Refined Economic Value Added (REVA) on Stock Prices
and Returns Stock at Manufacturing Industries Who Listed on
Indonesia Stock Exchange (BEI)
Mulyanto Nugroho
Department of Accounting,
University of 17 Agustus 1945 Surabaya, Indonesia
ABSTRACT
The development of returns stock of manufacturing companies shows a fluctuating movement from year to year. Movement of returns such as this indicates that the state of the manufacturing company is unstable so that it has an impact on returns the resulting stock. This uncertainty will certainly create a concern for investors who will invest shares in manufacturing companies. It is important for investors to analyze company’s condition so that the investment will get return. One aspect of the company that can be assessed by investors is the company's performance through financial statements. Company performance measurement can be categorized into three groups, namely (1) Earning Measurement, (2) Cash Flow Measurement, and (3) Value Measurement. The purpose of this paper is to test EVA, MVA, and REVA on stock prices and returns stock. In this study using a sample of 104 manufacturing companies taken through random sampling in the 2014-2016 period. Data analysis and hypothesis testing in this study using Partial Least Square Path Modeling (PLS-SEM). The results show that EVA, MVA, and REVA have a significant positive relationship to stock prices and returns stock. By looking at the results of this study, it shows that performance appraisal uses EVA, MVA, and REVA methods have a strong influence on stock prices and returns stock. This shows that valuation based on value is important because each investment can’t escape the consequences of the emergence of capital costs as compensation for the funds used to finance the investment.
Keywords: value measure; EVA; MVA; REVA; PLS-SEM; stock prices; returns stock.
INTRODUCTION
Capital market is a market for a wide range with long term financial instruments that can be traded. Financial instruments traded on the capital market are stocks, bonds, warrants, rights, and various other products. The capital market provides a large role for economic condition of country because the capital market provides two functions at once, namely the function of the economy and financial functions. Capital markets are said to have economic functions because the capital market provides facilities or vehicles that bring together two area of interest, such as investors and issuers. The capital market is described to have a financial function, because it provides the possibility and opportunity to get a return for investors and it based on the characteristics of the chosen investment [1].
Stocks are financial instruments that have rate of return a more volatile than other financial instruments. The uncertainty of stock prices traded on the stock exchange is a problem found in the stock exchange in general. Changes in stock prices from period to period cause returns to stock be uncertain and risky on the capital invested by investors with the purchase of shares, especially in manufacturing companies.
In Indonesia, the share of manufacturing companies every year has different value return. In 2010 the return of manufacturing companies was at an average return of 35.06%. In the following year, in 2011, the average return of manufacturing companies was at a value return of 34.61%, indicating a decrease of 0.35% from the previous year, namely 2010. In 2012 the average return of manufacturing companies was at a percentage of 31.62%. This year also experienced a decline in the average return of 3% from the previous year. Whereas in 2013 the return of manufacturing companies in Indonesia experienced a drastic decline which was a decrease of up to -35.36% from 2012, so that the average return in 2013 was in the percentage of -4.26%. In 2014 the average return of manufacturing companies in Indonesia experienced a recovery from the previous year which was up to minus -4.26%, which was at the percentage of 29.80% even though this percentage was not greater than the percentage average return in the previous 2-3 years.
The data shows that the development of returns stock of manufacturing companies shows a fluctuating movement from year to year. Movement of returns such as this indicates that the condition of the company is not stable so that it has an impact on the returns stock generated. This uncertainty will certainly create a concern for potential investors who will invest in manufacturing companies.
In the capital market, the investors who will invest by buying shares will analyze the condition of the company. This is an important activity that needs to be done by investors, namely a careful assessment of issuers. One aspect of a company that is valued by investors is the company's performance. The performance measurement was used to know company's financial performance. Normatively this is also the main goal that the company will achieve in financial decisions made is to increase the prosperity of the company owner and investor as indicated by increasing the value company's and rising stock prices [2]. Companies must be able to show good performance in accordance with the expectations of shareholders. The references used to measure the wealth of shareholders include company performance as reflected in the company's annual financial report.
According to [3] categorizes company performance measurements into three categories, namely: (1) Earning Measurement, (2) Cash Flow Measurement, and (3) Value Measurement. The performance measurement of company that based on value system is periodically measured in the context of changes in value. Performance measurement based on value are namely by economic value added (EVA), market value added (MVA), and refined economic value added (REVA) which are developments in the form of measurement of economic value added (EVA). Thus has meaning whether increasing value means also increasing investment long-term shareholder returns. Based on [4] states that value measures are considered to have capabilities that exceed other performance measurements, because they take into account all the factors associated with the creation (value) of the company that have an impact on the increasing prosperity of shareholders.
value added (EVA) to the company's stock price. In this paper will explain that economic value added (EVA) has significant influence on stock prices on companies that are the object of research. According to [6] also emphasizes that a high economic value added (EVA) coefficient explains the variable share price of a company, it explained that economic value added (EVA) can influence investors' decisions in investing.
There are several previous studies of the effect of economic value added (EVA) on returns stock. Research [1] examine the influences of economic value added (EVA) on returns stock on the Karachi Stock Exchange. The result show that economic value added (EVA) has an influence on returns stock. In this study further explained that variables economic value added (EVA) showed a significant effect on returns stock.
According to [7] and [8], tests have been conducted on the effect of market value added (MVA). The criteria for company’s performance in this study are proxied through returns and stock prices. [7] show that there is a positive influence on market value added (MVA) on company performance, which has an impact on increasing stock prices. This was also explained in the [8]. Based on [8] states that market value added (MVA) be able to represent the formation of shareholder value where it can reflect profit (return) on a company or it can be said that market value added (MVA) has positive impact of stock returns.
In contrast to the results of the research described previously, several of studies show different results in testing variables economic value added (EVA) and market value added (MVA). Some of them which are [9], [10] and [11]. In the results of the research [9], it shows that economic value added (EVA) does not have a significant effect on shareholder returns. This is contrary to the results of research by [1]. Whereas in the study of [10] examining the relationship of economic value added (EVA) and market value added (MVA) on stock prices showed different results from the previous research presented. The results of the study indicate that there is no relationship between economic value added (EVA) and market value added (MVA) of stock prices. This is contrary with results of the research of [5] and [6]. Based on [11] show research results that are different from previous studies. The results of these studies indicate that market value added (MVA) has no reationship on the stock returns.
According to the background of the research problems that has been previous described and the differences in the results of previous studies, this study will examine the effect of economic value added (EVA), market value added (MVA), refined economic value added (REVA) on stock prices and stock returns. The results of this study are expected to add empirical evidence to the effect of economic value added (EVA), market value added (MVA), refined economic value added (REVA) on stock prices and returns stock and can also help investors assess the financial performance.
In line with the formulation of the problem described, the objectives of this research are:
1. To analyze influence of economic value added (EVA) on stock prices of manufacturing industries listed on the Indonesia Stock Exchange.
2. To analyze influence of market value added (MVA) on stock prices of manufacturing industries listed on the Indonesia Stock Exchange.
3. To analyze influence of refined value added (REVA) on stock prices of manufacturing industries listed on the Indonesia Stock Exchange.
4. To analyze influence of economic value added (EVA) on stock returns of manufacturing industries listed on the Indonesia Stock Exchange.
6. To analyze influence of refined value added (REVA) on stock returns of manufacturing industries listed on the Indonesia Stock Exchange.
7. To analyze influence of stock prices on stock returns of manufacturing industries listed on the Indonesia Stock Exchange.
LITERATURE REVIEW Economic Value Added (EVA)
EVAis able to define as cash flow after the tax that was generated by the company's operations. It is reduced by the capital cost used. In contrast to traditional work measurement, the way EVA measures a company's performance is to reduce after tax profit by the capital cost, where the capital cost reflects the company's risk. This is in accordance with what was said by [12] that "EVA is calculated by substracting the cost of funds using finance and investment from tax operating profits".
Simply put, EVA is what is left over from operating income after adjusting for the capital costs incurred in the business. EVA is an approach in assessing the company’s performance by paying fair attention to the expectations of funders, namely shareholders and creditors. It can be said that EVA is a tool that can be used to measure profitability of a company in real terms.
From some notions of EVA as mentioned above, EVA is a measure of profitability of a company that is not only based on conventional accounting but also take into account the capital cost of corporate. EVA’s concept is very useful as a company performance appraiser where the focus of performance assessment is on value creation. Performance appraisal using the approach EVA causes management attention to be more in line with the interests of shareholders.
With EVA people will think and act as shareholders, namely maximizing the level of capital costs, so that the company's value can be maximized. In addition, the use of EVA is also useful for making companies pay attention to their capital structure policies. According to [12] EVA is defined as differences between investment's net operating profit after taxes and the cost of funds.
The economic value added (EVA) after tax operating profit is reduced by the total capital cost structure used by the company. The concept of cost of capital is a very important concept in this approach, because EVA itself departs from the calculation of capital cost. Capital cost of a company can be defined as a rate of return that must be obtained in order to meet the combined rate of return expected by the company's investors. This concept is intended to be able to determine the amount of real costs that must be borne by the company to obtain funds from a source. By including the element of capital costs in calculating the company's financial performance, the approach EVA does not only look at the rate of return, but also explicitly considers the level of risk of the company. The higher risk level will be the higher expected rate of return.
The concept of economic value added (EVA) also explains three measures that can be used to see the performance of a company [13] namely:
1. Value EVA > 0 (+ Positive) = The company has created added value for the company. 2. EVA = 0 = Company on BEP conditions for all profits used to pay obligations to
investors.
The explanation is if EVA positive (> 0), indicates that the resulting return rate is greater than capital cost or there is economic value into the company during its operations. If EVA = 0, it means that the company breaks even because all profits are used to pay obligations to investors, both creditors and shareholders. If EVA negative (<0), indicates that the value of the company decreases as a result of rate of return which is lower than the rate of return demanded by the investor or the company's operational performance fails to meet investor expectations, the company does not make added value because available profits cannot meet expectations of fund providers, especially shareholders.
In addition, EVA helps managers in decision making, namely to maximize wealth shareholder and the value of a company depending on future profits, whether exceeding or at the minimum rate of return expected by investors. This is because the method EVA is a method of value creation for shareholders. In other words the increasing in EVA will lead for increasing company's market value, whenever EVA increases it means the company is able to generate profits and can create added value for its shareholders.
Net Operating Profit After Tax (NOPAT)
Net operating profit after tax is a number of corporate profits that will be generated if the company does not have debt and does not have financial assets or in other words the company's net profit after the company deducts the debt and taxes the company has. According to [12] states that NOPAT is a company’s earnings before after interest and taxes.
Weight Average Capital Cost (WACC)
Weight average capital cost is the method of weight average capital cost structure of the company. From the balance sheet can be known financial leverage namely the source of the company's capital funds obtained from two kinds of sources, namely debt (debt) and from own capital (equity). The WACC value can be obtained by the following formula [14].
Invested Capital
Invested capital is the result of reorganizing the balance sheet to see the amount of capital invested in the company's operational and non-operational activities. Based on [15] state that invested capital is the amount of shareholders' equity both short and long term debt.
Market Value Added (MEVA)
The market value added is differences between market value and the amount of equity capital investors which have given. With the target can benefit shareholders and also can help to ensure that the available resources have been efficiently reversed. [4] stated the measure of performance, financial namely EVA and MVA as the right measure to measure whether shareholder wealth has been successfully created or not, if the amount company’s market value has exceeded and capital has invested in it, then industry has succeeded in creating a shareholder value and vice versa, furthermore the MVA has a picture of past performance and its prospects in the future.
Based on [16], it explained that MVA stated how much prosperity the company created or eliminated. MVA also shows how much wealth or profit the company can produce for shareholders, if the company sells its shares at that time. With goals can benefit shareholders and also can help to ensure that limited resources have been allocated efficiently which will provide benefits.
How to calculate market value added, first add up all the capital invested in the company, which is invested by shareholders, bank loans and loans from bond sellers, and retained earnings. Then analyzed how the market evaluates the company by examining outstanding market values and adding company debts. If the company’s value is greater than capital, then company has a value MVA positive, it has been meaning that managers have carried out their main task of creating wealth, if MVA negative means the manager destroys value.
In general, MVA can be calculated by the following formula [14]:
<=> = <?@ABC =?DEB FGEHCI − KLC?D MCLNA FGEHCI (1)
Market value of equity is an approach of market value, total capital and debt capitalization of a company. Because this equity market price is not available in full in the company's financial statements, it can be calculated by:
<=> = O@HNB OB@ Pℎ?@B × CLC?D Pℎ?@BP − BGEHCI PCLNA (2)
The number of shares in question is the number of shares issued and placed (outstanding share) and the price of stock is the closing price on the exchange. But to get value MVA an accurate, each component is adjusted first, and the related components in it. Market value is approach fair market value for all capitalization debt and equity corporate.
In calculating values, MVA two possible results will be obtained, namely [15]:
1. MVA is positive, if the value indicates that the company's management has succeeded in maximizing the company's shareholder wealth.
2. MVA Negative, if the value shows poor performance from company management. The management of the company is not successful in maximizing shareholder wealth.
Refined Economic Value Added (REVA)
Refined economic value added (REVA) as a financial performance measurement tool is a new alternative in an effort to determine the performance of a company, especially in associate with the stock price on the stock. The concept REVA, as well as EVA, bases the measurement of shareholder value with risk and return on invested capital.
increase stock prices in the market. The use of REVA encourages managers to think and act like shareholders, namely maximizing the rate of return and minimizing capital cost as well as the opportunity cost so that the value of the company can continue to be increased. This causes company managers to be more careful in designing the company's capital structure. This method creates a financial discipline that encourages managers to act as company owners and one of the most important things is to increase profit for shareholders as reflected in the increase in returns stock.
The interpretation of the results of measurements using REVA according to [18] as follows: 1. If REVA > 0, this indicates that there has been a process of value added financial for the
company or there is more economic value after the company pays all obligations to funders and creditors shareholders.
2. If REVA = 0, this indicates that there is no process of added value or economic reduction because the profit has been used up to pay the obligations to both the creditor's funders and shareholders.
3. If REVA < 0, this indicates that there is no economic value added process for the company or the company is unable to pay the obligations of funders, both creditors and shareholders.
Conceptual Framework
In investing by investing funds in shares, an investor needs to analyze the financial performance of the shares he holds. The uncertainty of stock prices traded on the stock exchange is a problem found on the stock exchange in general. Changes in stock prices from period to period cause returns to stock be uncertain.
The company's performance measurement system based on value measures is a measure of periodic performance in the context of changes in value. Measurements of performance based on value measures namely an economic value added (EVA), market value added (MVA), and refined economic value (REVA) which are developments in the form of measurement of economic value added (EVA). This performance measurement holds that increasing value means also increasing investment long-term shareholder returns. [4] states that value measures are considered to have capabilities that exceed other performance measurements, because they take into account all the factors associated with the creation (value) of the company that have an impact on the increasing prosperity of shareholders.
The higher of stock price will increase the differences between initial value of investment that invested in the stock and the selling price during sales period. This is can be happened because of the changes in the value of the stock price can affect the amount of returns stock on a company's securities.
Figure 1 Conceptual Framework
Research Hypothesis
Hypotheses to be built with respect to the influence of EVA, MVA and REVA on prices and returns is as follows.
H1: EVA has a positive influence on prices stock in manufacturing industries listed on the Indonesia Stock Exchange.
H2: MVA has a positive influence on prices stock in manufacturing industries listed on the Indonesia Stock Exchange.
H3: REVA has a positive influence on prices stock in manufacturing industries listed on the Indonesia Stock Exchange.
H4: Evaluation of company performance using method EVA has a positive influence on returns stock in manufacturing industries listed on the Indonesia Stock Exchange.
H5: MVA has a positive influence on returns stock in manufacturing industries listed on the Indonesia Stock Exchange.
H6: REVA has a positive influence on returns stock in manufacturing industries listed on the Indonesia Stock Exchange.
H7: The price stock has a positive influence on returns stock in manufacturing industries listed on the Indonesia Stock Exchange.
METHODOLOGY Design of Research
[19] defines the use of the term research design in two things, among others, first, research design is a research strategy in identifying problems before the final planning of data collection; and second, the research design is used to define the structure of the research to be carried out. In this section the research design intended refers to the second understanding of the research design, namely the structure of the research to be carried out in the study.
In this study, researchers determined the type of research using quantitative methods because the research data were in the form of numbers and analyzed using statistics. Descriptive analysis is also used in this study to describe research variables and causal designs to look for influences between research variables [20].
This study will measure and analyze the effect of corporate valuation through economic value added (EVA), market value added (MVA), and refined economic value added (REVA) on abnormal returns and returns stock. The next step is the determination of the hypothesis that refers to theoretical and empirical studies. The technique of collecting data through observation of non-behavioral records analysis. The existing data will be processed and analyzed using the application Smart PLS. The results of the analysis are then interpreted and
Economic Value Added (EVA)
(X1)
Market Value Added (MVA)
(X2)
Refined Economic Value Added (EVA)
(X3)
Stock Price (Z)
Stock Return
(Y)
+H1
+H2
+H3
+H4
+H5
+H6
discussed so that the results of the study can be concluded and advice is given on these problems.
Population and Sample
Target population is the focus of a large target of a researcher who is a collection or element that has information sought by researchers and the results of his research will show an inferential conclusion for that group or population. In accordance with the purpose of this study and referring to the understanding of the target population that has been described as eating, the population that is used are all manufacturing industries listed on the Indonesia Stock Exchange for the 2014-2016 period, 140 companies in total.
Sample is a subset of the population, the sample is a number of members of the population. This subset is taken because in many cases it is impossible for us to examine all members of the population, therefore we form a representative population called a sample. Determination of the number of samples in this study using the Yamane approach method. The determination of samples using the Yamane method uses the following formula:
ɳ =$T6U6 V (3)
Where:
ɳ = number of samples N = population size
D = specified precision or percentage.
Based on the Yamane method formula that has been described previously, the calculation of the number of samples used in this study is as follows:
The Amount of Population (N) = 140
Percentage (D) = 5%
ɳ = 140
1 + 140 5% '= 104
After determining the size or size of the sample to be used the next process is the process of sampling. In management research two general approaches to sampling which are usually used in the sampling process are probability sampling and nonprobability sampling.
In this study the approach used is probability sampling (the population has the same opportunity to be chosen as a sample). Probability sampling is chosen because in this study the object used in the research has the same characteristics, namely manufacturing companies. In the probability sampling approach there are several types of sampling, namely random sampling, systematic sampling, random route sampling, stratified sampling, multistage cluster sampling. In this study the researcher chose the type of sampling, which is random sampling because the use of random sampling is suitable for a relatively small population where the sampling frame is "complete and up-to-date" and each prospective sample has the same opportunity with others to be selected as sample members.
Random sampling procedures in this study using lottery methods in the following ways:
1. The researcher writes the names of 140 companies in a small piece of paper and then rolls them up and puts them in a box to shake.
Economic Value Added (EVA)
In calculating EVA there are a number of steps that must be taken such as: 1. Calculate NOPAT: After-tax net profit + Interest Fee
2. Calculating Invested Capital (IC): IC = Debt Jk. Short + Debt Jk. Length + Equity
3. Calculating the Weight Average Capital Cost (WACC): WACC = {D x rd (1-t)} + (E x re) Formula:
a. Calculating the Capital Level of Debt
Debt Level (D) = (Total Debt) / (Total Debt and Equity) b. Calculating Short Term Debt Costs
Cost of Debt (Rd) = (Debt Fee) / (Total Debt) c. Calculating Income Tax
Tax Level (T) = (Tax Expense) / (Pre-Tax Profit) d. Calculating the Capital Level of Equity
Capital Level (E) = (Total Equity) / (Total Debt and Equity) e. Calculating Capital Costs
Cost of Equity (re =) 1 / PER
4. Calculating Capital Charges: Capital Charges = WACC x Invested Capital
5. Calculating the Value of Economic Value Added (EVA): EVA = NOPAT - Capital Charges
Refined Economic Value Added (REVA)
MVA is the difference between the company's market value and the amount of capital which is a contribution from shareholders and depth holders.
<=> = <=F − \=F (5)
MVE = Outstanding Stock x Stock Price BE = Outstanding Stock x Nominal Value
Calculate the same REVA as EVA but there are a number of new indicators included.
]F=>C = ^_`>KC − (<=-b$×cd) (6)
Where:
REVAt = Refined economic value added in the period -t NOPATt = Net operating profit after tax in the period -t
MVt-1 = Market value of a business entity period t-1 (market value of equity added with total debt of book value).
Kw = Capital costs are costs loan interest and fees equity and calculated weighted average (WACC).
Stock Price and Return
The stock price is projected using the closing stock price taken from market capitalist data during the period observed in this study. The stock return of a company can be determined using the following equation:
],- = efgbefghi
efghi (7)
Where:
Pit = end of period stock price t Pit-1 = initial stock price period t
Partial Least Square Path Modelling
In previous research to know the effect of asset growth with profitability and company’s value was using PLS [20]. In this research, data analysis of this study use the Partial Least Square Path Modeling (PLS-SEM) method using the Smart PLS application. PLS-SEM is a variant-based structural equation analysis that can simultaneously test models while testing structural models. This is used to test validity and reliability, while the structural model is used to test causality (testing hypotheses with prediction models). The function of PLS-SEM is to examine the predictive effect between constructs by looking at whether there is a relationship or influence between the constructs. PLS is an analytical method that is soft modeling because it does not base on the assumption that the data must be a scale of measurement, data distribution (distribution free) and a certain number of samples, which means the sample size can be small (below 100 samples) or samples large above 200.
PLS has its own advantages including data that does not have to be normally multivariate distribution (indicators with category, ordinal scale, intervals to ratios can be used on the same model). Another advantages that is sample size have not to be large. The use of PLS to confirm the theory. It is also able to explain whether or not there is a relationship between latent variables. It can analyze and construct at the same time with reflexive indicators and formative indicators.
Indicators of latent variables formed in PLS-SEM can be either reflexive or formative. The reflexive indicator or often called Mode A is a manifestation indicator of the construct and in accordance with the classical test theory which assumes the variance is in the score measurement of the latent variable is a function of true score and an error. Whereas formative indicators or often called Mode B are indicators that define characteristics or explain constructs.
Constructs with formative indicators assume that each indicator defines or explains the characteristics of the construct domain. The criteria for formative indicators as follows:
1. The indicator defines the characteristics of the construct 2. Changes to the indicator result in changes in the construct 3. Indicators cannot be exchanged
4. Eliminate one indicator will change the meaning of the construct
Evaluation of the PLS model is done by assessing the outer and inner model. Evaluation of model or outer model is done by assess the validity and reliability of the model. Outer models with reflexive indicators are evaluated through convergent and discriminant validity of latent construct and composite reliability indicators and Cronbach alpha for indicator blocks. The following is presented the rule of thumb evaluation of the outer model in Table 1 as follows.
Table 1 Rule of Thumb
No. Validity and Reliability Rule of Thumb
1. Weight Significant • Significant is more bigger than 1.96 (significance level =5%)
percentage variance described. It is done by looking at the r-square value and the endogenous latent construct.
In hypothesis testing through Partial Least Square (PLS) using the Smart PLS 3.0 application assistance, it can be seen through the coefficient path the results of bootstrapping testing with rule of thumb significance value (two-tailed) t-value above 1.96 (significance level = 5%) so that can be stated significantly on the variable.
RESULT AND DISCUSSION Outer Model Analysis
Outer model analysis is done to ensure whether the measurement used is feasible to be used as a measurement (valid and reliable). This outer model analysis can specify the relationship between latent variables and their indicators. In Another hand, it can be said that the outer model defines how each indicator relates to its latent variables. In this study the indicators used in the construct are formative indicators. If the construct is formative, the evaluation of the measurement model is done by looking at the significance of its outer weight. The constructs with formative indicators assume that each indicator defines or explains the characteristics of the construct domain. The direction of the indicator is from the indicator to the construct. So that the validity test and construct reliability are not needed.
To obtain weight significance must go through a resampling (bootstrapping) procedure. The results of the outer weight through bootstrapping are presented in Figure 2 below:
Figure 2 Output Outer Weight
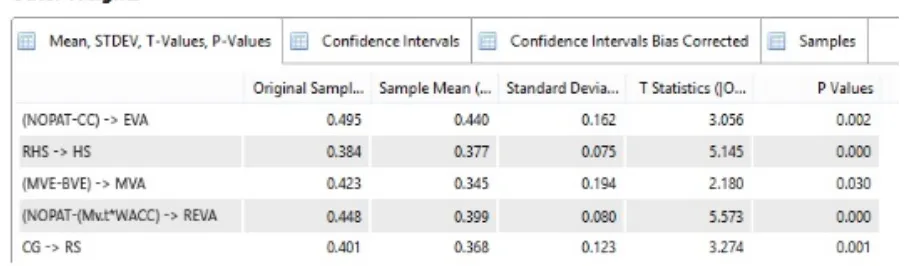
The interpretation of the outer weight output in Figure 2 is as follows:
1. The indicator (NOPAT-CC) of the construct of EVA (Economic Value Added) can be declared valid with the results of the outer weight showing the t-statistic value of 3,056 (> 1.96)
2. The RHS indicator (Average Stock Price) on the construct of HS (Stock Price) can be declared valid with the results of the outer weight showing the t-statistic value of 5.145 (> 1.96).
3. The indicator (MVE-BVE) of the MVA (Market Value Added) construct can be declared valid with the results of the outer weight showing the t-statistic value of 2.180 (> 1.96) 4. Indicators (NOPAT- (Mv.t * WACC) to the REVA (Refined Valued Added) construct can
be declared valid with the outer weight result showing a t-statistic value of 5,573 (> 1.96)
From the results of the interpretation of the outer weight above it can be seen that all the formative indicators used can be declared valid with the t-statistical value generated more than 1.96 (> 1.96)
Inner Model Analysis
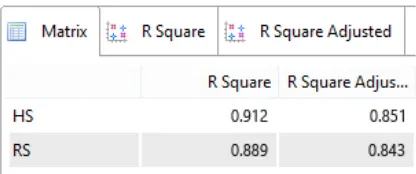
Inner model analysis is carried out to ensure that the structural model built is truly robust and accurate. Testing analysis of the inner model is done by looking at R-square value whereas goodness fit test model. The output of R-square calculation is presented in Figure 3 below:
Figure 3 Output R-square
Based on Figure 3, the R-square value for HS (stock price) shows an R-square value of 0.912 and an square adjusted of 0.851 while the square value for RS (return stock) shows the R-square value of 0.889 and R -R-square adjusted amounting to 0.843. This study leads to population research (random retrieval from the defined population) to obtain generalizations, so in this study referring to the adjusted R-square value because the adjusted R-square is used to generalize the R-square in the population.
The inner model interpretation of the construct refers to the results of the R-square adjusted which is 0.851 in HS and 0.843 in the RS that able to be interpreted that the construct stock price variable, then it can be explained by the construct variables EVA, MVA, and REVA of 85.1% while the rest 14.9% is explained by other variables outside of the research as well as in the RS construct variable (stock return). It can be explained with variables construct such as EVA, MVA, REVA with stock price of 84.3% and the remaining 15.7% is explained by other variables other than those studied.
Hypothesis Testing
Based on the output path coefficient as shown in Figure 4 above the interpretation of the results of the output are as follows:
a. The effect between EVA (Economic Value Added) and stock price is significant with t-statistic value of 2.172 (> 1.96) and the original sample value is positive, i.e. 0.560, feeding the direction of EVA (Economic Value Added) relationship with Stock Price is positive.
b. The effect between EVA (Economic Value Added) and stock return is significant with t-statistic value of 2.408 (> 1.96) and the original sample value is positive which is 0.852 hence the direction of the relationship between EVA (Economic Value Added) and stock return is positive.
c. The relationship between stock price and stock return is significant with t-statistic value of 2.064 (> 1.96) and the original sample value is positive that is 0.332, then the direction of the relationship between stock price and stock return is negative.
d. The effect between MVA (Market Value Added) and stock price is significant with t-statistic value of 1.967 (> 1.96) and the original sample value is positive i.e. 0.315, then the direction of the relationship between MVA (Market Value Added) and stock price is positive.
e. The effect between MVA (Market Value Added) and stock return is significant with t-statistic value of 2.150 (> 1.96) and the original sample value is positive i.e. 0.515, then the direction of the relationship between MVA (Market Value Added) and stock return is positive.
f. The effect between REVA (Refined Economic Value Added) and stock price is significant with t-statistic value of 2.015 (> 1.96) and the original sample value is positive which is 0.427, then the direction of the relationship between REVA (Refined Economic Value Added) and stock price is positive.
g. The effect between REVA (Refined Economic Value Added) and stock return is significant with t-statistic value of 2.562 (> 1.96) and the original sample value is positive which is 0.520 hence the direction of the relationship between REVA (Refined Economic Value Added) and stock return is positive.
Based on the hypothesis developed in this study, the next step is to boost the hypothesis testing, the results of which have been summarized below:
a. Hypothesis 1 (H1) that EVA (Economic Value Added) has positive effect on stock prices proved to have positive influence with a coefficient value of 0.560, so this hypothesis is accepted.
b. Hypothesis 2 (H2) that EVA (Economic Value Added) has positive effect on stock returns proved to have positive influence with a coefficient value of 0.860, so this hypothesis is accepted.
c. Hypothesis 3 (H3) that MVA (Market Value Added) has a positive effect on stock prices proved to have positive influence with a coefficient of 0.342, so this hypothesis is accepted.
d. Hypothesis 4 (H4) that MVA (Market Value Added) has positive influence on stock returns proved to have positive influence with a coefficient of 0.531, so this hypothesis is accepted.
e. Hypothesis 5 (H5) that REVA (Refined Economic Value Added) has positive effect on stock prices proved to have positive influence with a coefficient of 0.433, so this hypothesis is accepted.
g. Hypothesis 7 (H7) that stock prices have a positive impact on stock returns. It has positive effect with a coefficient value of 0.332 which indicates that stock prices have positive effect on stock returns, so this hypothesis is accepted.
CONCLUSION
As the purpose of this study, conclusions can be taken as follows:
1. Based on the test results in PLS-SEM proves that the variable Economic Value Added (EVA) has significant influence with a positive direction on stock prices.
2. According to the test results in PLS-SEM, the variable Economic Value Added (EVA) has significant influence on positive direction of stock returns.
3. Based on the test results in PLS-SEM proves that the Market Value Added (MVA) variable has significant influence with a positive direction on stock prices.
4. Based on the test results in PLS-SEM proves that the Market Value Added (MVA) variable has significant influence with a positive direction on stock returns.
5. Based on the test results in PLS-SEM, it is proven that the Refined Economic Value Added (REVA) variable has significant influence with a positive direction on stock prices.
6. Based on the test results in PLS-SEM, it is proven that the Refined Economic Value Added (REVA) variable has significant influence with a positive direction on stock returns.
7. Based on the test results in PLS-SEM proves that the stock price variable has significant influence with a positive direction on stock returns.
References
Awan, Abdul Ghafoor,et all. 2014. The Effect of Economic Value Added On Stock Return: Evidence From Selected Companies of Karachi Stock Exchange. Research Journal of Financial Accounting Vol. 5, No. 23, pp.140-152. ISSN 2222-1697.
Husnan, Pudjiastuti Enny. 2012. Manajemen Keuangan Edisi Keenam. Jakarta: UPP STIM YKPN.
Helfert, Erich A. 2012. Techniques of Financial Analysis:A Guide to Value Creation 11th Edition. McGraw-Hill
Publishing Co.
Steward, G. Bennet. 2013. The Quest for Value: A Guide for Senior Manager. USA: HarperCollin Publisher Inc. Ahmed, Helaluddin. 2015. Impact of Firms Earnings and Economic Value Added on The Market Share Value: An Empirical Study on The Islamic Banks in Bangladesh. Global Journal of Management and Business Research: D Accounting and Auditing Vol. 15, Iss. 2, pp. 1-4. ISSN 2249-4588. Global Journals Inc, US.
Alipour, Mohammad. 2015. The Impact of Performance Measures, Leverage and Efficiency on Market Value Added: Evidence Form Iran. Global Economics and Management Review 20, pp.6 -14. ISSN 2340-1540. Elsevier. Pourali, Mohammad Reza. 2013. The Realtionship Between Market Value Added with Refined Economic Value Added and Performance Accounting Criteria in The Firms Listed in The Tehran Stock Exchange. International Research Journal of Applied and Basic Science Vol.4, No. 6, pp. 1636-1645. ISSN 2251-838X. Science Explorer Publications.
Sichigea, Nicolae, Laura Vasilescu. 2015. Economic Value Added and Market Value Added: Modern Indicators For Assessment The Firm’s Value. Annals of the Constatin Brancusi University of Targu Jiu, Economic Series, Eco-Trend 2015 pp.488-493. ISSN 2344-3685. Academica Brancusi Publisher.
Hajiabbasi, Moreteza, et al. 2012. Comparison of Information Content Value Creation Measures and Accounting Measures in Predicting The Shareholder Return Evidence From Iran Stock Exchange. ARPN Journal of Science And Technology Vol.2, No. 5, pp.517-521. ISSN 2225-7217.
Niresh J., Aloy, Alfred M. 2014. The Association Between Economic Value Added, Market Value Added and Leverage. International Journal of Business and Management, Vol. 9, No. 10, pp. 126-133. ISSN 1833-3850. Canadian Center of Science and Education.
Gitman, Lawrence J., Chad J. Zutter. 2014. Principles of Managerial Finance 14th Edition. Boston: Person Education.
Gallagher, Timothy J, dan Joseph D. Andrew/ 2013. Financial Management Theory and Practice. USA: Thomas South Western
Brigham Eugene F. dan Joel F. Houston. 2013. Dasar-Dasar Manajemen Keuangan. Jakarta: Salemba Empat. Young, S. David, Stephen F. O’Byrne. 2013. EVA and Value-Based Management: A Practical Guide to Implementation. McGraw-Hill Education.
Tunggal, Amin Widjaja. 2015. Tanya Jawab Seputar Audit Internal. Jakarta: Harvarindo.
Silaban, Susi Nita. 2013. Pengaruh Economic Value Added (EVA), Market Value Added Terhadap Harga Saham Industri Pertambangan yang Terdaftar Pada Bursa Efek Indonesia Tahun 2007-2011. Tesis. Universitas Widyatama: Tidak diterbitkan.
Bakar, Abu. 2012. Analisis Perbandingan Kinerja Perusahaan Telekomunikasi dengan Menggunakan EVA, REVA, FVA, dan MVA.Jurnal Rekayasa LPPM Itenas Vol.10 No.4. Institut Teknologi Nasional
Nursalam. 2013. Metodologi Penelitian Ilmu Keperawatan: Pendekatan Praktis. Ediisi 3. Jakarta Sugiyono. 2016. Metode Penelitian Kuantitatif Kualitatif dan R&B. Bandung: Alfabeta.