Volume 3, Issue 2, 103 - 115.
ISSN: 2469-9632 http://www.ijem.com/Measuring Teachers’ Assessment for Learning (AfL) Classroom Practices
in Elementary Schools
Zita Lysaght
Dublin City University, IRELAND Michael O’Leary *
Dublin City University, IRELAND Boston College, USA Larry Ludlow
Received: October 16, 2017 ▪ Revised: December 10, 2017 ▪ Accepted: December 15, 2017
Abstract: Assessment for Learning (AfL) may be conceptualized as minute-to-minute, day-by-day interactions between learners and teachers with the improvement of learning as the principal focus. This paper traces the development of an AfL measurement instrument (scale) that can be used for research purposes prior to, during and following professional development in the area. Rasch measurement procedures were applied to data drawn from a convenience sample of 594 teachers from 44 elementary schools in Ireland to create a scale consisting of 20 items distributed across four key AfL assessment strategies: learning intentions and success criteria, questioning and classroom discussion, feedback, and peer-and self-assessment. This scale, the Assessment for Learning Measurement instrument (AfLMi), has good psychometric properties and is interpretable in a way that makes it potentially useful during system wide improvement initiatives focused on AfL.
Keywords: Assessment for learning measurement instrument, Rasch measurement Formative assessment, Teacher professional development.
To cite this article: Lysaght, Z., O’Leary, M., & Ludlow, L. (2017). Measuring teachers’ assessment for learning (afl) classroom practices in elementary schools. International Journal of Educational Methodology, 3(2), 103-115. https://doi.org/10.12973/ijem.3.2.103
Introduction
This paper documents the development of an instrument for use by educational researchers to measure teachers’ classroom practices before and after professional development in assessment for learning (AfL). Albeit some writers distinguish between the terms formative assessment and assessment for learning (e.g., Stiggins, 2005), this paper echoes the perspective of the Assessment Reform Group (ARG) in the UK (James, 2011) and the deliberations of the Third International Conference on Assessment for Learning (Klenowski, 2009) in using the terms interchangeably. As such, AfL refers to the minute-to-minute, day-by-day (Thompson & Goe, 2006) assessments, undertaken by teachers and learners, in which feedback is habitually sought and used to optimise learning.
Research Context: The Case for AfL Measurement Instruments
The evidence for AfL as a warranted strategy that impacts positively on student achievement has mounted over recent decades. The combined conclusions from reviews by Black and Wiliam (1998), Crooks (1988), Kluger and DeNisi (1996), Natriello (1987), and Nyquist (2003) of over 4,000 research studies over a forty-year period suggest strongly that, when implemented well, formative assessment can “effectively double the speed of student learning” (Wiliam, 2007, p. 36). A key finding of the 1998 seminal meta-review by Black and Wiliam of studies across different classroom settings (from five-year-olds to university graduates), in different countries and for different subject areas, was that formative assessment practices are associated with effect size gains ranging between 0.4 and 0.7. An effect size of 0.4 would mean that an average pupil taught by a teacher using high quality formative assessment would record the same score on a typical standardized test as another pupil in the top 35% whose teacher was not using high quality formative assessment.
This warranty notwithstanding, classroom-based research on the implementation of AfL underlines the fundamental challenges the approach presents for teachers and learners, not least because formative assessment pedagogy re-forms
*Corresponding Author:
the traditional teacher-student dialectic (Author, 2009). When “…evidence about student achievement is elicited, interpreted, and used by teachers, learners, or their peers…” (Black & Wiliam 2009, p. 9) in real time in the classroom - i.e., while instruction and learning is ongoing – the expectation is that students take increasing ownership for learning, enabled by the teacher who incrementally relinquishes control. Given the fundamental reconstitution of traditional classroom roles that self-regulated learning of this kind assumes, there have been sustained calls for systematic, high quality programmes of teacher professional development over the last decade (Black, 2010; Shute, 2007; Wylie, 2008; DeLuca, LaPointe-McEwan, & Luhanga, 2016) to help develop teacher assessment literacy. As Elmore (2000, p. 35) cautions, however, in the context of performance- and accountability-driven agendas nationally and internationally, teachers need to learn “… not just different ways of doing things, but very different ways of thinking about the purposes of their work, and the skills and knowledge that go with those purposes” (p. 35). Hence, amid repeated calls for more balanced assessment systems (Chappuis, Commodore, & Stiggins, 2017), there is a need to ensure that instruments are available to educators that serve both diagnostic, formative purposes on the one hand and quantitative, evaluative functions on the other. In response, Irish researchers initiated a research project in 2009 designed to help schools evaluate existing practices, identify needs and develop school improvement plans. Arising from this, and building on work from the UK (Association of Assessment Inspectors and Advisors [AAIA], Ireland (Author, 2009) and the US (Thompson & Wiliam, 2007), two evaluation instruments have been developed to-date – the assessment for learning audit instrument (AfLAi) and the assessment for learning measurement instrument (AfLMi).
The Assessment for Learning Audit Instrument (AfLAi)
Research work on the AfLAi was begun in January 2010 and completed in May 2013 (the reader is referred to Author (2013) for a comprehensive overview of the national studies undertaken during the development phases of the project). In sum, this work focused on developing separate, independent scales based on four, key, AfL strategies as outlined in the international literature on formative assessment (see, for example, Thompson & Goe, 2006; Wiliam, 2011). Fifty-eight statements (or items – the terms are used interchangeably in this paper) related to the strategies were categorized as follows:
(a) Learning Intentions and Success Criteria (LISC) -16 statements (b) Questioning and Classroom Discussion (QCD) - 16 statements (c) Feedback (FB) - 12 statements
(d) Peer- and Self-Assessment (PSA) - 14 statements.
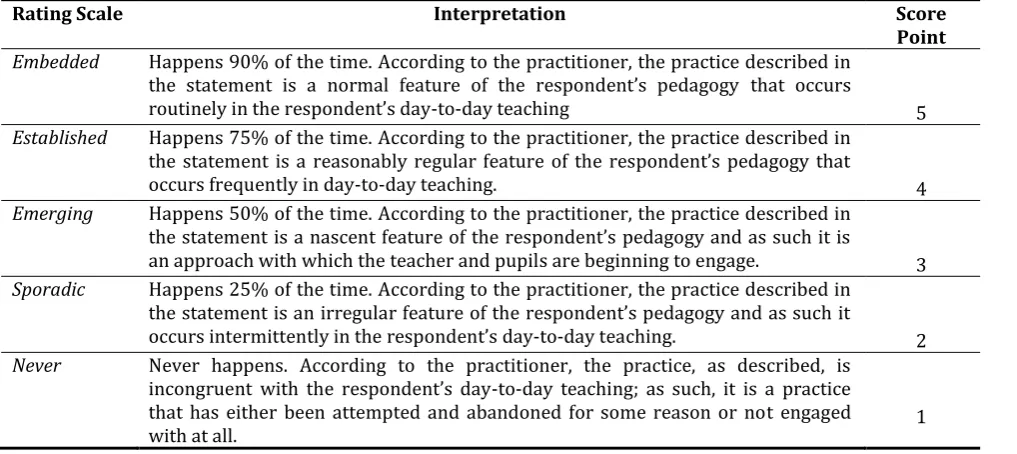
As shown in Table 1, teachers using the AfLAi were asked to rate the extent to which the 58 statements reflected their current teaching and learning practices in their classes by selecting one of a possible five responses. For quantitative analyses purposes, each of the scale points was given a numeric value from 5 (Embedded) to 1 (Never) as indicated in the third column of the table.
Table 1. The AfLAi Rating Scale
Rating Scale Interpretation Score
Point
Embedded Happens 90% of the time. According to the practitioner, the practice described in
the statement is a normal feature of the respondent’s pedagogy that occurs
routinely in the respondent’s day-to-day teaching 5
Established Happens 75% of the time. According to the practitioner, the practice described in
the statement is a reasonably regular feature of the respondent’s pedagogy that
occurs frequently in day-to-day teaching. 4
Emerging Happens 50% of the time. According to the practitioner, the practice described in
the statement is a nascent feature of the respondent’s pedagogy and as such it is
an approach with which the teacher and pupils are beginning to engage. 3
Sporadic Happens 25% of the time. According to the practitioner, the practice described in
the statement is an irregular feature of the respondent’s pedagogy and as such it occurs intermittently in the respondent’s day-to-day teaching.
2
Never Never happens. According to the practitioner, the practice, as described, is
incongruent with the respondent’s day-to-day teaching; as such, it is a practice that has either been attempted and abandoned for some reason or not engaged
with at all. 1
Analyses of the data from the original national study completed in 2013 (n= 476) indicated that each of the four scales was construct valid and highly reliable (Author, 2013). These scales are being maintained in their original form for professional development (rather than measurement) purposes with teachers. Currently, the AfLAi is being used by schools to evaluate base-line AfL competencies. While teachers may review their own individual audits, in most cases, all staff members of a school complete the audit and aggregate data are used to provide a school report containing average ratings for each of the statements in rank order by strategy. Schools then identify the extent to which various AfL strategies are embedded in classroom practice and begin to identify professional needs. A comprehensive overview of how the instrument can be used in an individual school to support teacher professional development is contained in Author (2017).
The Assessment for Learning Measurement Instrument (AfLMi)
The development of the AfL measurement instrument (AfLMi) extends the work undertaken as part of the first phase of the project as described above. The purpose of the follow up study reported in this paper is to utilize the original data and items from all four scales to create an efficient short-form measurement instrument that can be used when conducting system wide evaluations of interventions involving professional development in AfL (e.g. pre and post studies planned around a national policy initiative). In essence, the focus in the design of the AfLMi is on reducing the time it takes to complete the instrument while at the same time ensuring that it captures the key elements of AfL classroom practices. The distinction between the AfLAi and the AfLMi in terms of use is explicated further in the concluding section of the paper.
Sample
In the initial study, a purposive sample of 476 elementary school teachers across 36 schools in the Republic of Ireland was invited to complete the AfLAi. This was accomplished in two ways: invitations to take part were sent to schools via staff members who were known to the researchers and an invitation to take part was published in a popular teachers’ magazine (Author, 2010). The numbers of schools engaging in this process has steadily increased over time and in this paper we provide an updated analysis of the original data set to include the 118 teachers across 8 schools with whom we have collaborated over the past three years. Therefore, at this point the data for this study were drawn from a large convenience sample (n = 594) across 44 schools in Ireland.
Descriptive statistics reveals that the sample was fairly typical of the population of Irish elementary school teachers – the vast majority of respondents were female (85%) mainstream classroom teachers or teaching principals (70%) who were in early or mid-career (71%). About one third were special educators who provide supplementary teaching for students with special educational needs either within classes or on withdrawal bases. The schools involved, despite a Dublin geographical bias, were drawn from across the range of primary school types in Ireland – large/small, single/mixed sex, rural/urban, disadvantaged/non-disadvantaged. Roughly equal numbers of respondents taught at the different grade levels from Kindergarten to Sixth.
Method
The Rasch rating scale model (Andrich, 1978; Rasch, 1980; Wright & Masters, 1983), a form of Item Response Theory (IRT) model, was initially applied to the 58 item, four-scale AfLMi responses using the WINSTEPS software package (Wright & Linacre, 1998). The Rasch analysis converts raw scores into statistical estimates that correspond, in the case of the AfLMi, to i) an individual’s skill level related to implementing these classroom practices, ii) the difficulty of embedding each practice, and, iii) the difficulty of implementing each of the successively higher scored Likert response categories (threshold estimates). These three different types of scale location estimates are reported in a logit metric that generally ranges from +4 (for high scoring people and difficult items) to -4 (for low scoring people and easy items) (Author, 1995). The subsequent graphical representation of these location estimates along a continuum is referred to as a variable map (see Figure 1). The practical utility of the variable map is twofold. First, it operationally defines the construct of interest and serves as a clear empirical form of construct validity, and, second, a person’s location on the continuum defines his/her status at a point in time and serves as a baseline from which progress may be charted in the form of an intervention.
mid-range difficulty item from each scale. This process across the four scales yielded 12-items, based on statistical criteria alone, for the first iteration of generating a “best pick” for the AfLMi.
A new rating scale analysis was then conducted on these 12 items, and gaps and redundancies in the distribution of the 12-item locations along the now single-variable map continuum were noted. Content coverage was examined and some items were discarded as too weak in their content description. Items from the original four scales were then re-reviewed and selected for inclusion with a view to creating a relatively continuous and uniform distribution of item locations while maintaining roughly equal numbers of items across the four original scales. The resulting revised 12-item scale was then analyzed for its properties. This process of analysis, review, selection and re-analysis essentially following principles described in Wright and Stone (1979), went through multiple iterations until a statistically acceptable (“best pick”) uniform distribution of 12 items from across all four scales was found.
The next round of iterative improvement took into account qualitative judgments about specific items that would further enhance the content and construct validity of the scale. Most of the 12 items selected on statistical criteria alone were retained but now additional items were added and the rating scale analyses were re-run on an expanded set of 22 items. Two redundant items were removed and a final solution was accepted based on 20 items, five per AfL strategy. The 20-item AfLMi scale is presented in Table 2 with statements listed in the order that they appeared within the four strategies of the 58-item AfLAi published in Author (2013; 2017). To facilitate the tracking of items across the two instruments the original AfLAi item numbers are provided in brackets.
Table 2. The AfLMi Items/Statements
LISC1 (2). Learning intentions are stated using words that emphasise knowledge, skills, concepts and/or attitudes i.e., what the pupils are learning NOT what they are doing.
LISC2 (3). Pupils are reminded about the links between what they are learning and the big learning picture (e.g., “We
are learning to count money so that when we go shopping we can check our change”).
LISC3 (5). Child-friendly language is used to share learning intentions with pupils (e.g., “We are learning to make a good guess (prediction) about what is likely to happen next in the story”).
LISC4 (6). Success criteria related to learning intentions are differentiated and shared with pupils.
LISC5 (15). Pupils demonstrate that they are using learning intentions and/or success criteria while they are working (e.g., checking their progress against the learning intentions and success criteria for the lesson displayed on the blackboard or flipchart, for example).
QCD1 (2). Assessment techniques are used to facilitate class discussion (e.g., brainstorming). QCD2 (3). Questions are used to elicit pupils’ prior knowledge on a topic.
QCD3 (7). Pupils are encouraged to share the questioning role with the teacher during lessons (e.g., the teacher routinely invites pupils to question their peers’ contributions to discussions).
QCD4 (13). Pupils’ incorrect responses are used to guide teaching and learning (e.g., a pupil is asked to explain why
he/she gave a particular answer).
QCD5 (15). Pupils can explain to others what they are learning (e.g., if a visitor came to the classroom, pupils could articulate what they are learning in terms that identify the knowledge, skills, concepts and/or attitudes being developed).
FB1 (1). Feedback to pupils is focused on the original learning intention(s) and success criteria (e.g., “Today we are learning to use punctuation correctly in our writing and you used capital letters and full stop correctly in your story, well done John”).
FB2 (2). Assessment techniques are used during lessons to help the teacher determine how well pupils understand what is being taught (e.g., thumbs up-thumbs-down and/or two stars and a wish).
FB3 (6). Diagnostic information from standardised tests is used to identify strengths and needs in teaching and learning (e.g., common errors in the comprehension section of the MICRA-T are identified and used in teaching).
FB4 (7). Pupils are involved formally in providing information about their learning to their parents/guardians (e.g.,
portfolios or learning logs are taken home).
Table 2. Continued
PSA1 (1). Pupils are given an opportunity to indicate how challenging they anticipate the learning will be at the beginning of a lesson or activity (e.g., by using traffic lights).
PSA2 (2). Pupils are encouraged to record their progress using, for example, learning logs.
PSA3 (6). Pupils are encouraged to use a range of assessment techniques to review their own work (e.g., a rubric, traffic
lights, thumbs up/down, two stars and a wish).
PSA4 (7). A visual record of pupils’ progress is maintained to celebrate pupils’ learning and show areas of/for development (e.g., a bulletin board displaying progression in story writing over a term).
PSA5 (12). Time is set aside during parent/guardian-teacher meetings for pupils to be involved in reporting on some aspects of their learning (e.g., pupils select an example of their best work for discussion at the meeting).
Note: LISC = Learning intentions and success criteria; QCD = Questioning and classroom discussion;
FB = Feedback; PSA = Peer- and self-assessment.
Psychometric Properties of the AfLMi
A factor analysis was run on the 20-item AfLMi data set. The purpose of this analysis was to generate evidence for a single dominant AfL factor cutting across the four original scales. Principal axis factoring revealed the presence of one dominant factor with an eigenvalue of 6.1 (successive eigenvalues were 2.1, 1.2 and 1.2). The proportion of variance explained by this single factor was 27.7% (followed by 7.9%, 3.5% and 2.9%). Most items from each of the four strategies had Varimax rotated loadings of .5 or above on the dominant factor. The Cronbach reliability for this factor was .87. In addition, the Pearson correlations between the original four sets of scale scores from the AfLAi and the scale scores from the AfLMi were .85 for LISC, .82 for QDA, .86 for FB and .80 for PSA. This body of evidence supports the successful reduction of the 58-item multi scale instrument (AfLAi) down to a reduced-form 20-item single scale (AfLMi). We now address the extent to which this reduced-form instrument fits the Rasch model and is interpretable.
Model Fit
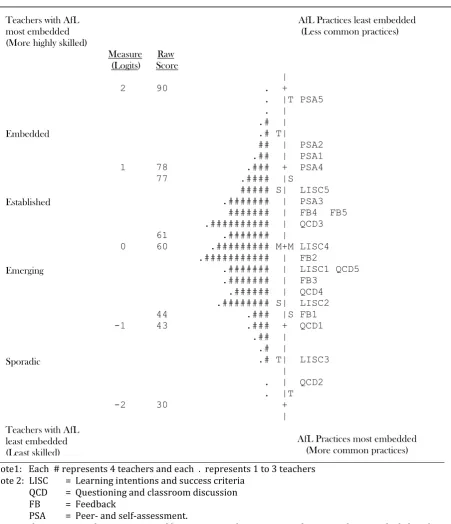
The Rasch rating scale variable map for the AfLMi is presented in Figure 1. It contains two distributions on a common logit or difficulty scale – one for the AfLMi items/statements (to the right of the vertical line) and one for the respondents/teachers (to the left of the vertical line). It is important to note that the scoring on this scale and the direction of interpretation is the same as the usual framework in that a high score is good and desired (as in an achievement scale). Furthermore, analogous to climbing a ladder, progress in terms of assessment practice is marked by movement up the scale whereby one engages in increasingly more sophisticated practices.
Note1: Each # represents 4 teachers and each . represents 1 to 3 teachers Note 2: LISC = Learning intentions and success criteria
QCD = Questioning and classroom discussion FB = Feedback
PSA = Peer- and self-assessment.
Note 3: The two Ms on the centre vertical line represent the mean score for respondents on the left and the mean difficulty of the statements on the right. The S and T letters represent the one and two standard deviation points respectively for candidates and items.
Figure 1. Variable Map for the AfLMi with Interpretation Framework
Scale Interpretation
The operational definition of the AfLMi construct should now be evident from Figure 1. Starting at the bottom of the AfLMi scale as it appears in this figure, we find easy to embed items that many teachers are likely to employ routinely, for example, QCD2: Questions are used to elicit pupils’ prior knowledge on a topic and LISC3: Child-friendly language is
used to share learning intentions with pupils. Moving up the scale (to the mid-range), we find more difficult to embed
items reflecting classroom practices that involve assessment being used in a more purposeful way, for example, LISC4:
Success criteria related to learning intentions are differentiated and shared with pupils, or practices that that involve students more fully in assessment, for example, QCD3: Pupils are encouraged to share the questioning role with the
Teachers with AfL most embedded (More highly skilled)
Embedded
Established
Emerging
Sporadic
Teachers with AfL least embedded
(Least skilled)
AfL Practices least embedded (Less common practices)
Measure Raw (Logits) Score
| 2 90 . +
. |T PSA5 . |
.# | .# T|
## | PSA2 .## | PSA1 1 78 .### + PSA4 77 .#### |S
##### S| LISC5 .####### | PSA3 ####### | FB4 FB5 .########## | QCD3 61 .####### |
0 60 .######### M+M LISC4 .########### | FB2
.####### | LISC1 QCD5 .####### | FB3
.###### | QCD4 .######## S| LISC2 44 .### |S FB1 -1 43 .### + QCD1 .## |
.# |
.# T| LISC3 |
. | QCD2 . |T -2 30 +
|
teacher during lessons. Finally, towards the top of the scale, are forms of assessment not typical in classrooms. These are practices that are the hardest to embed and reflect, for example, a willingness by teachers to involve pupils in self-assessment and to share responsibility for self-assessment with them, for example, LISC5: Pupils demonstrate that they are
using learning intentions and/or success criteria while they are working; and, PSA1: Pupils are given an opportunity to
indicate how challenging they anticipate the learning will be at the beginning of a lesson or activity. At the very top of the scale is PSA5: Time is set aside during parent/guardian-teacher meetings for pupils to be involved in reporting on some
aspects of their learning - an item that encapsulates the essence of deep student involvement in the assessment process.
It is particularly noteworthy that there is a discernible pattern to how items from the four sets of AfL strategies group together in the locations along the continuum. The PSA practices tend to be the most difficult to embed, the LISC and FB practices are grouped together in the mid-difficulty range, and most QCD practices are relatively well embedded and established. This ordering is consistent with theory and our own classroom experiences and observations in the Irish context. For example, in 2009, the tenth national assessments of Mathematics and English Reading were conducted in the Republic of Ireland on behalf of the Department of Education and Skills (DES, 2010). The study sampled almost 4,000, 6th class (senior elementary) and 4,000, 2nd class (junior elementary) pupils who completed tests in English Reading and Mathematics. Contextual information from questionnaires was gathered from schools, class teachers, parents and pupil groups. In presenting the outcomes of the work, the authors highlighted that although almost all of the teachers surveyed reported using teacher questioning as an assessment strategy:
…there was limited use of documented observations, of strategies that enable planning of instruction related to pupils’ learning needs (e.g., teacher-made checklists), of pupil-centered strategies (e.g., portfolio assessment), of reflective journals, or of pupil-self assessment. (p. 89)
Turning now to the interpretation of scores for the teachers we see that high scoring teachers are in the upper-left region of the map—they indicated that many of the assessment practices were established or embedded in their classrooms (i.e. they scored many 4s and 5s that then produced high logit scores). In contrast, teachers who did not use many AfL practices and did not embed many items responded with many 1s and 2s and are located in the lower-left region of the map.
Inspecting the distribution of teacher (and item) locations we note that, in general, the teachers score relatively well on the scale (acknowledging the well documented caveats in the literature on self-reporting of practice – e.g. Mayer, 1999). The “M” adjacent to the vertical line in Figure 1 corresponds to the mean teacher estimated location. This estimate is a transformation of the mean total score for the teachers (59.8). This score may be further transformed into a mean item response of 2.99 (59.8/20) on the 6 point scale of the AfLMi. Based on this average item response, it appears that teachers believe their use of these practices is roughly at an emerging level. Furthermore, there are relatively few teachers at such a high level that might be characterized as embedding most of these practices 90% of the time while there are also few teachers who appear to be at a level where they never use these practices. This distribution seems reasonable in a context where AfL is not an integral part of teaching and learning and it would be reasonable to expect that the distribution of scores would move upward after a successful professional development. Ideally, we desire teachers to score high on the AfLMi scale, i.e., receive many 4s and 5s because they embed most of these items. Hence, in terms of progress in professional development, the AfLMi can be used to track the professional development journey of teachers who may initially score low (don’t embed many tasks) on the scale and then, perhaps through an intervention, score higher as they begin to embed AfL practices in their teaching.
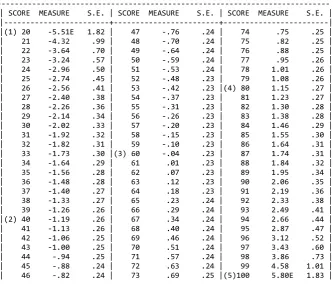
One simple way of doing this tracking is to obtain a teacher’s total score on the scale (i.e. sum the values for the twenty items), average it and determine where the teacher lies in terms of the rating scale used in Table 1. For example, say a teacher (Mr. Smith) had a total score of 53. This score equals an average item response of 2.7 (i.e., 53/20). This places the teacher in the area between 2 and 3 which corresponds to about half way between the sporadic and emerging
categories. In other words, AfL is an irregular/nascent feature of the respondent’s pedagogy and as such it is an approach with which the teacher and pupils are beginning to engage.
Table 3. Conversion of Total Raw Scores to Logit Scores
--- | SCORE MEASURE S.E. | SCORE MEASURE S.E. | SCORE MEASURE S.E. | |---+---+---| |(1) 20 -5.51E 1.82 | 47 -.76 .24 | 74 .75 .25 | | 21 -4.32 .99 | 48 -.70 .24 | 75 .82 .25 | | 22 -3.64 .70 | 49 -.64 .24 | 76 .88 .25 | | 23 -3.24 .57 | 50 -.59 .24 | 77 .95 .26 | | 24 -2.96 .50 | 51 -.53 .24 | 78 1.01 .26 | | 25 -2.74 .45 | 52 -.48 .23 | 79 1.08 .26 | | 26 -2.56 .41 | 53 -.42 .23 |(4) 80 1.15 .27 | | 27 -2.40 .38 | 54 -.37 .23 | 81 1.23 .27 | | 28 -2.26 .36 | 55 -.31 .23 | 82 1.30 .28 | | 29 -2.14 .34 | 56 -.26 .23 | 83 1.38 .28 | | 30 -2.02 .33 | 57 -.20 .23 | 84 1.46 .29 | | 31 -1.92 .32 | 58 -.15 .23 | 85 1.55 .30 | | 32 -1.82 .31 | 59 -.10 .23 | 86 1.64 .31 | | 33 -1.73 .30 |(3) 60 -.04 .23 | 87 1.74 .31 | | 34 -1.64 .29 | 61 .01 .23 | 88 1.84 .32 | | 35 -1.56 .28 | 62 .07 .23 | 89 1.95 .34 | | 36 -1.48 .28 | 63 .12 .23 | 90 2.06 .35 | | 37 -1.40 .27 | 64 .18 .23 | 91 2.19 .36 | | 38 -1.33 .27 | 65 .23 .24 | 92 2.33 .38 | | 39 -1.26 .26 | 66 .29 .24 | 93 2.49 .41 | |(2) 40 -1.19 .26 | 67 .34 .24 | 94 2.66 .44 | | 41 -1.13 .26 | 68 .40 .24 | 95 2.87 .47 | | 42 -1.06 .25 | 69 .46 .24 | 96 3.12 .52 | | 43 -1.00 .25 | 70 .51 .24 | 97 3.43 .60 | | 44 -.94 .25 | 71 .57 .24 | 98 3.86 .73 | | 45 -.88 .24 | 72 .63 .24 | 99 4.58 1.01 | | 46 -.82 .24 | 73 .69 .25 |(5)100 5.80E 1.83 | ---
Note: Each score (total raw score) may be converted to an average item response by taking the score and dividing by
20. For example, a total raw score of 60 equates to an average score of 3 (60/20) and this average corresponds to the
Emerging rating.
Table 4. Interpretation Framework for the AfLMi Variable Map
Embedded: Teachers with very high AfL skills/using AfL Practices very hard to embed Logit Values: ≥ 1 (se =.25 approx.)
Teacher Score: Average scale score* = ≥ 3.9; Total raw scale score = 78+
Description: AfL is likely to be a customary or firmly established feature of pedagogy and AfL occurs routinely in day-to-day teaching and learning. Teachers employ the full range of practices used by teachers with lower skill sets. However, their practice is distinguished by their incorporation of four additional techniques associated with the Peer- and Self-Assessment strategy - PSA5, PSA2 PSA 1 and PSA4.
Established: Teachers with high AfL skills/ using AfL Practices relatively hard to embed
Logit Values: > 0 to <1 (se = 0.25 approx.)
Teacher Score: Average scale score* = 3.05 – 3.89; Total raw scale score = 61 - 77
Description: AfL is likely to be a growing feature of pedagogy and as such it is an approach with which the teacher and pupils are beginning to engage more fully. Teachers with higher than average skills in AfL use a fuller range of techniques than those with lower skill sets. Additional techniques apparent at this level are LISC5, FB4, FB5 and QCD3 and one of the possible five techniques associated Peer-and Self-Assessment - PSA3.
Emerging: Teachers with average/low average AfL skills/using AfL Practices relatively easy to embed
Logit Values: 0 to >-1 (se = 0.25 approx.)
Teacher Score: Average scale score* = 2.2 – 3.00; Total raw scale score = 44- 60
Table 4. Continued
Sporadic: Teachers with very low skills in AfL/using AfL Practices very easy to embed
Logit Values: ≤ -1 (se = 0.3 approx.)
Teacher Score: Average scale score* = ≤ 2.15; Total raw scale score of 43 or less
Description: Most AfL practices are likely to be incongruent with day-to-day teaching; as such, they have been attempted and abandoned for some reason, not engaged with at all, or are foreign to the practitioner. Teachers with the lowest level of skills in AfL limit their use of this form of assessment to using child-friendly language when sharing learning intentions (LISC3) as well as two practices associated with Questioning and Classroom Discussion - QCD1 and QCD2. They do not engage with any of the Feedback and Peer- and Self-Assessment practices.
*Averages rounded
The cut points of ≥1, > 0 to <1, 0 to >-1 and ≤ -1 were selected with a view to obtaining level descriptors that made common sense interpretations possible rather than trying to satisfy more formal statistical criteria associated with various methods associated with setting performance standards (e.g., Cizek, Bunch & Koons, 2004). However, that said, it is noteworthy that the cut-points also occur close to the logit mean and standard deviation markers on the variable map. For the sake of coherence, the interpretation framework uses four of the five descriptors from the original rating scale used in the AfLAi - Embedded to Sporadic (the Never point is omitted).
This interpretation framework is also included with the variable map in Figure 1. In interpreting the variable map for the AfLMi, it is worth bearing in mind the distinction drawn in the literature by Marshall and Drummond (2006) between the spirit of AfL - defined as ‘high organization based on ideas’, where the underpinning principle is promoting pupil autonomy- and “…lessons where only the procedures, or ‘letter’ of AfL, seem in place (p. 137). From this perspective, the extent to which the pedagogical principle of promoting pupil autonomy and self-regulation (Perrenoud, 1998) becomes a reality in teaching and learning is influenced by a number of key factors including the degree of congruence between a teacher’s espoused theories of learning and his/her teaching practices which are typically borne out by examination of the nature and quality of his/her engagement and interaction with pupils.
Contrast this scenario with teachers of average or high average AfL skills who report incorporating a range of AfL techniques from each of the four AfL strategies. Depending on the degree to which these techniques are a normal part of everyday classroom practice, the incorporation of a broader range of techniques would suggest, at the very least, an emerging awareness of, and synergy between, their commitment to self-regulated, independent learning in their pupils evidenced, by the selection, sequencing and orchestration of learning opportunities and tasks in their day-to-day work.
It follows, then, that the teaching and learning practices of practitioners with the highest skills in AfL is distinguished by the inclusion of techniques that alter fundamentally the roles and responsibilities of teachers and pupils. Teachers at this level engage their pupils at every stage of their learning – from identifying learning intentions and success criteria (differentiated, as appropriate, in terms of content, process and product), through engagement with socially constructed learning tasks and activities, to sharing feedback to peer- and self-assess and identify next steps in learning. As noted by Thompson and Wiliam (2007, p. 5), in such classrooms “…where assessment is used with the primary function of supporting learning, the divide between instruction and assessment becomes blurred.” Hence, increasingly, these teachers’ practices become symbiotic with a relinquishing of power and control in favour of a less hierarchical, more distributed form of knowledge generation and regulation in which assessment serves divergent rather than convergent functions (Torrance & Pryor, 1998). In turn, this represents an incremental realignment between what Shepard (2000, p. 6) terms teachers’ “enduring and hidden beliefs” about traditional views of testing, teaching and learning and their evolving appreciation for AfL as “a teaching strategy of very high leverage” (Hargreaves, 2004, p. 24).
Conclusion
coalesced into a neo-liberal policy juggernaut…” (Gleeson, Sugrue & O’Flaherty, 2016, p. 19), the potential for rashly conceived policies based on PISA-envy (Thomson, Lingard, & Wrigley, 2012) and selective, decontextualized, policy borrowing (Ball, 2016) is also a reality.
Teachers are not immune to such global influences and, at the micro level of the school and classroom, teachers typically assume the role of local street-level bureaucrats (Hupe, Hill, & Buffat, 2016), managing “their difficult jobs by developing routines of practice (Lipky, 2010, p. xii). In contexts where existing formative practices are poor and teacher professional development opportunities inadequate, infrequent, or absent altogether, pressure to attend to standardized assessment as a core component of school self-evaluation has the potential to signal the death-knell for formative practices altogether. Indeed, as acknowledged (OECD, 2016, p. 96), tensions frequently present for schools and teachers who try to account for “their goals, strategy, decisions, performance and outcomes…” in the face of “…different, often mutually conflicting, interests, positions, perspectives and requirements of their stakeholders.”
The situation, as it presents, demands more than complementary vertical and horizontal systems of accountability at school level; both effective evaluation and improvement systems and, in turn, high quality teaching and learning in schools, require a broad range of well-conceived student assessments (OECD, 2013). Given the resistance to change of examination-oriented, high-stakes, national and international testing regimes (Apple, 2013; Birenbaum et al., 2015; Fullan, 2015), instruments of the kind described in this paper that are specifically designed to serve research and formative purposes, warrant close consideration.
As detailed, the construction of a 20-item AfL measurement instrument (AfLMi) from a 58-item AfL audit instrument (AfLAi) has resulted in the creation of two highly correlated (circa .8) instruments that serve different purposes. For a number of years now, the longer AfLAi tool has been used in Ireland and elsewhere† as a boundary object (Star, 1989) by diverse stakeholders (e.g., teachers, inspectors, researchers and policy makers) engaged in localised, design-based, implementation research into teacher professional development (see Author, 2017, for details). This work is part of a very deliberate attempt to re-conceptualise teacher professional development in AfL as a key component of a comprehensive system of assessment and evaluation (Bennett, 2011), responsive to the “reciprocal influences” (Opfer & Peddler, 2011, p. 276) of three interlocking subsystems: the teacher, the school and the learning activity. Employed in this way, the AfLAi provides useful data to multiple stakeholders whose educational interests and roles are complementary but diverse. For example, in addition to the diagnostic information it provides to participating teachers about the extent to which formative assessment practices are embedded in their daily teaching, it provides local schools’ inspectors with insight into how national evaluation and assessment policies are being interpreted and implemented at local levels.
The AfLMi, on the other hand, is constructed to capture data on just 20 key classroom assessment practices, and, as a consequence, to be more efficient than the AfLAi in terms of the time it takes to be administered. Moreover, it is intended for use beyond individual schools and by researchers employing experimental and mixed-methods designs to investigate the efficacy of system wide intervention studies in formative assessment that include teacher professional development as a key component. Given the comprehensive account of the development of the AfLMi in this paper, our hope is that researchers will be encouraged to use the instrument with confidence and, over time, to provide evidence of its usefulness in different contexts.
References
Andrich, D. (1978). A rating formulation for ordered response categories. Psychometrika, 43, 561-573.
Apple, M. W. (2012). Education and power(Revised Routledge Classic ed.). New York, NY: Routledge.
Ball, S. J. (2016). Neoliberal education? Confronting the slouching beast. Policy Futures in Education. [on-line] available
http://pfe.sagepub.com/content/early/2016/08/22/1478210316664259.abstract
Bennett, R. E. (2011). Formative assessment: a critical review. Assessment in Education: Principles, Policy and Practice, 18(1), 5-25.
Burns, T., & Koster, F. (Eds). (2016). Governing education in a complex world. Paris: OECD Publishing.
Birenbaum, M., DeLuca, C., Earl, L., Heritage, M., Klenowski, V., Looney, A., & Wyatt-Smith, C. (2015). International trends in the implementation of assessment for learning: Implications for policy and practice. Policy Futures in
Education, 13(1), 117-140.
Black, P. (2010). Keynote address to the Cambridge Assessment Conference. [on-line] available
http://www.policyreview.tv/video/501/2500
Black, P., & Wiliam, D. (1998). Assessment and classroom learning. Assessment in Education: Principles, Policy & Practice,
5(1), 7-74.
Black, P., & Wiliam, D. (2009). Developing the theory of formative assessment. Educational Assessment Evaluation and Accountability 21, 5-31.
Chappuis, S., Commodore, C., & Stiggins, R. (2017). Balanced assessment systems: Leadership, quality, and the role of
classroom assessment. Thousand Oaks, CA: Corwin Press.
Cizek, G. J., Bunch, M. B., & Koons, H (2004). Setting performance standards: Contemporary methods. Educational Measurement Issues and Practice, 23(4), 31–50.
Crooks, T. J. (1988). The impact of classroom evaluation practices on students. Review of Educational Research, 58, 438-481.
DeLuca, C., LaPointe-McEwan, D., & Luhanga, U. (2016). Teacher assessment literacy: What is it and how do we measure
it? Educational Assessment, Evaluation, and Accountability, 28, 251–272.
Department of Education and Skills (DES). (2010). The 2009 national assessments of mathematics and reading. [on-line] available http://www.erc.ie/
Darling-Hammond, L. (2017). Teacher education around the world: What can we learning from international practice?
European Journal of Teacher Education.http://dx.doi.org/10.1080/02619768.2017.1315399
Fullan, M. (2015). Leadership from the middle: A system strategy. [on-line] available
https://michaelfullan.ca/wp-content/uploads/2015/12/LeadershipfromtheMiddle_EdCan_v55no4.pdf
Gleeson, M., Sugrue, C., & O’Flaherty, J. (2017). Research capacity and initial teacher education reform: Irish
experiences, international perspectives. Teaching and Teacher Education,62, 19-29.
Hargreaves, D. (2004). Personalising learning—2: student voice and assessment for learning. London: SST.
Hooge, E. (2016). Making multiple school accountability work. In T. Burns, & F. Koster (Eds.), Governing education in a
complex world (pp. 93-112 ). Paris: OECD Publishing.
Hupe, P., Hill, M., & Buffat, A. (2016). (Eds.). Understanding street-level bureaucracy. UK: Policy Press.
James, M. (2011). Assessment for learning: Research and policy in the (dis) United Kingdom. In R. Berry, & B. Adamson, (Eds.), Assessment reform in education. Policy and practice (pp. 15-32). London: Springer.
Klenowski, V. (2009). Assessment for learning revisited: An Asia-Pacific perspective. Assessment in Education: Principles, Policy and Practice16(3), 263–268.
Kluger, A. N., & DeNisi, A. (1996). The effects of feedback interventions on performance: A historical review, a meta-analysis, and a preliminary feedback intervention theory. Psychological Bulletin, 119(2), 254-284.
Ludlow, L.H., & Haley, S.M. (1995). Rasch model logits: Interpretation, use, and transformation. Educational and
Psychological Measurement, 55, 967-975.
Lysaght, Z. (2010). Assessment for learning and teacher learning communities: Warranted strategies worthy of consideration. InTouch, 112, 49-51.
Lysaght, Z., & O’Leary, M. (2013). An instrument to audit teachers’ use of assessment for learning. Irish Educational
Studies, 32(2). doi: 10.1080/03323315.2013.784636.
Lysaght, Z., & O’Leary, M. (2017). Scaling up, writ small: using an assessment for learning audit instrument to stimulate site-based professional development, one school at a time. Assessment in Education: Principles, Policy and Practice, 24(2), 271-289.
Mayer, D. (1999). Measuring instructional practice: Can policymakers trust survey data? Educational Evaluation and Policy Analysis, 21(1), 29-45.
Marshall, B., & Drummond, M. J. (2006). How teachers engage in assessment for learning: Lessons from the classroom.
Research in Education, 21(2), 133-149.
Natriello, G. (1987). The impact of evaluation processes on students. Educational Psychologist, 2(2), 155-175.
Nyquist, J. B. (2003). The benefits of reconstructing feedback as a larger system of formative assessment: A meta-analysis.
Unpublished master’s thesis, Vanderbilt University, Nashville, TN.
Opfer, V.D. (2011). Conceptualizing teacher professional development. Review of Educational Research, 81(3),
376-407.
Perrenoud, P. (1998). From formative evaluation to a controlled regulation of learning processes. Towards a wider
conceptual field. Assessment in Education: Principles, Policy and Practice, 5(1), 85–102.
Rasch, G. (1980). Probabilistic models for some intelligence and attainment tests. Chicago, IL: University of Chicago Press. (Original work published 1960).
Shepard, L. (2000). The role of assessment in a learning culture. Educational Researcher 29(7), 4-14.
Shute, V. J. (2007). Focus on formative feedback. Princeton, NJ: ETS.
Stiggins, R. J. (2005). From formative assessment to assessment FOR learning: A path to success in standards-based schools. Phi Delta Kappan, 87(4), 324-328.
Star, S. L. (1989). The structure of ill-structured solutions: Boundary objects and heterogeneous distributed problem solving. In L. Gasser, and M. N. Huhns (Eds.), Distributed artificial intelligence Volume 3 (pp. 37-54). UK: Morgan Kaufmann Publishers Inc.
Thompson, M., & Goe, L. (2006). Models for effective and scalable teacher professional development. Paper presented at the annual meeting of the American Educational Research Association. San Francisco, CA.
Thompson, M., & Wiliam, D. (2007). Tight but loose: A conceptual framework for scaling up school reforms. Paper presented at the annual meeting of the American Educational Research Association. Chicago, IL.
Thomson, P., Lingard, B., & Wrigley, T. (2012). Ideas for changing educational systems, educational policy and schools.
Critical Studies in Education, 53(1), 1-7.
Torrance, H., & Pryor, J. (1998). Investigating Formative Assessment: teaching, learning and assessment in the classroom.
Philadelphia, PA: Open University Press.
Wiliam, D. (2007). Five "key strategies" for effective formative assessment. Reston, VA. National Council of Teachers of Mathematics.
Wright, B. D., & Linacre, M. (1998). WINSTEPS. Chicago: MESA Press.
Wright, B. D., & Stone, M. (1979). Best test design. Chicago: MESA Press.