IJEDR1802011
International Journal of Engineering Development and Research (www.ijedr.org)
60
Experimental Study on Strengthening of RCC Slab
by using CFRP & GFRP Sheets
Mohd. Abdul Rehman1, Subodhkumar V.Dhoke2, Snehal R.Shirbhate3 1Assitant Professor, 2Assistant Professor, 3Assistant Professor
1Department of Civil Engineering
P.R.Pote (Patil) College of Engineering & Management, Amravati, Maharashtra, India
_____________________________________________________________________________________________________
Abstract - This paper presents a experimental study on performance of reinforced concrete slab under a central point load with respect to yield load, flexural strength and deflection by using CFRP & GFRP sheets. For that ,three slab panels were casted with same size and reinforcement. Except one other two panels were strengthened by CFRP & GFRP sheets. All three panels were tested under a central point load, load were applied up to the failure of specimens. The crack pattern was recorded & deflection was observed at failure load. The behavior of different slabs was compared to find the efficiency of method used. Test results showed that strengthening elements are effective to increase the strength characteristics of reinforced concrete slab.
Index Terms - CFRP Sheets, Deflection, Flexural Strength, GFRP Sheets, Loads
_____________________________________________________________________________________________________
1. INTRODUCTION
1.1 Introduction
There is no doubt that the problem of cracked concrete structures has become one of the most pressing problems that must join hands in efforts to reach a solution before cracks appear in structure. Some of concrete structures that were built in the past years were inadequate to carry service loads. This insufficient load carrying capacity has resulted from poor maintenance, increasing in legal load limit, insufficient reinforcement, excessive deflections, structural damages or steel corrosion, which leads to cracks. Repair, retrofitting and rehabilitation of existing concrete structures have become a large part of the construction activity; also the money spent on retrofitting of existing structures in recent years has exceeded that spent on new structures due to using traditional techniques. The restoration, strengthening and retrofitting of concrete are work of treatment adjustments to the structural elements (such as foundations, columns, beams and slabs) so that beams are recorded soundness values in strengthening and retrofitting by using FRP in the worst case of loading such as cyclic loads .
Therefore, the problem was handled and studied by testing three reinforced slabs specimen strengthened using two different techniques to judge the effectiveness in enhancing the behavior of the strengthened slab in addition to specimen. One of the important structural element is slab which may crack due to overloading change of building function, or fabrications errors. This project was focused on studying two of the most popular innovative slab strengthening technique, GFRP (Glass fiber reinforced polymer) sheet, and CFRP (Carbon fiber reinforced polymer) sheet.
1.2 Historical Brief
First developed in the mid 1930, Glass Fiber Reinforced Polymer (GFRP) has become a staple in the building industry. Originally used for the construction of parts, the architectural advantages of GFRP were inadvertently discovered in 1967. It was at that point that the possibilities of GFRP were recognized and its use began to increase. By 1994, nearly 600 million pounds of composite materials had been used by the building industry.In today date the use of GFRP and CFRP sheets have been used in Japan in the construction of Bridge. The structural members such as piers of bridge and on the deck slab these sheets have been installed. Also members such as columns, slabs, beams these sheets are used.
1.3 Types Sheets
1.3.1. Glass Fiber Reinforced Polymer Sheet (GFRP)
Fig.1: Glass fiber reinforced polymer sheet
IJEDR1802011
International Journal of Engineering Development and Research (www.ijedr.org)
61
reinforcing agent for many polymer products to form a very strong and relatively light weight fiber reinforced polymer (FRP) composite material called Glass reinforced plastic (GRP).Types :- E - glass, A - glass, S - glass, R - glass, T - glass, C - glass. Costing:- 2700 /- per sq. meter according to present market valuation. Properties :
High strength:- GFRP has very high strength to weight ratio.
Light weight:- Low weight of the sheet which leads to faster installation, less structural framing, and lower shipping costs. Resistant to Salt water, Chemicals, and Environment:- FRP is unaffected by acid rain, salts, and most chemicals.
Seamless construction:- Dome and cupola sections can be resined together to form a single watertight structure. Can be molded into Complex shapes:- Virtually any shape or texture can be produced.
Low maintenance:- Research shows no loss of laminate properties in GFRP after 30 years, with minimum maintenance. Durability:- As GFRP has high strength property and also to resist the chemical attack it has high durability.
Beauty:- GFRP meets the needs according to architectural requirement as Bronze, wood, stone, iron, and coral can all be replicated using more durable GFRP.
Composition:- GFRP is an engineered material composed of a polyester or epoxy resin, reinforced with glass fibers. Uses / Applications :-
• Glass fiber reinforced polymer Rebar can be used instead of steel bar shows promise in the area for avoidance of steel corrosion.
• Glass fiber reinforced polymer can also be used for making tanks and vessels.
• Glass fiber includes mats and fabrics for thermal insulation, electrical insulation, sound insulation, high strength and corrosion resistant.
• Glass fiber reinforced polymer can also be used in medical purpose for making casts. 1.3.2. Carbon Fiber Reinforced Polymer Sheet (CFRP)
Fig. 2: Different Texture of GFRP sheet Fig.3: Carbon Fiber Reinforced Polymer Sheet
Materials /Formation:- Carbon fiber reinforced polymer is an extremely strong and light weight fiber reinforced plastics which contains carbon fibers. CFRP can be expensive to produce but are commonly used wherever high strength to weight ratio and rigidity are required, such as civil engineering, aerospace, automotive, sports goods, and an increasing number of increasing
Properties:
High strength:- CFRP has very high strength to weight ratio.
Light weight:- Low weight of the sheet which leads to faster installation, less structural framing, and lower shipping costs. Resistant to Salt water, Chemicals, and Environment:- FRP is unaffected by acid rain, salts, and most chemicals.
Low maintenance:- Research shows no loss of laminate properties in CFRP after 30 years, with minimum maintenance. Durability:- As CFRP has high strength property and also to resist the chemical attack it has high durability.
Composition:- CFRP is an engineered material composed of a matrix and reinforced with carbon fibers. Tensile strength:- Ultimate tensile strength of carbon fiber is high.
Costing:- 3800 /- per sq. meter as per present market valuation. Uses / Application:-
• CFRP is used in deck slab of the bridge to increase the strength of the structure. • It can be also used in the piers of the bridge to resist the seismic waves.
• To increase the shear strength of reinforced concrete by wrapping fabrics or fibers around the section to be strengthened.
• CFRP can be used as pre- stressing materials due to their high strength.
2. MATERIALS AND METHODS
2.1 Description
IJEDR1802011
International Journal of Engineering Development and Research (www.ijedr.org)
62
Concrete dimensions for RC slabs are 140 mm thickness, 1000 mm length and 500 mm width. All slabs were reinforced with 3Y12, 6Y10 main reinforcement mesh in longitudinal and short direction, respectively, Fig. 6 Specimen’s form work. Were prepared to match the proposed specimen’s dimensions. Table 1 shows concrete mix design proportions which were estimated according to Indian standard to obtain concrete mix with compressive strength equals 25 MPa. The mixing process of fresh concrete was made hand mixing. Specimens were compacted in a way to produce full compaction as much as possible by using the standard tamping rod. Finally, specimens were levelled at top to get smooth concrete surface as seen in Figure 7.
Fig. 6: Shape of Form work with reinforcement Fig.7: Conventional slab
Fig. 8: Slab Panel using CFRP/GFRP Sheet
2.2.1 Strengthening of Specimens
Table 1: Concrete Mix Design Quantity
Coarse Aggregate
kg/m3
Fine Aggregate
kg/m3
Cement kg/m3
Water kg/m3
1148.4 737.96 372 186
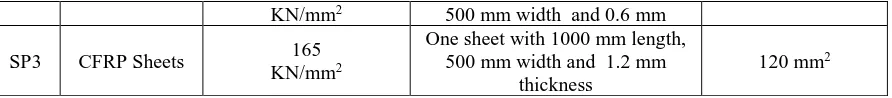
The strengthening of RC slabs was made following the traditional procedure. Firstly, Slab surface were roughened to ensure good bond between repairing materials and concrete surface. GFRP sheets which were tailored to dimensions of 1000 mm length, 500 mm width and 1.17 mm thickness. Suitable resin was used to glue GFRP sheets on concrete surface. The second specimen was strengthened using carbon fiber laminate sheet of dimensions 1000 mm length, 500 mm width and 1.2 mm thickness. Suitable epoxy adhesive was used to bond sheets on concrete surface as shown in Figure 8. Table 2 shows the details of strengthening system used for each specimen. It should be noted that, the amount of strengthening materials was selected based on the relative cross-sectional areas and the material strengths in a way to achieve the same potential capacity.
Table 2: Details of Specimens
Slab Panel
Strengthening Technique
Young’s Modulus of Repairing Material
Details of Repairing material for Strengthening
Added Area of Repairing material
SP1
Nominal Slab panel under Q
Control
Non Non Non
IJEDR1802011
International Journal of Engineering Development and Research (www.ijedr.org)
63
KN/mm2 500 mm width and 0.6 mmSP3 CFRP Sheets 165
KN/mm2
One sheet with 1000 mm length, 500 mm width and 1.2 mm
thickness
120 mm2
2.3 Concrete material:
Concrete is a building material that has high compressive strength and low tensile strength and is composed of a mixture of cement gravel and water. Reinforced concrete is the same material matrix combined with reinforcing steel or wire mesh to provide tensile strength properties that allow for the construction of beam, column, and slab.
2.4 Mix Design calculation
Mix Design for M25 Grade of Concrete (As per IS 10262-2009 and 456-2000)
1. Grade of concrete – M25 2. Cement type – OPC 53 grade 3. Size of Aggregate – 20 mm 4. Maximum W/C ratio – 0.5
5. Method of concrete placing – Manually
6. Explore condition – Mild (As per table 3&5 IS 456-2000)
7. Max temperature at time of placing – Normal atmospheric temperature 8. Workability medium – Medium (As per IS 456-2000)
9. Degree of supervision – Good
Data taken from conducting test (Archimedes’ Principle) 1. Specific gravity of coarse aggregate – 2.75 2. Specific gravity of fine aggregate – 2.65 3. Specific gravity of Cement – 3.15 • Target strength of mix proportion = 25+1.64×4
= 31.6 N/sq.mm
(Standard deviation taken as 4 table 1, IS 10262 for mild condition)
• Selection of water cement ratio as per IS 456-2000 table 5 maximum water cement ratio is 0.5 • Selection of water content = 186 kg/m3
• Manipulation of cement content
= 0.5
= 0.5 Cement = 372 kg/m3
(As per IS 456-2000 Table 5 for mild condition min cement content is 300 kg/m3) • Proportion of volume of coarse aggregate to fine aggregate to fine aggregate
According to IS-383 (Proposed fine aggregate are under zone type 1) and (IS-10262 table 3) Volume of coarse Aggregate = 0.60
Volume of fine Aggregate = 1- 0.60 = 0.40
2.4.1 Mix Calculation:
A. Volume of Concrete = 1m3
B. Volume of Cement = × = × = 0.118 m3
C. Volume of Water = × = × = 186 kg/m3
D. Volume of all in Aggregate = (A-(B+C)) = (1-(0.118+0.1861)) = 0.896 m3
E. Mass of coarse Aggregate = Volume of all in aggregate× Volume of coarse aggregate× Sp.gravity of course Agg.
= 0.896 × 0.60 × 2.75 × 1000 = 1148.4 kg/m3
F. Mass of fine aggregate = Volume of all in Aggregate × Vol.of fine aggregate × Specific gravity of fine aggregate × 1000
= 0.869 × 0.40 × 2.65 × 1000 = 737.76 kg
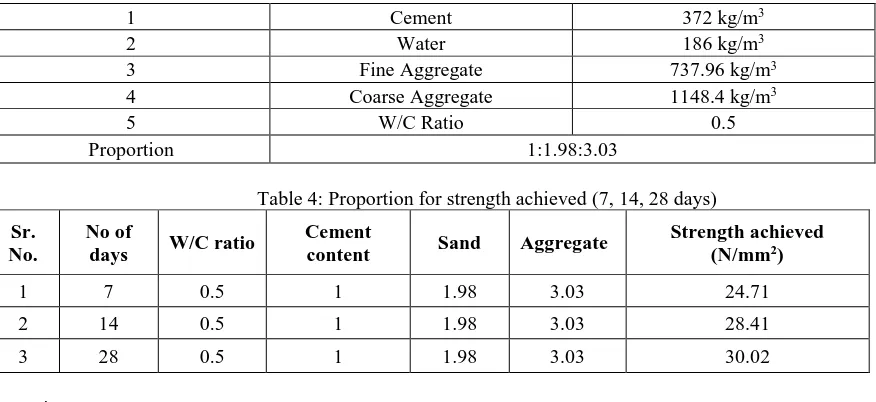
Table 3: Mix Design Summary
IJEDR1802011
International Journal of Engineering Development and Research (www.ijedr.org)
64
1 Cement 372 kg/m3
2 Water 186 kg/m3
3 Fine Aggregate 737.96 kg/m3
4 Coarse Aggregate 1148.4 kg/m3
5 W/C Ratio 0.5
Proportion 1:1.98:3.03
Table 4: Proportion for strength achieved (7, 14, 28 days)
Sr. No.
No of
days W/C ratio
Cement
content Sand Aggregate
Strength achieved (N/mm2)
1 7 0.5 1 1.98 3.03 24.71
2 14 0.5 1 1.98 3.03 28.41
3 28 0.5 1 1.98 3.03 30.02
2.5 Testing:
2.5.1 Universal testing machine
A Universal testing machine (UTM) also known as a universal tester, materials testing machine or material test frame is used to test the tensile strength and compressive strength of material. The “Universal” part of the name reflects that it can perform many standard tensile and compression test on materials, components and structures (in other words that is it is versatile).
2.5.2 Placing of slab
RC Slab placed under the UTM having load carrying capacity 1000 KN. The dimensions of slab was1000 X 500 X 140 mm. placing the two girders below the slab at a distance of 250 mm C/C from both sides of slab lengthwise. For checking the flexural strength we applied point load at a distance 250 mm C/C from both sides of the girders.
2.5.3 Flexural strength
Flexural strength also known as modulus of rupture, or bend strength or transverse rupture strength is a material property defined as the stress in a material just before it yields in a flexure test. The transverse bending test is most frequently employed. The flexural strength represents the highest stress experienced within the material at its moment of yield. It is measured in terms of stress given by the symbol (sigma).
.
Where, F = Load at the fracture point L = Length of the support span b = Width, d = thickness 2.5.4 Deflection
After the application of applying of point load the slab was able to bear certain amount of load at various stages. For measuring the deflection in slab two dial gauges was used at the bottom. After bearing certain amount load the slab get cracked and the deflection was measured with the help of dial gauges which were provided at the bottom of slab.
Fig. 9: Deflection observed
3. RESULT ANALYSIS
3.1 Introduction
For over 20 years, FRP (Fiber Reinforced Polymer) has been tried to put in practice as reinforcing materials for infrastructures such as bridges. This is because FRP is not only lightweight and high strength material, but also highly durable material.FRP sheets and strips were developed next for repairing and strengthening of existing concrete structures.
The following parameters are studied and compared between the three specimen in order to determine the strengthen capacity of three slab.
IJEDR1802011
International Journal of Engineering Development and Research (www.ijedr.org)
65
3) Ultimate moment carrying capacity4) Maximum deflection at center
Failure patterns due to application of point load on specimens, it shows certain patterns of yield load and ultimate load. Yield crack:- The crack which are begin to occur initially, when the section just star to fail plastically are known as yield crack. The pattern for all the specimens are shown in fig.
3.2. Result of yield crack :The observed yield load carried by specimens are given in table 5.
Table 5: Yield load for specimen
Sr. No Type of
specimen Yield load(kN)
1. Specimen 1 128.64
2. Specimen 2 181.44
3. Specimen 3 151.89
128.64 181.44 151.89 0
100 200
slab panel
Lo
ad
(
kN)
Yield Load (kN)
specimen 1 specimen 2 specimen 3
Graph 1: Comparison of yield load
The first minor crack on specimen 1:- conventional RC slab, specimen 2:- RC slab using GFRC sheet, specimen 2:- RC slab using CFRP at yield load 128.64kN, 181.44kN and 151.89kN respectively these are the yield cracks. From the graph 4.1 it was observed that the yield load carrying capacity of specimen 2:- RC slab using GFRP sheet is 29% greater than the conventional RC slab and also specimen 3:- RC slab using CFRP sheet is 16% greater than the conventional RC Slab.
3.3. Result of ultimate load
The observed ultimate load carried by specimen is given below in table 6.
Table 6: Ultimate load for specimen Sr.
No Type of specimen
Ultimate load (kN)
1 Specimen 1 192
2 Specimen 2 252
3 Specimen 3 249
192 252 249 0
200 400
slab panel
Lo
ad
(k
N)
Ultimate Load (kN)
specimen 1 speciman 2 specimen 3
Graph 2: Comparison of ultimate load.
It is noted that the ultimate load carrying capacity of specimen 2:-RC slab using GFRP sheet is greater than the specimen 1:- RC conventional slab and also ultimate load carrying capacity of specimen 3:- RC slab using CFRP sheet is greater than the specimen 1:- RC conventional slab. From graph 4.2 it was observed that ultimate load carrying capacity of specimen 2:- RC slab using GFRP sheet is 23.80% more and specimen 2:- RC slab using CFRP sheet is 22.89% more than the specimen 1:- RC conventional slab.
3.4. Result of maximum bending moment.
IJEDR1802011
International Journal of Engineering Development and Research (www.ijedr.org)
66
Table 7:The maximum BM of specimens corresponding to the maximum Ultimate load.Sr. No Type of specimen Ultimate load (kN) Maximum Bending moment (kN-m)
1 Specimen 1 192 23.59
2 Specimen2 252 30.24
3 Specimen 3 249 25.80
From the graph 3 it was observed that the maximum moment carrying capacity of specimen 2:- RC slab using GFRP sheet is 23.80% more and specimen 2:- RC slab using CFRP sheet is 22.89% more than the specimen 1:- RC conventional slab.
23.59
30.24
25.8
0 50
slab panal
B
en
d
in
g
M
o
m
en
t
Maximum Bending
Moment
specimen 1 specimen 2 specimen 3
Graph 3: Comparison of maximum bending moment 3.5 Result of maximum central deflection
The encountered maximum central deflections of all specimens measured by using dial gauge are represented in table 8. Table 8: Maximum central deflection for specimen
Sr. No Type of specimen
Ultimate load (kN)
Maximum deflection
(mm)
1 Specimen 1 192 15.2
2 Specimen 2 252 16.45
3 Specimen 3 249 16.1
15.2
16.45
16.1
14 15 16 17
slab panal
d
efl
ecti
o
n
(
m
m
)
Deflection (mm)
specimen 1 specimen 2 specimen 3
Graph 4: Comparison of maximum deflection.
From the graph 4 it was observed that among the three specimen the highest deflection was observed in GFRP sheet using specimen i.e. 16.45 mm at ultimate loading of 252 kN and minimum deflection noted in conventional slab as 15.2 mm. 3.6 load v/s deflection curve
Deflection is the degree to which a structural element is displaced under load. The deflection in member are plotted against loading at which they occur to establish a load defection curve. Following are the results of central deflection observed at 20 kN loading interval in table 9.
IJEDR1802011
International Journal of Engineering Development and Research (www.ijedr.org)
67
Load applied
(kN)
Central deflection (mm)
Slab Panel using GFRP Specimen 1
Slab Panel using CFRP Specimen 2
Conventional Slab Panel Specimen 3
0 0 0 0
25 3.40 2.70 2.85
50 4.50 3.25 3.60
75 7.90 7.06 7.55
100 10.5 10.35 11.00
125 11.20 10.70 12.78
150 14.73 11.1 13.50
175 15.10 11.75 14.89
192 15.20 1.20 15.10
200 - 15.15 15.72
225 - 15.47 15.72
249 - 15.90 16.1
250 - 16.40 -
252 - 16.45 -
0 2 4 6 8 10 12 14 16 18
0 100 200 300
de
flect
io
n
(m
m
)
load (kN)
Graph 5: Comparison of deflection v/load
0
128.64
192
0
181.44
252
0
151.89
249
0 50 100 150 200 250 300
initial stage yield stage ultimate stage
LO
A
D
Load At Different Stages
conventional slab GFRP CFRP
Graph 6: Load at different stages 3.7 Discussion
IJEDR1802011
International Journal of Engineering Development and Research (www.ijedr.org)
68
failed at the load of 252 KN with central deflection of 16.45 mm. For CFRP sheet first crack was observed at load of 151.89 KN and the specimen completely failed at 249 KN load with central deflection of 16.1 mm.From the above discussion we come to know that conventional slab with GFRP and CFRP SHEET has the maximum load carrying capacity then other slab.
Table 10: Percentage difference in ultimate load and deflection
Specimen type Maximum load % difference in load
Maximum deflection
% difference in the deflection
Specimen 1 Conventional
Slab Panel
192 _ 15.2 _
Specimen 2 Slab Panel with
GFRP
252 31.25 16.45 8.22
Specimen 3 Slab Panel with
CFRP
249 29.68 16.1 5.92
4. CONCLUSION
In this research, experimental study was carried out on the all reinforced concrete slab specimens constructed. Three precast RC Slab panel specimen having the significant dimensions was constructed to compare the various parameters among them. All the precast RC Slab specimen are first design by using own specifications and doing calculations as per Indian standards. Then all specimens were tested under a central point load by Universal Testing Machine (UTM). The objective of this experimental study is to check whether the designed precast specimens are satisfying flexural strength. From the test parameters are compared with conventionally casted slab specimen results. Encountered observations are found satisfactory with respect to evaluate the designed precast Slabs. It was observed that the failure of precast RC slab specimen installed with GFRP sheet has the highest flexural strength than precast RC slab specimen installed with CFRP sheet and normal precast RC slab. In order to get more economic and satisfying results further research may be carried out for different types of designed RC Slab specimen for different loading conditions.
REFERENCES
[1] C. Selin Ravikumar and T.S. Tandav Amuoorthy: Application of FRP for strengthening and retrofitting of civil engineering structured”. International journal of civil, structural engineering, ISSN: 2249-6866 Volume 4, 1 feb 2014.
[2] R. Pravinkumar, A. Chiranjeevi, A. Kowshikan, M. Dineshmaruthu, Chirag A. Patel: “Flexural behavior of RC beam with hybrid FRP strengthening”. International journal of innovative research in science
EngineeringISSN: 2319-8753(online), 2347-6750(print) Volume 6, 3 march 2007.
[3] Akira Kobayashi, YuyaHidekuma and Makoto Saito: “Application of the FRP for construction as high durable materials in japan”. Lifecycle assessment of sustainable infrastructure material scarpo, japan. Oct 21- 22, 2009.
[4] Vineet Sharma, Yudhvir Yadav: “A review of application of GFRP in shear and flexure to strengthened the reinforced concrete beam”. International journal of scientific research and management (IJSRM) Volume 4, ISSN 2321-3418, 2016.