818 | P a g e
VALUE STREAM MAPPING: POWERFUL TOOL FOR
LEAN MANUFACTURING
Priyank Srivastava
1, Dr. Dinesh Khanduja
2, Dr. V.P Agarwal
31
Assistant Professor, ME, NCCE, Haryana, (India)
2
Professor, ME, NIT, Haryana, (India)
3
Professor, ME, T.I.E.T, Punjab, (India)
ABSTRACT
The purpose of this study is to develop a plan for reducing lead-times and increasing throughput in a product
manufacturing plant by using value stream mapping. The plant produces rubber screening media and wear
products used in the mining and aggregate industry that is sold throughout the western hemisphere.. The rubber
products manufacturer is inefficient because it produces products in batch quantities and has poor product flow
due to operations being departmentalized. The increase in lead-times could cause a loss in the market share to
its competitors. The rubber products manufacturer must reduce its lead-times in order to remain competitive
and continue its growth by providing quality products in a timely manner. A study will be carried out using
value stream mapping to determine areas of potential improvement on the plant floor. A current state map will
be developed and analyzed to pin point areas that have potential for improvement. A future state map will then
be created to suggest ways to reduce lead-times and increase throughput. The map will include lean
manufacturing methods to reduce wastes in the system; increasing throughput and reducing lead-times
Key Terms: Lean Manufacturing, Value Stream Map
I. INTRODUCTION
Lean Thinking, a concept that is based on the Toyota Production System, extends continuous improvement
efforts to reduce the costs of serving customer/s beyond the physical boundaries of a manufacturing facility, by
including the suppliers, distributors and production system that support the manufacturing function [2]. These
improvements and cost reductions are achieved by eliminating the muda (wastes) associated with all activities
performed to deliver an order to a customer. Wastes are defined as “all activities that consume resources (add
costs to the product) but contribute zero value to the customer.” According to Womack and Jones, there are five
steps for implementing Lean Thinking in an enterprise: 1) Define Value from the perspective of the Customer,
2) Identify the Value Streams, 3) Achieve Flow, 4) Schedule production using Pull, and 5) Seek Perfection
through Continuous Improvement. Womack and Jones define a Value Stream as “the set of all the specific
actions required to bring a specific product through the three critical management tasks of any business:
819 | P a g e
II. OVERVIEW OF VSM
A value stream is a collection of all actions (value- added as well as non-value-added) that are required to bring
a product (or a group of products that use the same resources) through the main flows, startingwith raw material
and ending with the customer [1].These actions consider the flow of both information and materials within the
overall supply chain. The ultimate goal of VSM is to identify all types of waste in the value stream and to take
steps to try and eliminate these [1]. While researchers have developed a number of tools to optimize individual
operations within a supply chain, most of these tools fall short in linking and visualizing the nature of the
material and information flow throughout the company’s entire supply chain. Taking the value stream viewpoint
means working on the big picture and not individual processes. VSM creates a common basis for the production
process, thus facilitating more thoughtful decisions to improve the value stream. VSM is a pencil and paper tool,
which is created using a predefined set of standardized icons (the reader is referred to [1]. The first step is to
choose a particular product or product family as the target for improvement. The next step is to draw a current
state map that is essentially a snapshot capturing how things are currently being done. This is accomplished
while walking along the actual process, and provides one with a basis for analyzing the system and identifying
its weaknesses. The third step in VSM is to create the future state map, which is a picture of how the system
should look after the inefficiencies in it have been removed. Creating a future state map is done by answering a
set of questions on issues related to efficiency, and on technical implementation related to the use of lean tools.
This map then becomes the basis for making the necessary changes to the system.
III. CASE STUDY: INTRODUCTION ABOUT COMPANY
A VSM emphasizes the requirement for redesigning the production line. It visualizes the whole production line
and also identifies waste in the value stream. This tool mainly improves the material and information flow of a
production line. The VSM forms a base for implementing the lean techniques and the concepts across the
organization. The future plan is to implement the lean tool (VSM) in a well-reputed industry named “XYZ”, a
well known in the manufacturing of Single Phase Contractors and Submersible Units from the past 8 years. The
company spreads over in 21780 sq. ft. area with advanced technology CNC Machines, Hydraulic Presses and
Mechanized Silver Plating Plant. The Company has a turnover of 15 crores/annum. The Company has an
efficient production infrastructure of Industry knowledge, Motivated Employees and Manufacturing Process.
Raw material formulations are optimized by critical in-house testing and standardized for consistent quality and
reliability. The component selected for study is contractor. A contactor is an electrically controlled switch used
for switching a power circuit, similar to a relay except with higher current ratings. A contactor is controlled by a
circuit, which has a much lower power level than the switched circuit. A contactor has three components. The
contacts are the current carrying part of the contactor. This includes power contacts, auxiliary contacts, and
contact springs. The electromagnet provides the driving force to close the contacts. The enclosure is a frame
housing the contact and the electromagnet. Enclosures are made of insulating materials like Bakelite, Nylon 6,
and thermosetting plastics to protect and insulate the contacts and to provide some measure of protection against
personnel touching the contacts. And the manufacturing process to complete the contactor is showing in the
820 | P a g e
Bobin Process Coil Winding Coil MouldingAssembly Body Manufacturing
The Machine Shop of “XYZ” is facing problems of delay in delivery process, improper utilization of workforce and higher WIP inventory which lead to poor quality and more input cost and hence reduce profitability. The
problem consists of an existing traditional manufacturing system of Machine shop. Machine shop has; hydraulic
presses, Copper winding m/c's, CNC's. Parts have to be transferred from machine to machine to complete the
required operations. This arrangement increase material handling cost and decreases labor productivity. These
results in delay of orders, which further disturb the overall, schedule at floor shop and affect the production of
machine parts. Although the plant has the ability to produce more than they are producing, it is having following
limitations: Lower quality, Less labor productivity, More Waiting times, Large WIP, Longer material
movement. To overcome these limitations there is a need to identify the key areas, which are producing trouble
and wastes, and to identify bottleneck operations at shop floor.
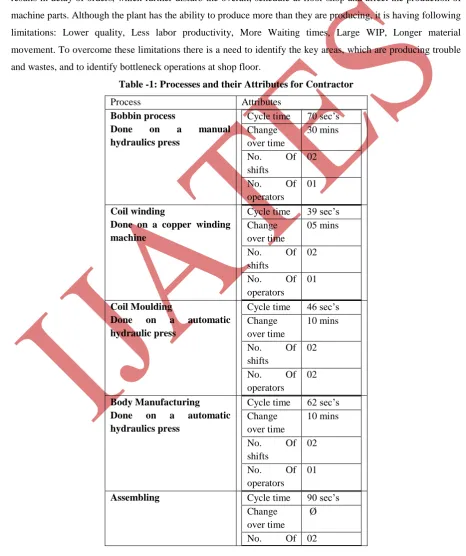
Table -1: Processes and their Attributes for Contractor
Process Attributes
Bobbin process
Done on a manual
hydraulics press
Cycle time 70 sec’s Change
over time
30 mins
No. Of shifts
02
No. Of operators
01
Coil winding
Done on a copper winding machine
Cycle time 39 sec’s Change
over time
05 mins
No. Of shifts
02
No. Of operators
01
Coil Moulding
Done on a automatic
hydraulic press
Cycle time 46 sec’s Change
over time
10 mins
No. Of shifts
02
No. Of operators
02
Body Manufacturing
Done on a automatic
hydraulics press
Cycle time 62 sec’s Change
over time
10 mins
No. Of shifts
02
No. Of operators
01
Assembling Cycle time 90 sec’s
Change over time
Ø
821 | P a g e
shiftsNo. Of operators
02
Table- 2: General Data of Company
Work time
26 days in a month.
2-shift operation in all production departments. Eight hours every shift.
30 mins break during each shift. Manual processes stop during breaks.
Production control
department
Receives a 2-month forecast from the Customer.
Loads forecast in MRP.
Issues 2 week forecast to Supplier.
Generates weekly department schedules through MRP. Issues weekly shipping schedule to shipping
Shipping
Remove parts from finished goods warehouse and stages them for truck shipment to customer.
IV. ANALYSIS OF CURRENT STATE MAP
Concepts of value stream provide a picture of the current state of affairs as well as a guide about the gap areas.
822 | P a g e
Describing and defining the future state map actually starts while developing the current state map, where targetareas for improvement begin to show up. Following gap areas were observed from the current state map of
electrical contractor:
1. WIP inventories between various operations are considerably high.
2. Station cycle time variation is more, which lead to production imbalance and WIP inventories on the shop
floor.
3. Production lead-time is quite high.
4. Production in the plant is below the installed capacity as per the data of PPC department.
5. Improper utilization of workers.
6. Long distance is covered by products in the plant as revealed by the study of Plant Layout.
By reducing inventory, we may attain on-time completion of orders and can automatically improve quality. e.g.
reducing work in process will reduce the amount of defects to be reworked, which in turn will improve quality.
Also less WIP means that tracing the root cause of a defect will be easier.
KEY QUESTIONS THAT CONVERTS THE CVSM TO FVSM
1Q: What is the Takt Time of “XYZ”?
The Takt time is the demand rate and consequently the time between completions of each product off of
the production line. It is first necessary to find the available capacity of the production line.
Takt time can be first determined with the formula:
{T= TaTd}
Where:
T = Takt time, e.g. [minutes of work / unit produced]
Ta = Net time available to work, e.g. [minutes of work / day]
Td = Time demand (customer demand), e.g. [units required / day]
Net available time is the amount of time available for work to be done. This excludes break times and any
expected stoppage time (for example scheduled maintenance, team briefings, etc.).
Takt Time of “XYZ”:
1. Customer requirement = 23000 products/month.
2. No. Of working days = 26
3. No. Of shifts= 2
4. Time available in each shift = 8 hrs. = 28000 sec’s.
5. Time for breaks or non-working time per shift = 30 mins = 1800 sec’s.
6. Net available working time per shift = 28000 – 1800 = 27000 sec’s.
Therefore, Takt Time = 27000 sec’s ÷ 442 units per shift = 61 sec’s.
What this takt number means is that to meet customer demand within its available work time, the company
needs to produce a contractor in every 61 seconds.
2Q: Will we ship directly to the customer, or to a finished goods warehouse?
The contractor can wait a long time in the warehouse before being shipped. Even though the contractor are
823 | P a g e
is not a significant issue due to the existence of the contractor being stored on moveable trolleys. The Company“XYZ” should designate an area at the warehouse (which would be called the supermarket) and store the
contractor based on a kanban system. Whenever the supermarket inventory is below a certain level this would
trigger the assembly line to replenish the supermarket according to the level set at the super market.
3Q: Where can we use continuous flow?
Continuous flow is producing products using a batch size of one. This is a very efficient means of production
since no inventory is created between process steps. An automobile assembly line is generally an example of
continuous flow.
Chart -1: Operator Balance Chart
In this case of contractor the coil moulding process and body manufacturing process are done on the same
machine (automatic double hydraulic press), and as shown in the operator-balance chart the cycle time of both
the processes are near to each other. These two workstations are dedicated to contractor product family, so
continuous flow in production line certainly is possibility. Notice that in Future state map the two coil moulding
and body manufacturing processes boxes are combined to one process box to indicate the continuous flow. Also
824 | P a g e
V. CONCLUSION
Future state proposed to the Company “XYZ” removes large amount of waste.
Thus increase in productivity and efficiency, which results in increase in profit. This can be seen in the
following table which compares previous status and status after future implementation for electrical contractor.
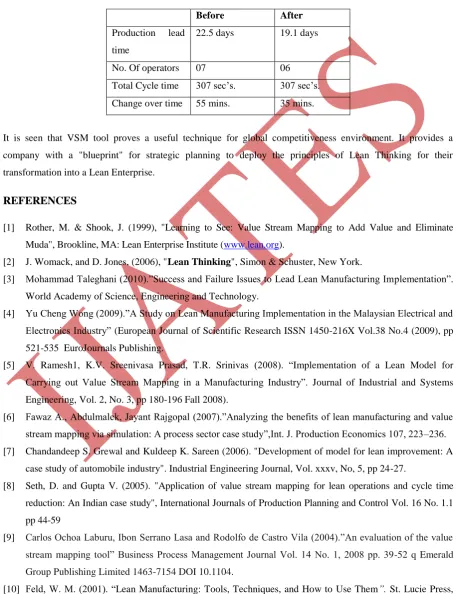
Table -1: Comparison Between Previous And Proposed Condition
It is seen that VSM tool proves a useful technique for global competitiveness environment. It provides a
company with a "blueprint" for strategic planning to deploy the principles of Lean Thinking for their
transformation into a Lean Enterprise.
REFERENCES
[1] Rother, M. & Shook, J. (1999), "Learning to See: Value Stream Mapping to Add Value and Eliminate
Muda", Brookline, MA: Lean Enterprise Institute (www.lean.org).
[2] J. Womack, and D. Jones, (2006), "Lean Thinking", Simon & Schuster, New York.
[3] Mohammad Taleghani (2010).”Success and Failure Issues to Lead Lean Manufacturing Implementation”.
World Academy of Science, Engineering and Technology.
[4] Yu Cheng Wong (2009).”A Study on Lean Manufacturing Implementation in the Malaysian Electrical and
Electronics Industry” (European Journal of Scientific Research ISSN 1450-216X Vol.38 No.4 (2009), pp
521-535 EuroJournals Publishing.
[5] V. Ramesh1, K.V. Sreenivasa Prasad, T.R. Srinivas (2008). “Implementation of a Lean Model for
Carrying out Value Stream Mapping in a Manufacturing Industry”. Journal of Industrial and Systems
Engineering, Vol. 2, No. 3, pp 180-196 Fall 2008).
[6] Fawaz A., Abdulmalek, Jayant Rajgopal (2007).”Analyzing the benefits of lean manufacturing and value
stream mapping via simulation: A process sector case study”,Int. J. Production Economics 107, 223–236.
[7] Chandandeep S. Grewal and Kuldeep K. Sareen (2006). "Development of model for lean improvement: A
case study of automobile industry". Industrial Engineering Journal, Vol. xxxv, No, 5, pp 24-27.
[8] Seth, D. and Gupta V. (2005). "Application of value stream mapping for lean operations and cycle time
reduction: An Indian case study", International Journals of Production Planning and Control Vol. 16 No. 1.1
pp 44-59
[9] Carlos Ochoa Laburu, Ibon Serrano Lasa and Rodolfo de Castro Vila (2004).”An evaluation of the value
stream mapping tool” Business Process Management Journal Vol. 14 No. 1, 2008 pp. 39-52 q Emerald
Group Publishing Limited 1463-7154 DOI 10.1104.
[10] Feld, W. M. (2001). “Lean Manufacturing: Tools, Techniques, and How to Use Them”. St. Lucie Press,
Before After
Production lead
time
22.5 days 19.1 days
No. Of operators 07 06
Total Cycle time 307 sec’s. 307 sec’s.
825 | P a g e
New York, NY.[11] Hines, P., Rich, N., Bicheno, J., Brunt, D. & Taylor D. (1998), "Value Stream Manangement," The
International Journals of Logistics Management, Vol. 9, No. 1, pp. 25-42.
[12] Ohno, T. (1997), "Toyota Produciton system: Beyond Large Scale Produciton", (Productivity Press: