6598
Early Usability Evaluation Of Model-Based
Mobile Applications
Lassaad Ben Ammar
Abstract: The evaluation of mobile applications concerning their usability is an emerging area of research in the field of Computer-Human Interaction. The aim was to identify potential usability problems that may cause the reject of the system. The usual way to evaluate usability is through a user test once the system is implemented. At this stage, it is difficult/expensive to go back to the design and make the required changes to solve usability issues. Recently, the Model-Driven Engineering (MDE) paradigm is gaining popularity as a solution to reduces changes cost and complexity. In such an approach, the application is modelled and, through a set of model transformations, the target application is outputted. The transformation process establishes a mechanism of traceability between the application models elaborated at the design phase and the final application. Due to this mechanism, the analysis of these models to improve their usability was seen promising to preserve this usability at the final application or improve it. The present paper attempts to prove this assumption in the mobile application development context. It presents a new approach to early evaluate the usability from the conceptual schemas that represent the mobile application. A case study is presented to evaluate the potentialities and limitations of our proposal.
Index Terms: Early usability evaluation, Mobile applications, Model-driven engineering, Mobile Usability
————————————————————
1 INTRODUCTION
In the last few years, there is a fast growth on mobile subscriptions leading to a high demand for mobile applications (referred to as mobile apps). Around 7.9 billion subscriptions were reported in 2018 and 8.9 billion are predicted to be available in 2023 [1]. This state faced software engineers with the challenge of developing high usable applications to improve their attractiveness and competitively in the new market. In this context, several research works are elaborated to evaluate the usability of mobile applications [2], [3]. The evaluation is usually performed once the system is implemented using traditional methods such as laboratory experiments and field studies. These methods involve activities that require a large amount of resources (e.g. participant users, recording systems, usability lab, etc.). Besides, a lot of rework is usually required to go back to the design and made changes. This is not always trivial considering their cost and complexity. Recently, a new paradigm in the software engineering domain was adopted and accepted as a promising technique to alleviate the cost and complexity of the changes: Model-driven Engineering (MDE). In such an approach, interest is focused on conceptual models that represent the system abstractly. These models undergo a series of transformations to obtain the final application, in particular, the user interface. Due to this transformation process, an intrinsic mechanism of traceability between conceptual models and the final application is established. Based on this mechanism, changes made in the conceptual models are reflected in the final application. Some research works have demonstrated that analyzing these models to improve their usability is likely to preserve this usability at the final application, at least to some extent [4], [5], and [6]. The objects of these studies are traditional desktop and web applications. However, the mobile device features (e.g. small screen size, data entry methods, limited capacity, and power process) introduce some new challenges that must be considered by mobile application engineers. The most important one is, without a doubt, to introduce a usability evaluation method that suits for mobile applications and considers their features. The present paper addresses this issue and proposes to incorporate usability engineering as part of the mobile application development process which follows MDE principles. The aim is to evaluate the usability of mobile applications early in an MDE development process (from the
conceptual models). Improving the usability of these models is likely to preserve this usability at the final application, or to improve it. The remainder of this paper will be structured as follows. Section 2 presents a brief review of research works related to the context of this paper. Section3 details our proposal for an early usability evaluation process. The feasibility and the potentialities of the proposed approach are illustrated in section 4. Finally, the conclusion and some perspectives for future works are presented in section 5.
2
LITERATURE
REVIEW
6599
sufficient control over users during the field study. In addition, data collection in the real world is usually a complex task to be performed. The analysis of research works in the context of mobile application evaluation is interesting to identify the boundary and limitations of the current state. Following are the main limitations identified in the existing literature on usability evaluation of mobile applications:
Usability evaluation is carried out when the system is implemented.
Usability evaluation was conducted subjectively. The majority of works do not present precise details about the metrics used for quantifying usability attributes and their scores interpretation.
Usability measures are independent of the development cycle. Hence, designers and developers do not know what to change and where to improve the value of these measures and consequently the usability of the final product.
To the best of our knowledge, no proposal is dealing with the usability evaluation of mobile applications generated with the MDE approach. However, the adoption of MDE in the mobile context has experienced exponential growth [12], [13].
After reviewing the existing literature for mobile usability evaluation, we concluded that mobile usability evaluation is still an immature area and more research works are needed. To cover this need, we propose an early usability evaluation process based on the conceptual schemas that represent the system abstractly. The goals of our proposal are the following:
The evaluation can be applied quickly.
The evaluation can be applied to any MDE-compliant method.
The evaluation must be independent of the end-users.
3 A
PROPOSED
APPROACH
FOR
MOBILE
USABILITY
EVALUATION
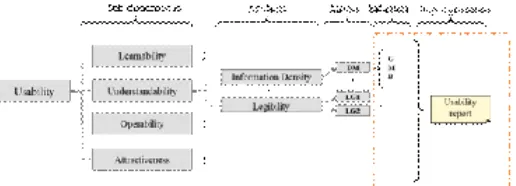
This section presents our proposal to measure the internal usability of a mobile application through conceptual models. Fig. 1 summarizes the whole approach. Grey boxes represent existing elements that are extracted from our previous work [14]. The others represent new elements introduced through our proposal.
Fig. 1. Summary of the approach to measuring the internal usability from conceptual models
As is illustrated in Fig. 1, the measurement approach is made up of four steps:
1. The definition of usability attributes;
2. The definition of usability metrics to quantify previously defined attributes;
3. The definition of indicators to interpret the value obtained by each metrics;
4. The generation of the usability report which contains all detected usability problems.
The first two steps are extracted from our previous work [14]. The aim was to break down the usability sub-characteristics initiated in the ISO/IEC 9126-1 usability model into measurable attributes and to associate with each one a set of metrics that enable its quantification from the conceptual models. To do so, several usability guidelines and user interface design guidelines are analyzed to extract and adapt attributes and metrics which are considered relevant and can be calculated from the conceptual models. Note that user interface guidelines for iOS [15] and Android [16] operation systems form the main basis for our proposal concerning usability attributes and metrics. These two operating systems are currently the most prominent operating systems and they hold more than 98% of the worldwide market share [17]. The last two steps constitute the main contribution of this paper and aim to interpret whether the value obtained while calculating the usability metrics would be considered as a usability problem or not. To do this, the mechanism of indicators is used. Indicators transform the numeric values obtained using metrics into ordinal values (qualitative values such as Good, Medium, Bad). Indicators classify each range of numeric values according to an ordinal value. As a result, each numeric value obtained after applying the metric formula will be mapped into a qualitative value (Good, Medium, Bad). After that, Bad values will be considered as critical usability problems and a new record will be inserted into the usability report. Once the evaluation process is complete, the usability report will be analyzed to identify the source of each problem and suggest changes that are likely to fix such a problem
3.1 Attributes definition
6600
fingers to point/select UI elements. Thus, developers have to take into consideration the size of pointer target elements while developing their apps. Several UI guidelines for mobile apps recommend a size 44 pts (7-10 mm) at least for a pointer target element. Concerning the example presented before, it becomes clear that usability models presented for desktop and web applications need to be adapted to suit for mobile applications. To do this, we have analyzed several usability
models and user interface guidelines for mobile applications to extract and adapt usability attributes/metrics which we consider relevant to the context of mobile usability. As mentioned before, only attributes and metrics that can be quantified from the conceptual models are considered. Table 1 summarizes the whole model.
TABLE 1 PROPOSED ATTRIBUTES AND THEIR DESCRIPTION
Attribute Meaning
Prompting Available means to help users to make specific actions such as data entry Predictability The available means to help users predict his/her future action.
Feedback System responses to user actions.
Information Density The users’ workload from a perceptual and cognitive point of view.
Brevity Available means to reduce the cognitive efforts of the users while interacting with the system. Navigability The ease with which a user can move around in the application.
Message Quality The expressiveness of the error message.
Legibility The degree to which a reader can recognize easily a text.
Cancel Support The degree of control that users have over the treatment of their actions. Undo Support
Explicit User Action The relationship between computer processing and the users’ actions. Error Prevention Available means to prevent data entry errors.
Font Style Uniformity Total number of used font style per user interface Color Uniformity Total number of used color per user interface
Consistency The maintaining of the interface design choices in a similar context. Balance The distribution of the optical weight in a user interface.
Note that the list of usability attributes in Table 1 is not intended to be exhaustive. These attributes are a starting point for identifying the usability features of mobile apps from the early stage of the development process. We intend to add the missing attributes to the list when more information becomes available
3.2 Metric Definition
Defining usability metrics is a crucial part of any usability
evaluation method. It aims to describe a way to quantify an attribute. In this section, we present the usability metrics introduced through our proposal to measure each usability attributes. We opted for the generic description to allow their application to any MDD method. The interest is focused on presenting new elements that are extracted from user interface guidelines for mobile applications.
TABLE 1 PROPOSED ATTRIBUTES AND THEIR DESCRIPTION Attribute Metric Description
Prompting
Percentage of labels with supplementary information.
Percentage of structured text entry among all data entry elements that requires an exact format for the data to be entered (e.g. phone numbers, credit card)..
Predictability Percentage of meaningful labels (less than 3 words). Percentage of action elements with built-in icons. Feedback Percentage of action with feedback response. Information Density Percentage of screen occupied by objects.
Brevity Percentage of input elements that presents a default value. Navigability Average of navigation element per interface.
Message Quality Average of word per error message.
Legibility Percentage of pointer target element with a recommended size (greater or equal than 44pt x 44pt). Percentage of interface elements with a recommended font size (greater or equal than 16pt). Cancel Support Percentage of actions that can be canceled without harmful effects.
Undo Support Percentage portion of actions that can be undone without harmful effects. Explicit User Action Percentage of validation action following a data entry.
Error Prevention Percentage of enumerated input elements that use the primitive which represents a list. Font Style Uniformity Total number of used font style per user interface.
Color Uniformity The total number of used color per user interface.
Consistency Percentage of the repeated elements that have the same label.
6601 axis.
3.3 Indicator definition
To be able to interpret the meaning of the numerical values afforded from the previous metrics, we opted for the mechanism of indicators. This later consists of assigning a qualitative value with each range of numerical values obtained using the calculation formula of a metric. Three indicators are used in this paper: Good (G), Medium (M) and Bad (B). Some indicators are extracted from related works that are empirically validated [6], [18], and [19]. For the newly added elements, the good value is built on guidelines and models presented in the usability literature and is used to estimate the bad value. After that, the medium value is obtained by distributing the range (since we have the two extremes) equitably. Table 2 shows the list of indicators defined for some newly added elements.
TABLE 1 PROPOSED INDICATORS FOR USABILITY METRICS.
Metric G M B
STE STE≥0.8 0.7≤STE≤0.8 STE≤0.7 BI BI≥0.8 0.7≤BI≤0.8 BI≤0.7
DM BM≥0.75 0.45≤DM≤0.7
5 DM≤0.45
DV DV≥0.2 0.1≤DV≤0.2 DV≤0.1 TeS TES≥0.8 0.7≤TES≤0.8 TES≤0.7 TxS TS≥0.8 0.7≤TS≤0.8 TS≤0.7
3.4 Usability report generation
This step consists of inserting all usability problems detected during the evaluation process using a well-defined template. In this paper, we consider only metrics with Bad value as usability problems. Each usability problem can be described using the following fields: problem identifier, description, affected usability attribute, severity level, and recommendation to fix such a problem. At the end of the evaluation, this report will be the basis for the recommendations which are likely to fix the detected usability problems.
4 CASE
STUDY
This section presents the case study performed to illustrate the feasibility of our proposal and its ability to discover usability problems from the conceptual models of mobile apps user interfaces generated with an MDE method. The case study will be structured as follow: design of the case study, preparation of the case study, data collection and results analysis.
4.1 Design the case study
The following concepts are considered while designing the case study: the purpose of the case study, the research question to be addressed, the object of the case study and the employed method. The purpose of the case study is to illustrate the applicability of our proposal to an MDD method in the mobile context. The research question to be addressed through this case study is: does the proposed usability evaluation process allow the detection of usability problems from the conceptual models of mobile apps generated using an MDD method? The object of the case study was a simply Digital Home System (DHS). The scenario is adapted from [20]. Several tasks can be performed using this system allowing a user to control every computing device and home appliances. The key functional requirements for this
application are the following:
Authenticate a user to enable remote access to home devices;
Select a room;
Select a device inside the room;
Inspect and modify the status of a selected device.
To respond to the research question, the usability evaluation process will be applied as follow: a concrete user interface model of the DHS system will be generated following the principles of the MDD method presented in [20]. This concrete model will be the input of an evaluation process which is done semi-automatically. As a result, a usability report containing the detected usability problems will be generated. The analysis of this report will allow us to suggest some recommendations which are susceptible to improve the usability of the concrete model and consequently improve the usability of the final application.
4.2 Preparing the case study
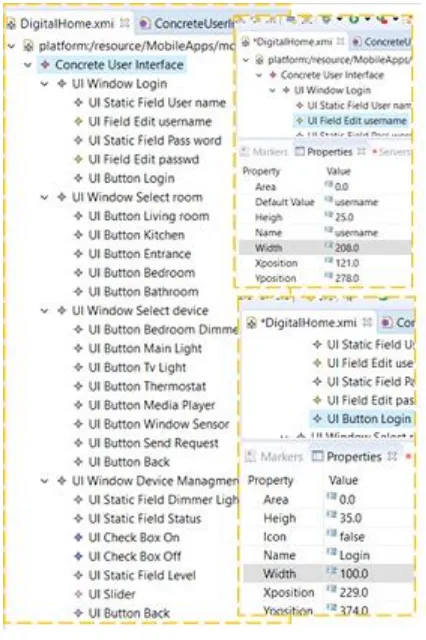
This section involved sketching initial drafts of the design based on findings from other initiatives treating the same case study (e.g. [21]). Fig. 3 presents the prototype screens that we have developed using the Mock Flow online tool for the application user interfaces. The aim was to better clear a possible organization of the application user interfaces. The concrete user interface of this prototype is designed using the Eclipse Modelling Framework (EMF) tool (see Fig. 2).
Fig. 2. Concrete user interface for the DHS.
6602
that gathers all the usability attributes and their metrics are used as a parameter of the evaluation process. From this model, a set of usability attributes will be selected to be evaluated in the selected artefact. Note that not all usability attributes can be evaluated from this artefact and this is due to the lack of expressiveness in its meta-model. To solve this problem, we evaluate these attributes at the final user interfaces and analyze them to propose the required changes in the concrete user interface meta-model. The usability attributes to be evaluated are the following: Brevity, Legibility, and Predictability. We select the Default Value metric to measure the Brevity and the Built-in icons as a metric to measure the Predictability attribute. For the Legibility, the two metrics associated with this attribute are selected. The calculation formulas of all these metrics are operationalized in the studied method to enable their application to the selected artefact.
Fig. 3. Example of sketches of user interfaces for smartphones.
4.3 Data collection
This paper aims to collect data from the evaluation process. Recall that the aim of this paper is to demonstrate that the evaluation of mobile usability can be done early in the development life cycle. To meet this objective, usability attributes that can be quantified from the concrete user interface are considered. For those which cannot be calculated due to the lack of expressiveness of the artefact meta-model, they are calculated based on the prototype sketches and are analyzed to propose the required changes in the meta-model of the concrete user interface.
Concerning the concrete model, the following data can be recuperated:
Default value: the total number of input/select
elements is 6. Only 2 elements are not initialized with
a possible default value (username and the select device list). Using the calculation formula for this metric (see EQ.3), the value of this metric is 0.66 which is a Good value according to Table 2.
Built-in icons: this metric considers the action
elements which may use a built-in icon to help the user to predict their future action. In the actual meta-model, this attribute is supported by indicating if there is an icon for the element or not. 11 elements are presented in the user interface model and only 3 are expected to use a built-in icon. Hence, the value of this metric is 0.27 which is considering as a Bad value according to Table 2. A usability problem will be added to the usability report as shown in Table 3.
Text size: this metric will be evaluated using the final
user interface sketches since the actual meta-model does not include an attribute font size for the user interface elements. The total number of elements is 26, 12 elements use a font size less than 16pt and the other are greater or equal to 16pt. This gives as a result of 0.46 which is a Bad value according to Table 2. Hence, a usability problem will be added to the usability report as shown in Table 3.
Tapped element size: for this metric, we need to
transform the dimension unit from pixel to dp (density-independent pixel) which is used to support different screen sizes and a pixel density of mobile devices. Interchanging formula is the following: dp = px / (dip/160) with dip is the device density measured in dot per inch. In this paper, we consider the pixel density bucket 320 dpi since a large scale of the actual smartphones are running at such pixel density. We have 5 dimensions used in the case study design. We consider the Windows phone guideline for the button which recommends using the button with size greater or equal to 64 x 36 dp. After converting the button size from pixel to dp, none of them reaches the recommended size. The problem is in the height which is always less than the recommended value. As for the width, all buttons respect the recommendations except the sign-in button. Consequently, a second usability problem is identified and added to the usability report as shown in Table 3.
TABLE 1 EXCERPT OF THE USABILITY REPORT.
ID Description Affected
Attributes Sever
ity Level
Recommendation
UP01
Action elements do not present familiar build-in icons.
Predictabil ity
Critic al
Add a build-in icon for each action element in the concrete model.
UP02
A lot of text used small size disabling good legibility of the user interface.
Legibility Critic al
Go back to the design and change all the elements size more than 16 pt. Use a default size greater than or equal to 16 pt for all the user interface elements.
UP03 Button size is under the
recommended value. Legibility Critic
al
6603
4.4 Results analysis
The result of the execution of the evaluation process is analyzed to address the research question of this case study. Concerning the usability report outputted by the execution of the evaluation process, some usability problems are detected from the conceptual model (CUI model). The source of these problems can be identified allowing us to suggest recommendations for possible changes aiming to fix such problems and avoid their occurrence in any future user interface generated with the underlined method. For example, increasing the text font size and the size of buttons while designing the user interface is likely to generate a user interface that meets the recommended value for these elements and improves the usability of the final application. The second important point resulting from the case study is its ability to identify the lack of expressiveness in the studied MDE method. This problem can be fixed by refining the user interface meta-model and add all missing attributes required for the evaluation process. Lessons learned Based on the case study results, the potentialities and limitations of our proposal can be identified. First, the proposed usability evaluation process allows the detection of usability problems early from the conceptual models of an MDD method. Due to the traceability between conceptual models and the final application user interface, changes made in these models avoid detected usability problems to occur in the final application. This enables the development of a mobile application with better usability and thus reduces the effort at the maintenance stage. Second, the evaluation process presented in this paper appeared to be an interesting means to discover the expressiveness of the MDD method to be applied while developing the application. Based on all these findings, we argue that our proposal can be a building block to provide practical support for current MDE technologies dealing with mobile usability engineering.
5
CONCLUSIONS
This paper presents an early usability evaluation process for mobile applications generated with an MDE tool. This process employs a usability model as a primary input artefact. This model gathers a set of usability metrics that are defined based on conceptual primitives allowing their application from the early stage of the development process. The proposed process has the following properties which can be considered as advantages compared to related works: Usability can be evaluated early from the conceptual models without user intervention reducing thereby time and resources required by traditional evaluation methods. Usability is evaluated objectively using a set of quantifiable metrics defined with their calculation formulas and score interpretation. Metrics are defined generically allowing their application to any MDD method with similar conceptual primitives. A case study is performed to illustrate the feasibility of our proposal and to identify its potentialities and limitations. Results show that theoretical assumptions are proved (e.g. discovering usability problems from the conceptual models) and rise some new challenges which we plan to consider in future work. As an example, we plan to conduct an empirical study to investigate the relationship between the predicted usability measured by applying our proposal and those perceived by end-users. Such empirical study will allow us also to adjust the value of some
indicators especially those associated with the new metrics added in this paper. The automation of the evaluation process will be the object of our future work.
REFERENCES
[1]. Ericsson. 2018. Ericsson Mobility Report.
[2]. R. Reis, A. Fontão, L. Lobo, and A. Neto. Usability Evaluation Approaches for (Ubiquitous) Mobile Applications: A Systematic Mapping Study. The Ninth International Conference on Mobile Ubiquitous Computing, Systems, Services and Technologies, pp.11-17, 2015.
[3]. F. Nayebi, J. Desharnais, A. Abrain. The state of the art of mobile application usability evaluation. 25th IEEE Canadian Conference on Electrical and Computer Engineering (CCECE), pp 1-4, 2012. [4]. S. Abrahao, E. Iborra, J. Vanderdonckt: usability
evaluation of user interfaces generated with a Model-Driven Architecture tool, Maturing Usability: Quality in Software, Interaction and Value pp.3-32, Springer London, London (2008).
[5]. S. Abrahao, E., Insfran: Early usability evaluation in model driven architecture environments, In: Sixth International Conference on Quality Software (QSIC'06), pp. 287-294 (2006).
[6]. L. BenAmmar, A. Trabelsi, A. Mahfoudhi: A model-driven approach for usability engineering of interactive systems. Software Quality Journal 24(2): 301-335, 2016.
[7]. ISO/IEC 9126-1 (2001), Software engineering - Product quality - 1: Quality model.
[8]. ISO 9241-11 (1998) Ergonomic requirements for office work with visual display terminals - Part 11: Guidance on Usability.
[9]. K. Moumane, A. Idri1, and A. Abran. Usability evaluation of mobile applications using ISO 9241 and ISO 25062 standards, SpringerPlus, Vol 5, issue 1, 2016.
[10].D. Zhang, B. Adipat. Challenges, methodologies, and issues in the usability testing of mobile applications. International Journal of Human-Computer Interaction, vol. 18, no. 3, pp. 293-308, 2005.
[11].Barros, R. Leitão, J. Ribeiro. Design and evaluation of a mobile user interface for older adults: navigation, interaction and visual design recommendations. Procedia Computer Science, Vol 27 2014, pp. 369-378, 2014.
[12].E. Umuhoza & m. Brambilla. Model Driven Development Approaches for Mobile Applications: A Survey. 10.1007/978-3-319-44215-0_8. Mobile Web and Intelligent Information Systems - 13th International Conference, MobiWIS 2016 Vienna, Austria, pp 93-107, 2016.
[13].F. T. Balagtas-Fernandez and H. Hussmann. Model-Driven Development of Mobile Applications. 23rd IEEE/ACM International Conference on Automated Software Engineering, L'Aquila, 2008, pp. 509-512. doi: 10.1109/ASE.2008.94
6604
[15]. Apple: Human interface guidelines. Web: https://developer.apple.com/design/human-interface-guidelines/ios/icons-and-images/system-icons/ [16]. Android design Guidelines, Android developers. Web:
https://developer.android.com/design/
[17]. G. Jindal & M. Jain. A comparative study of mobile phone’s operating systems. International Journal of Computer Applications & Information Technology. 2012. 1(3). p. 10-15.
[18]. I.J. Panach, N.C. Fernández,E.J. Tanja, N. Aquino, F. Valverde: Early Usability Measurement in Model-Driven Development: Definition and Empirical Evaluation. International Journal of Software Engineering and Knowledge Engineering 21(3): 339-365, 2011.
[19]. Fernandez, S. Abrahão, E. Insfran.. Empirical validation of a usability inspection method for model-driven Web development. Journal of Systems and Software, Volume 86, Issue 1, January 2013, Pages 161-186
[20]. W. Bouchelligua, A. Mahfoudhi, N. Mezhoudi, O. Dâassi, and M. Abed. User interfaces modelling of workflow information systems. In EOMAS, pages 143–163, 2010.
[21]. G. Meixner, G. Calvary, J. Coutaz: Introduction to Model-Based User Interfaces. W3C working group
Note 07 January 2014. Web: