165 | P a g e
OEE IMPROVEMENT BY TPM IMPLEMENTATION:
A CASE STUDY
Jitendra Kumar
Department of Mechanical Engineering, Sant Longowal Institute of Engineering and Technology
(Deemed University), Punjab (India)
ABSTRACT
The manufacturing industry has gone through significant changes in the last decade. Competition has increased
dramatically. Customers focus on product quality, product delivery time and cost of product. Because of these,
the organization should introduce a maintenance system to improve and increase both quality and productivity
continuously. Total Productive Maintenance (TPM) is a methodology that aims to increase the availability of
existing equipment hence reducing the need for further capital investment. The aim of this paper is to study the
effectiveness and implementation of TPM program in a thermal power plant. Through the case study of
implementing TPM in a thermal power plant, the increase in efficiency and productivity of plant in terms of
Overall Equipment Effectiveness (OEE) are discussed. On the basis of results a database has been prepared
which can be further used.
Keywords: TPM, OEE, PM, AM,QM.
I INTRODUCTION
Maintenance has become more challenging in the current dynamic business environment. It is considered one of the important strategic decisions in operations management.[1] The manufacturing sector has been experiencing tremendous challenges in ensuring all products are delivered to customers on time. However, the current business environment and pressures from various parties such as customers, suppliers, governments and so forth have put manufacturing sectors under severe pressure. To operate efficiently and effectively, manufacturing sectors need to ensure no disruption due to equipment breakdown, stoppages and failure.
166 | P a g e
division including planning, manufacturing, and maintenance. It describes a synergistic relationship among all organizational functions, but particularly between production and maintenance, for continuous improvement of product quality, operational efficiency, capacity assurance and safety.
TPM is an aggressive strategy focuses on actually improving the function and design of the production equipment [5]. TPM aims to increase the availability/effectiveness of existing equipment in a given situation, through the effort of minimizing input (improving and maintaining equipment at optimal level to reduce its life cycle cost) and the investment in human resources, which results in better hardware utilization. Another goal of TPM as stated by Schippers [6] is to reduce and to control the variation in a process.
II METHODOLOGY
TPM employs OEE as a quantitative metric for measuring the performance of a productive system. OEE is a core metric for measuring the success of TPM implementation program. The overall goal of TPM is to raise the overall equipment efficiency. OEE is calculated by obtaining the product of availability of the equipment, performance efficiency of the process and rate of quality products.
Overall Equipment Efficiency = Availability x Performance efficiency x Rate of Quality. Where,
Availability: - Available Time required to produce a finish product.
Availability = (Required availability – Downtime) / (Required availability) *100.
Performance: - It can be defined as the design cycle time to produce the item multiply by the output of the equipment and then divided by the operating time.
Performance = (design cycle time*output)/ (operating time)*100 Quality = It is the ratio of production output to the production input. Quality = output/input.
2.1 World Class OEE IS:
Table: 1 World Class OEE
OEE FACTOR
WORLD CLASS
AVAILABLIT
Y
99.0% PERFORMANCE 95.0% QUALITY 99.9%167 | P a g e
III RESULT AND ANALYSIS
3.1 Calculations on OEE of the boiler 1 plant for January, 2015 (before TPM implementation):
Mechanical breakdown=42.92hrs, Electrical breakdown=12.24hrs
Electronics/safety device breakdown=3.01hrs Total breakdown=58.18hrs
Setup and other conditions=8.5hrs
Total loss = 66.68 hrs (Summation of all above losses) Total good hours=738hrs
Net loss = (Total good hours-Total loss) =738hrs – 66.68hrs =671.32hrs
Availability rate= (Net loss/Total good hours)×100 =(671.32 ÷738)×100=90.96% Thus, availability rate is 90.96%.
Percentage of quality= (Total steam produced-Defected steam) ÷Total steam produced (Defected steam=Total breakdown × Steam produced per hour)
= (7380-581.8) ÷7380 = 92.11% Thus, quality rate is 92%.
Performance rate= (Net loss-(Management loss+ Start up loss) ÷ Net loss = [671.32-(88+14)] ÷ 655.19=84.80%.
(Consumption item furnace oil per batch=5610 litters and 210,300 litter’s/month, Management loss=88 hrs, Startup loss=14 hrs).
Thus, performance rate is 83.97%.
OEE = (Availability rate) × (Performance rate) × (Quality rate) ×100 = (0.9099) ×(0.8122) ×(0.9211) = 70.21%
[Note: If OEE is less than 85% (world class manufacturing performance for continuous]
3.2 Calculations on OEE of the boiler plant for June, 2015(after TPM implementation):
Mechanical breakdown=15.85hrs Electrical breakdown=1.50hrs Electronics breakdown=0 Total breakdown=17.35hrs
Setup and other conditions=6.75hrs
Total loss = 24.10hrs (Summation of all above losses) Total good hours=738hrs
Net loss= (Total good hours-Total loss) =738 hrs.-24.10hrs. = 713.90hrs
Availability rate= (Net loss ÷Total good hours) ×100 = (713.90 ÷738)×100=96.73% Thus, Availability rate is 96.73%.
168 | P a g e
= (7380-173.5) ÷7380=97.64%
Defected steam=Total breakdown × Steam produced per hour Thus, quality rate is = 98%.
(Consumption item furnace oil per batch= 5600 litters and 210,300 liters per month, Management loss=88hrs, Startup loss=14hrs)
Performance rate= [Net loss-(Management loss+ Start up loss] ÷ Net loss = [713.90-(88+14)] ÷713.90=85.71%.
Thus, performance rate is 85.71%
OEE= (Availability rate) × (Performance rate) × (Quality rate) ×100%
= (0.9673) × (0.85.71) × (0.97 ) = 81.22%..
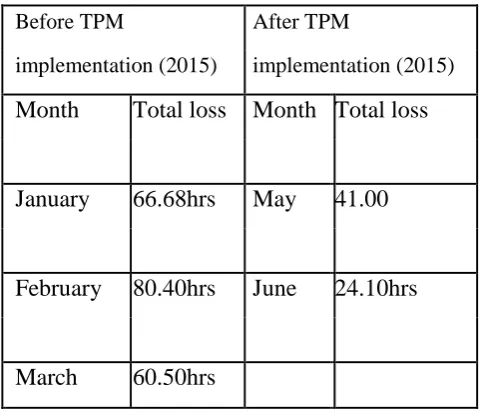
The results of total loss (hours) and OEE calculation for three months during TPM implementation (before and after) in boiler plant are shown in Tables 1 and 2.
Table 2: OEE loss for three months
Before TPM
After TPM
implementation (2015)
implementation (2015)
Month
Total loss Month Total loss
January
66.68hrs
May
41.00
February
80.40hrs
June
24.10hrs
March
60.50hrs
Table3: OEE value before and After TPM
Before TPM
After TPM
implementation (2015) implementation (2015)
Month
OEE value Month OEE value
169 | P a g e
February
66.44%
June
80.23%
March
70.81%
IV CONCLUSION
After successful implementation of TPM, it is found that Overall Equipment Effectiveness is increased (Refer table 2 and figure 3).
After successful implementation of TPM, it is found that Overall Equipment Effectiveness is increased (Refer table 8 and figure 3).
Today TPM may be the only thing that stands between success and total failure for some companies; it has been proven to be a program that works. The results shown above can be much more improved by continuing with TPM.
Today, with competition in industry at an all time high, TPM may be the only thing that stands between success and total failure for some companies TPM can be adapted to work not only in industrial plants, but also in construction, building maintenance, transportation, and in variety of other situations. Employees must be educated and convinced that TPM is not just another “program of the month” and that management is totally committed to the program and the extended time frame is necessary for full implementation. If everyone involved in a TPM program does his or her part, a usually high rate of return compared to resources invested may be expected. TPM success requires strong and active support from management, clear organizational goals and objectives for TPM implementation.
REFERENCE
1. Heizer, J. and Render, B. (2009), “Operations Management Flexible Edition”, 9th ed., Pearson Prentice-Hall, Upper Saddle River, NJ.
2. Mobley RK (1990). An introduction to predictive maintenance. Plant Engineering Series, Van Nostrand Reinhold, New York, 0-442- 31828-6.
3. Al-Najjar, B. and Alsyouf, I. (2003). “Selecting the most efficient maintenance approach using fuzzy multiple criteria decision making”, International Journal of Production Economics, 84(1):85-100.
4.Nakajima, S. (1988), “Introduction to Total Productive Maintenance”, Cambridge, MA, Productivity Press.5. Swanson, L., 2001, “Linking maintenance strategies to performance”, International Journal of Production Economics 70(3), 237–244.
5. Schippers, W.A.J., 2001, “An integrated approach to process control”, International Journal of Production Economics 69 (1), 93–105.
6. Lal H.; Total Quality Management – A Practice Approach, New Delhi, New Age International Publishers, 1995.
170 | P a g e
8. Ahuja, I.P.S. & Khamba, J.S. (2008b). Justification of total productive maintenance initiatives in Indian manufacturing industry for achieving core competitiveness. Journal of Manufacturing Technology Management, (5), 645–669.