Web Interactive Campus Map
Marylene S. Eder, Catherine Jean L. Nocete, Gemelyn L. Rances, Ethyl M. Tarrosa, Jenilyn N. Yanson
Abstract: Interactive campus map is a web based application that can be accessed through a web browser. With the Google Map Application Programming Interface, availability of the overlay function has been taken advantage to create custom map functionalities. Collection of building points were gathered for routing, and to create polygons which serves as a representation of each building. The previous campus map provides a static visual representation of the campus. It uses legends, building name and its corresponding building number, in providing information. Due to its limited capabilities, it became a realization to the researchers to create an interactive campus map.Storing data about the building, room, and staff information, and university events and campus guide are among the primary features that this study has to offer. Interactive Web-based Campus Information System is intended in providing a Campus Information System.It is open to constant updates, user-friendly for both trained and untrained users, and capable of responding to all needs of users and carrying out analyses. Based on the data gathered through questionnaires, researchers analyzed the results of the test survey and proved that the system is user friendly, deliver information to users, and the important features that the students expect.
Keywords: Interactive Map, Web-based Information System, Campus Map
————————————————————
1.
Introduction
Interactive maps can be a great way of displaying useful information in an engaging and attractive way by inviting the user to take action. With huge developments in GEO tagging over the last decade, the advent of Google Maps APIs and the introduction of Fusion tables, more and more websites are taking advantage of these comprehensive tools to showcase their data (Rhys Little, 2013). This technology has given a lot of websites an ability to embed the map on their web pages and use it according to their purpose. It is an additional tool or feature in providing information especially on different academic institutions and businesses. There are different kinds of interactive map depending on their usage. An example is an interactive campus map which is a now a useful element in an educational institution website. Interactive Web-based Campus Information System is intended in providing a Campus Information System. Data of various natures were compiled together and made possible to examine graphical and non-graphical data in a broad manner [3]. A 3D application was practiced on the Campus Information System and exported to the Internet environment additionally with rendering many buildings successfully. It is open to constant updates, user-friendly for both trained and untrained users, and capable of responding to all needs of users and carrying out analyses. It only provides geospatial information for the campus with an additional feature like 3D. And it can be viewed by on-and-off-campus users through the Internet thus making it accessible. It does not provide class schedules of a certain room, and does not dynamically shows campus events information, does not have legends that gives a route and building with floor layout that has interaction like viewing room and staff information. It is common to see a “campus map” link on the websites of large educational institutions, however, most of such maps are static and offer limited interactivity [4]. A campus guidance system is always a helpful tool for those unfamiliar with the campus to orient them and guide them around the campus. It is not just beneficial to the students of the university but also to prospect students. Some other reasons and benefits on having an interactive map is that, it is vital to the recruitment process, it is a stunning and vital feature, and it boosts the schools image (James, 2012). The researchers visited Philippine university websites and found out that a campus map has become an important feature. Many adapted the digital revolution, like Xavier University, Liceo de Cagayan University and De La Salle
University Dasmariñas. Other schools such as De La Salle University and University of the Philippines Manila, Los Baños and Diliman have wide campuses but are still using a static map. The previous campus map provides a static visual representation of the campus. It uses legends, building name and its corresponding building number, in providing information. Due to its limited capabilities, it became a realization to the researchers to create an interactive campus map for MUST. Interactive campus map provide new navigational experience to students. As cited in the vision of Mindanao University of Science and Technology (MUST), MUST is one of the country’s leading providers of science and technological skills, has been progressing dramatically. New buildings, rooms and offices are constructed for different colleges to provide a good learning environment for students, thus making it a perfect candidate to adapt the interactive campus map. Availability of the campus map adds benefits to students especially on the university’s continuous growth. This study aims to provide features like searching and locating points of interest, and provide necessary information of room schedules, campus events and guides.
2.
Methodology
This study was conducted at Mindanao University of Science and Technology (MUST) situated at C.M. Recto Avenue, Cagayan de Oro City. It was linked at the MUST Website which can be accessed and viewed by anyone who visits the campus website.
2.1 Designing the information system
2.1.1 Analysis
2.1.2 Design of the Database
The database for the building, campus event and university guide information has been designed. There are fourteen (14) tables in the database namely, bldg_photo, building, buidlingpoints, events, floor, guide, legend, leg_type, position, room, schedule, staff, steps and user. On the other hand, the researchers made use of the existing tables from the PRISM database for the classroom schedules.
2.1.3 Tools Used
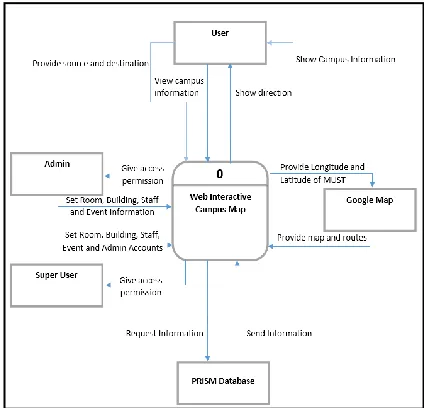
Context diagram and Use Case diagram were used to illustrate its logical design and the scope of the system. Figure 2.1 illustrates it. The system consists of five (5) entities namely, user, admin, Google Map, Superuser and the database. The system has three (3) types of users, namely, user, admin and superuser. When the user views the campus information and directions, the system will filter and retrieve its information from the database and provide routing service with the aid of the Google Map API. The Admin and Superuser on the other hand have similar rights except for the, create administrator account feature of the Superuser. The Google Map is used to provide visual representation of the campus map and routing capabilities.
Figure 2.1 Context Diagram: Interaction to and from the proposed system
Figure 2.2 shows the user interaction with the system. The diagram comprises three actors which represent the different user rights; Superuser, Administrator and User. The Superuser and Admin has the same rights, they both can login or logout, set university events and campus guide information, customize account settings, set room, building and faculty/staffs information. The only difference is that the Superuser can manipulate other account information such as, create other admin accounts, and reset other account password while the Admin cannot. On the other hand the User can only search university events and campus guide information, view routes, search location, search staffs, view classroom schedules and map. These information were dynamically set by the Superuser or Admin.
Figure 2.2 Use Case Diagram: User, Admin and Superuser roles
2.2 Development of the customized map
With the aid of the diagrams; Figures 3.1 and 3.2 is a design was created to visualize the interactive campus map more effectively. It was evaluated further to provide the user a friendly design. It is the basis of the researchers to design all components of the system.
2.2.1 Plan web based campus map incorporated to Google map
The availability of Google Map API helped the developers maximize the effectiveness and helps the researchers improve the interactivity of the Campus map. The authors made use of custom overlay functions to achieve the possibility in adding additional functionalities of the campus map. They include features and locations that do not existon the Google map. The overlays used were the Markers and Polygons. Markers were used to display locations, source and destination. Polygons were utilized to represent buildings inside the campus, that forms a closed loop and define a filled region. Polygons and Markers made use of events that when clicked, it will trigger and show the information window of the building.
2.2.2 Identification of built-in libraries for interactive map
provide an ease on the design. Notepad++ (notepad++, 2013) is a free source code editor and Notepad replacement that support several languages. This tool was used to create and view the source code with ease. Among the important features such as, syntax highlighting, syntax folding, indent guide, color and two edits made it easy for the researchers to create the system. HTML5, CSS3, PHP, and jQuery, played an important role to provide a rich representation and functionality of the map and the additional custom made interfaces, and on the backend, MYSQL was used.
2.3 Evaluation of the System
In order to evaluate the functionality of the system, MUST students have been given a chance to manipulate the system by themselves and are asked to evaluate the proposed system by completing a survey questionnaire (see Appendix B).
3.
RESULTS AND DISCUSSION
3.1 Designing of the Information System
3.1.1 Analysis
Screenshots were taken from the web interactive campus map application of Mindanao University of Science and Technology to provide an illustration on how the system was designed. On figure 3.1, it shows the home page for all users. The menu on the right side of the page is for query purposes, Search pane covers building, room, and staff query, Legends are for amenities like parking lots, comfort room, etc., Events are for university events query by week, day, month or date range and lastly the Campus Guide shows the instructional guide and route on every step.
Figure 3.1MUST Web Interactive Campus Map Home Page
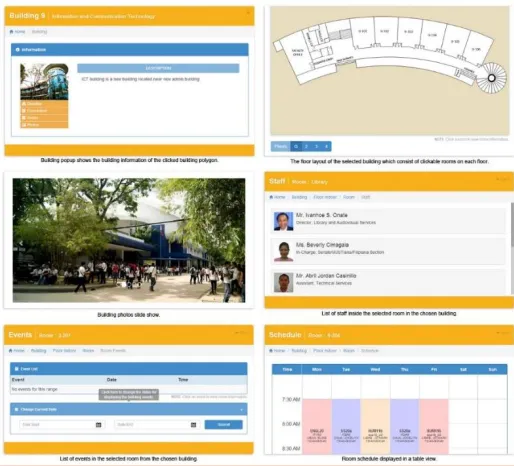
On figure 3.2 shows the information that can be viewed when a building polygon is clicked. Information includes, direction, floor layouts, photos, room staffs, building and room events and room schedules.
Figure 3.2 Screenshots of the building popup content windows
Superuser and Admin have different interface, the only difference between the two is an admin cannot create Admin accounts. There are two different panels for admin accounts, the Map Configurations and Account Settings.
Figure 3.3 Admin Panel
3.1.2 Creation of the Database
Figure 3.4 List of tables in the database Development of the customized map
3.2.1 Web based campus map incorporated to Google map
Google Map API supports web, iOS and android. Google Map API for web has big contributions in making this study possible because of its capability to let developers customize and design the map according to its purpose. Figure 3.5 shows the script used to access the API. With this script, the researchers were able to create building polygons, legend markers and campus guide waypoints.
Figure 3.5 Script of the Google Map API key
The script on Figure 3.6 is used to embed the Google Map to the website with the desired map type options and locations needed on the study. Among the important options were the Longitude and Latitude points of the center, the default zoom level, and the map style.
Figure 3.6 Source code for embedding Google Map to the website
Room Schedules, Campus Events and Guides are among the important features in this study. Campus events made use of the building points for direction services. Figure 3.7 are the scripts that shows the routes from the given source to the event destination.
Figure 3.7 Source code of the route calculation
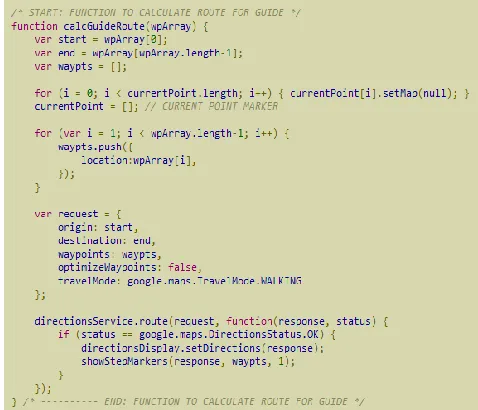
Figure 3.8 illustrates the script that calculates the route on each waypoints. The waypoints, comprises the Longitude and Latitude points of each location, are placed on an array and shows the steps from A to J or less, depending on the number of steps on each guide.
Figure 3.8 Script of Campus Guide waypoint calculation
3.2.2 Built-in libraries
Creating a web application involves a lot of tools to come up with the preferred design and functionality. Among are MYSQL, PHP 5.3, JQuery, HTML 5, CSS 3, Bootstrap and Google Map API Version 3 which have minimal requirements. The researchers used WAMP, a web developer platform, to simulate and create the web application using APACHE 2, PHP and MYSQL database. The researchers used the MYSQL Server 2008 and SQL Server Management Server to access the information needed on the classroom schedules. Scalable Vector Graphics (SVG) was also utilized to create the floor layout so that the image will not be pixilated when zoomed.
3.3 Evaluating the System.
MUST campus with the students as the primary testers. The test involves the ease of use, efficiency, comfortability, manageability, ease of finding information, organization of information, functions and capabilities and the overall satisfaction. The respondents were allowed to interact with the system and then given the time to rate the existing and the proposed system. On table 3.1 it shows the results of the survey according to the rates of the existing and proposed system.
Table 3.1User Survey Results
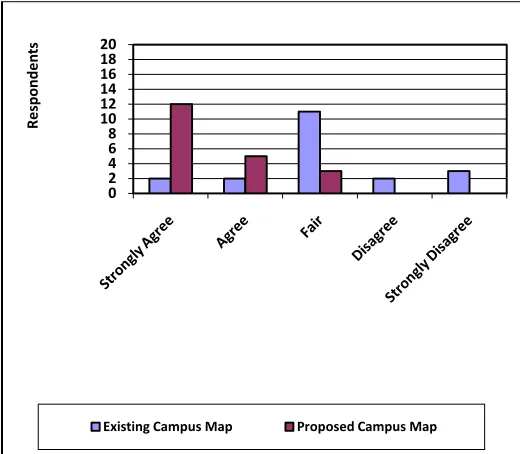
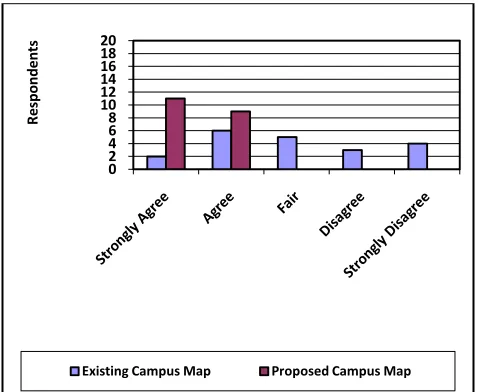
According to the survey, as illustrated on the graph on figure 4.15-A, the proposed system has achieved in providing a user friendly interface to the users. It also proves that training for new users will be unnecessary due to the simplicity of the design.
Figure 3.9-A User ratings of the usability of the systems
Figure 4.15-B shows that majority of the respondents finds the efficiency of finding information has been met. The proposed system drew a big impact on the efficiency in finding information. Accessibility through the internet has contributed to its efficiency due to its availability.
Figure 3.9-B Rate of efficiency in providing university information
Figure 4.15-C illustrates the survey result about the comfort of using the campus map. The effectivity of the design and functionality of the proposed system made it more comfortable for the users to use and explore.
Figure 3.9-C Users’ ratings of the comfort in accessing the system
Figure 4.15-D shows the survey results on the manageability of both the proposed and existing campus map. The design of the system played an important role in making it more flexible and manageable to use.
0 5 10 15 20
R
e
sponde
n
ts
Existing Campus Map Proposed Campus Map
0 2 4 6 8 10 12 14 16 18 20
R
e
sponde
n
ts
Existing Campus Map Proposed Campus Map
0 2 4 6 8 10 12 14 16 18 20
Re
sp
o
n
d
e
n
ts
Figure 3.9-D Users’ rate of the systems adaptability
4.
Conclusion
The system has undergone tests to know whether the problems of the existing campus map has drawn into a conclusion and objectives of the study has been met and also, gather information on the outlook of the user about the design and functionality of the proposed system. The researchers were able to know their concerns and suggestions and made little adjustments based on the results. This study focused on providing a new way of spreading information which has been achieved due to the new features that the proposed system offers. Because of this, the system has gained positive feedbacks from the respondents. The existing campus map has its own benefit but lacks interactive functionalities. The system was made to better provide a friendly user interface making it more beneficial to students, employees and visitors of the institution. The interactive campus map features includes campus guide that provides instructional guides and directions that helps direct users, room schedules also proves effective especially on looking for vacant rooms, campus events which gives information about the upcoming campus events. The system also provides additional queries like amenities, staff, room and buildings which the respondents found it useful and easy to access, thus, making it a valuable online resource in providing campus information.
5.
Recommendation
After a careful research and analysis, these were the following recommendation:
1. Add Global Positioning System (GPS) on this system. 2. Make it available on mobile devices.
3. Make it more interactive by making the building and floor layout dynamic and provide indoor routing.
4. To make it more informative, add interface for dynamic exam schedules.
5. Connect to the biometrics and show the present faculty’s position inside the university campus.
6. E-library attendance
7. Change the map to 3D view and make it available for walk view or panorama.
6.
Acknowledgment
Authors would like to thank the MUST administration for supporting our paper to be integrated in the university website for beta testing. To the students for their support of this research paper.
7.
References
[1] Beasley, P. (2010) “Interactive Map Can Help Find Quickest Way To Class, Grad Student Asking For Help In Testing Effectiveness”. Retrievedfebruary 09,
2014<Pnbeasley.Weebly.Com/Uploads/8/9/7/5/897 5782/Interactive_Map.Pdf >.
[2] Detwiler, J. And Dutton, J. (2011). “Interactive Web
Maps”. Retrieved February 09, 2014
<Https://Www.E-Education.Psu.Edu/Geog863/Resources/L3_P4.Ht ml>.
[3] Geymen, A. (2012). “Interactive Web-Based Campus Information System” Retrieved February
09, 2014
<Academicjournals.Org/Article/Article1380798606_ Geymen.Pdf >
[4] Jacob, R., Zheng, J., Ciepluch B., Mooney, P., AndWinstanley, A. (2009). “Campus Guidance System For International Conferences Based On Openstreetmap”. Retrieved February 09, 2014 From
<Http://Www.Cs.Nuim.Ie/~Rjacob/Georesume/Pdf/ Papers/Rjacob-W2gis09.Pdf>.
[5] James, K. (2012). “3 Ways You Can Make Your Campus Photography More Interactive”. Retrieved
February 09, 2014
<Http://Www.Edsocialmedia.Com/2012/02/3-Ways- You-Can-Make-Your-Campus-Photography-More-Interactive/>.
[6] Kafood, M. (2011). “Interactive Campus Map For Pedestrian Navigation On Mobile Devices”.
Retrieved February 09, 2014 From
<Http://Webcache.Googleusercontent.Com/Search ?Q=Cache:Innwggrsseej:Www.Istudies.Net/Journa l/Sites/Default/Files/Interactive%2520campus%252 0map%2520for%2520pedestrian%2520navigation %2520on%2520mobile%2520devices.Pdf+&Cd=1 &Hl=En&Ct=Clnk&Gl=Ph>.
[7] Karpilo, J. (2010). “What Is A Map”. Retrieved
February 09, 2014
<Http://Geography.About.Com/Od/Understandmap s/A/Whatisamap.Htm>.
[8] Little, R. (2013). “16 Inspiring Examples Of Interactive Maps In Web Design”, Retrieved February 10, 2014 From <Http://Webdesignledger.Com/Inspiration/16- Inspiring-Examples-Of-Interactive-Maps-In-Web-Design>.
0 2 4 6 8 10 12 14 16 18 20
Re
sp
o
n
d
e
n
ts