A Study Of Employee Perceptions About
Performance Appraisal At Transnet
Engineering, South Africa
Zeleke Worku, Tshwane University of Technology (TUT) Business School, South Africa
ABSTRACT
Transnet Engineering is a division of Transnet, which is a key South African state owned enterprise that is responsible for providing railroad, freight and logistics services to South African and international business enterprises. Transnet Engineering is located at Koedoespoort, just outside Pretoria, South Africa. This manuscript is a result of data gathered from 198 employees of Transnet Engineering as part of an attempt made by the company to describe and quantify the perception held by employees of Transnet Engineering on the degree to which the performance of appraisal system used by the company for performance appraisal was suitable enough for its intended purpose. The perception of employees was measured by using a benchmark defined by Pichler (2012) in which similar measurements were made under near-identical circumstances. All measurements were taken based on a standardised, validated and pre-tested instrument. Pearson’s two-by-two chi-squared tests of associations, discriminant analysis and logit regression were used for analyses. The study found that about 63% of participants were happy with the performance appraisal system used by the company, whereas about 37% of participants held a negative perception. The results confirmed that the perception of employees about the performance appraisal system used at Transnet Engineering was affected by the perception of employees on fairness, and the assessment of performance of employees based on key performance indicators. Findings obtained from the study are quite relevant and valuable to all other South African state owned enterprises.
Keywords: Transnet Engineering; Performance Appraisal; Perception; Discriminant Analysis
INTRODUCTION
Transnet Engineering on the suitability of the performance appraisal system used by the company for performance assessment.
Transnet Engineering has adopted a performance appraisal system that is in line with the market demand strategy drawn up by the company. Aiston and Jung (2015) have shown that the overall productivity and degree of job satisfaction of employees working in large service delivery institutions such as Transnet Engineering is significantly associated with the perception held by employees about organisational behaviour and tools that are used for performance appraisal and monitoring. Harrington and Lee (2015) have shown that the perception held by employees on fairness, objectivity and good leadership is a key indicator of the confidence employees have on their companies. Callaghan and Coldwell (2014) have shown that sound performance appraisal systems embrace virtues such as professionalism, fairness, objectivity, accountability, consistency, efficient leadership, and due respect for basic human and labour-related rights of workers.
One key benefit of the research was that it could examine the merits of the performance appraisal system used by Transnet Engineering for assessing and evaluating productivity and job satisfaction in the company. Transnet Engineering is the most valuable division of Transnet as it is responsible for all engineering-related technical services that are performed by Transnet to the general public. As such, it is expected to fulfil the operational and technical requirements of Transnet adequately by utilising its logistical and human resources optimally. The enterprise cannot deliver on its mandate unless it assesses the suitability of tools used for performance appraisal. The research was carried out based on empirical data collected from employees of Transnet Engineering.
OBJECTIVE OF STUDY
The research was aimed at describing and quantifying predictors of perception held by employees about the suitability of the performance appraisal system used at Transnet Engineering for the assessment and evaluation of performance at the workplace. The research had two specific objectives:
• To explore the various perceptions that are held by employees about the effectiveness of the performance appraisal system used at Transnet Engineering; and
• To identify factors that affect the perception of employees about the suitability and effectiveness of the performance appraisal system used at Transnet Engineering.
LITERATURE REVIEW
A performance appraisal system is a tool that is commonly used by employers for assessing and evaluating overall productivity and job satisfaction among employees at the workplace. A good performance appraisal system enables employers and employees to perform optimally at the workplace, whereas a defective performance appraisal system results in the misuse and abuse of vital resources such as manpower, financial and logistical resources (Raziq & Maulabakhsh, 2015). A good performance appraisal system enables employees to identify individual strengths and weaknesses of employees at the workplace. It enables employers to identify suitable training and occupational needs that are helpful for improving productivity and job satisfaction. An effective performance appraisal system is vital for ensuring employee satisfaction and morale (Inkinen, 2016). It is also vital for identifying top-performing employees. The system is used worldwide for rewarding top-performing employees, and for meeting the training and occupational needs of underperforming employees. A suitable performance appraisal system is vital for achieving employee retention, capacity building, succession planning and sustained growth (Oswald, Proto & Sgroi, 2015).
specific periods of time, whereas performance management is used all the time for monitoring the degree of performance of employees (Top, Akdere & Tacan, 2015). An objective performance management system consists of a planning stage, supporting stage and assessment stage. The planning stage involves a process in which the line manager responsible for appraisal is adequately equipped for conducting appraisal. The supporting stage involves informing employees and all relevant stakeholders that appraisal is to be conducted against well-defined terms of reference and performance related goals and targets. The assessment stage entails the appraisal of employees against performance goals and objectives in a transparent, fair and objective process.
Pichler (2012) has shown that performance management has both advantages and disadvantages. Examples of advantages are the imporovement of performance by motivating employees to do better and be recognised for their good work by their supervisors, enabling lilne function mangers to know employees better by building relationships and providing support as required. Performance management enables workplace training, which in turn, enables employees to master operational skills and routines, thereby enhancing their degree of contribution to their companies. Performance management promotes change management in organisations that are exposed to intense competition from business rivals. Performance management helps line function managers and subordinates to collaborate mutually on issues that are vital for improved performance. It enables them to identify and fill up gaps at the workplace (Romiszowski, 2016). Research conducted by Inkinen (2016) has shown that performance management could result in negative outcomes in situations where it is not managed appropriately. Performance management encourages competition among employees, and this results in reluctance to share information freely. Performance management is inherently bureaucratic and biased. There are times when it fails to achieve what it is expected to achieve. Performance management involves the collection of data on too many key performance indicators. It is often difficult to do so (Platis, Reklitis & Zimeras, 2015). Scoring plays a vital role in the appraisal of employees. However, scoring must be conducted based on fair, transplant and objective guidelines. Scoring must be moderated independently in order to ensure objectivity. Scoring if prone to bias and lack of consistency. As such, scoring must be monitored and verified by independent assessors (Kallio & Kallio, 2014).
Aiston and Jung (2015) have pointed out that the provision of incentives to top-performing employees is quite helpful for retaining and motivating productive employees. Incentives are helpful for improving organisational performance. Iqbal, Akbar and Budhwar (2015) have pointed out three theories that are helpful for promoting sound performance appraisal at the workplace. These are the Expectancy Theory, the Social Exchange Theory, and Goal Setting Theory. All three theories are based on professionalism, honesty, personal integrity, consistency, verification, moderation, fairness, objectivity, transparency, good governance and sound leadership. All three theories support the principle of building capacity in employees who require workplace training on skills related areas. According to the three theories, employees are highly motivated at the workplace in cases where effort, performance and outcome are perfectly aligned.
Employees who are not rewarded for maximum effort often end up being underperforming employees as a result of being overlooked. A suitable performance appraisal system enables such employees to be acknowledged and rewarded in good time (Harrington & Lee, 2015). A suitable performance appraisal system enables employees to acquire necessary skills at the right time. When employees perform well or better than expected, a good performance appraisal system enables such employees to be readily identified and acknowledged. Prompt recognition and reward boosts morale and serves as a valuable lesson to other employees. In some cases, supervisors and their subordinates must agree on fairness and objectivity. Such issues require transparency, objectivity, fairness and moderation (Atkinson, 2012).
In performance appraisal, trust is a key factor in the sense that supervisors who do not have the trust and full confidence of employees are often shown to be not successful as leaders (Albert, Davia & Legazpe, 2018). Employees do not appreciate feedback from supervisors who are perceived to be weak or inefficient. Employees should be allowed to evaluate themselves based on their own perceived values and experience at the workplace. This assessment should be compared with assessment made by supervisors. Once that is done, the final step would be to explain discrepancies between the two sets of assessment. A good leader is fair to all employees. Pichler (2012) has developed a composite index for measuring the perception held by employees about the suitability of performance appraisal systems that are commonly used in service delivery institutions. A good leader is consistent. A good leader is driven by principles and objective facts. A good leader is free from bias. There are times when employees are treated unfairly due to sociodemographic characteristics such as gender, language group, political affiliation and religious persuasion. Good supervisors are leaders who do not deviate from performance related outputs with employees (Govindan, Rajendran, Sarkis & Murugesan, 2015).
METHODS
Data was collected from a stratified random sample of size 198 employees of Transnet Engineering at Koedoespoort in Pretoria, South Africa. This manuscript is a result of data gathered from 198 employees of Transnet Engineering as part of an attempt made by the company to describe and quantify the perception held by employees of Transnet Engineering on the degree to which the performance of appraisal system used by the company for performance appraisal was suitable enough for its intended purpose. The perception of employees was measured by using a benchmark defined by Pichler (2012) in which similar measurements were made under near-identical circumstances. All measurements were taken based on a standardised, validated and pre-tested instrument. Pearson’s two-by-two chi-squared tests of associations, logit regression (Hair, Black, Babin and Anderson, 2013) and discriminant analysis (Hair Jr, Wolfinbarger, Money, Samouel & Page, 2015) were used for identifying influential predictors of positive perception on the performance appraisal system used by Transnet Engineering for assessing the performance of employees. Discriminant analysis is suitable for classifying the 198 respondents who were selected for the study into 2 groups with regards to perception. Group 1 consists of employees who believe that the performance appraisal system used by Transnet Engineering for the assessment of performance was suitable for its intended purpose. Group 2 consists of employees who believe that the performance appraisal system used by Transnet Engineering for the assessment of performance was not suitable for its intended purpose. The Cronbach Alpha test (LoBiondo-Wood & Haber, 2014) was used for ensuring reliability in the study. All Cronbach Alpha coefficients had magnitudes of 0.70 or above, thereby showing that the questions used in the study were reliable enough. Validity was ensured by conducting a pilot study with a sample of size 20 eligible respondents at Transnet Engineering. The key aspects of validity were content and predictive validity (Saunders, Lewis, Thornhill & Bristow, 2015). A pilot study was conducted by administering the questionnaire of study to a simple random sample of 20 employees of Transnet Engineering.
RESULTS
Table 1. Socioeconomic profile of respondents (n=198)
Variable of study Percentage
Overall perception held by employees
Positive: (62.63%) 124
Negative: (37.37%) 63
Gender of employee
Male: (70.7%) 140
Female: (29.3%) 58
Age category of employees in years
25 years or younger (13.1%) 26
26 to 30 years (31.8%) 63
31 to 35 years (24.7%) 49
36 to 40 years (19.7%) 39
41 to 45 years (9.1%) 18
46 years or older (1.5%) 3
Job category of employee
Specialist (42.9%) 85
Analyst (12.1%) 24
Supervisor (22.7%) 45
Manager (22.2%) 44
Race category of employee
Black (19.7%) 39
White (61.6%) 122
Coloured (14.1%) 28
Indian (4.5%) 28
Duration of employment in years
2 years of less (30.81%) 61
3 to 6 years (43.43%) 86
7 years or more (25.76%) 51
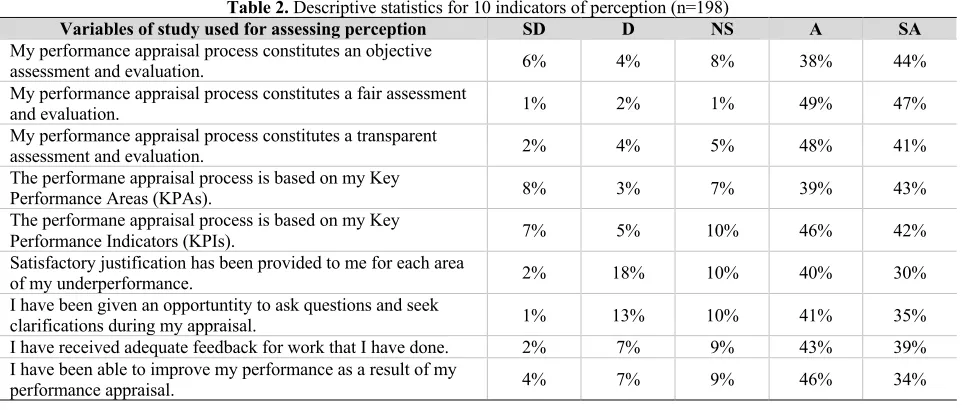
Table 2. Descriptive statistics for 10 indicators of perception (n=198)
Variables of study used for assessing perception SD D NS A SA
My performance appraisal process constitutes an objective
assessment and evaluation. 6% 4% 8% 38% 44%
My performance appraisal process constitutes a fair assessment
and evaluation. 1% 2% 1% 49% 47%
My performance appraisal process constitutes a transparent
assessment and evaluation. 2% 4% 5% 48% 41%
The performane appraisal process is based on my Key
Performance Areas (KPAs). 8% 3% 7% 39% 43%
The performane appraisal process is based on my Key
Performance Indicators (KPIs). 7% 5% 10% 46% 42%
Satisfactory justification has been provided to me for each area
of my underperformance. 2% 18% 10% 40% 30%
I have been given an opportuntity to ask questions and seek
clarifications during my appraisal. 1% 13% 10% 41% 35%
I have received adequate feedback for work that I have done. 2% 7% 9% 43% 39%
I have been able to improve my performance as a result of my
performance appraisal. 4% 7% 9% 46% 34%
The Pearson chi-square test of association (Chatterjee & Hadi, 2015) was used for performing a preliminary screening of influential factors that were significantly associated with the perception held by employees of Transnet Engineering about the suitability of the performance appraisal system used by the agency for assessing performance at the workplace. Table 3 shows a summary of estimates for five important predictors of perception.
Table 3. Factors associated with perception held by employees (n=198)
Factors Observed chi-square value P-value
My performance appraisal process constitutes a fair assessment
and evaluation (fairness) 9.5518 0.000
I have received adequate feedback for work that I have done
(feedback) 7.0089 0.000
The performance appraisal process is based on my Key
Performance Indicators (KPIs) 5.4906 0.000
I have been able to improve my performance as a result of my
performance appraisal (improve) 3.5454 0.000
Satisfactory justification has been provided to me for each area
of my underperformance (justification) 2.8787 0.000
The 5 predictor variables shown in Table 3 were subsequently used for performing discriminant and logit analyses. Equation (1) shows a discriminant function that was used for identifying factors that could be used for classifying respondents into one of two groups based on perception (employees who were satisfied with the performance appraisal system used in Transnet Engineering for the assessment of performance, and those who were not).
Equation (1)
where
Y = Satisfaction with performance appraisal (Yes, No)
Fairness = Perception about the degree of fairness of the performance appraisal system used by Transnet Engineering measured in a percentage score
Feedback = Perception about the efficiency with which feedback was given to employees measured in a percentage score
In Equation (1), the 3 predictor variables of study (fairness, feedback and KPI) were measured in standardised and validated percentage scores. The constants a, b and c are regression coefficients estimated from discriminant analysis. In cases where the regression coefficients a, b and c are useful for discriminating between the 2 categories of the dependent variable of study (perception held by employees about performance appraisal), values of the discriminant function D vary significantly depending on the 2 possible values of the dependent variable of study (satisfaction with performance appraisal). Stepwise discriminant analysis was used for identifying and quantifying the most influential predictor variables. This was done by estimating Eigen values, percentage of explained variation, the magnitude of Wilk’s lambda statistic and P-values. It was assumed that group membership is mutually exclusive and collectively exhaustive. Individual respondents who were selected for the study are assumed to be independent of each other.
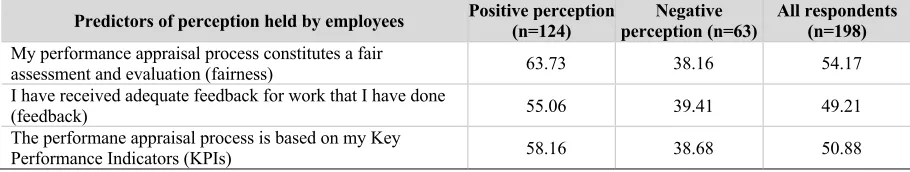
Table 4 shows standardised mean scores for 3 important variables that affect the perception held by respondents for 3 categories of respondents (124 respondents with positive perception, 63 respondents with negative perception, and all 198 respondents of study). The mean scores of the 3 predictor variables vary significantly. The mean score for fairness is relatively larger than that of KPI. The lowest mean score is that of feedback.
Table 4. Standardised mean scores of predictor variables (n=198)
Predictors of perception held by employees Positive perception (n=124) perception (n=63) Negative All respondents (n=198)
My performance appraisal process constitutes a fair
assessment and evaluation (fairness) 63.73 38.16 54.17
I have received adequate feedback for work that I have done
(feedback) 55.06 39.41 49.21
The performane appraisal process is based on my Key
Performance Indicators (KPIs) 58.16 38.68 50.88
Table 5 shows a table of correlation coefficients for 3 pairs of predictor variables. All correlation coefficients are significant (magnitudes greater than 0.30), thereby showing that the use of discriminant analysis is quite appropriate for performing data analysis.
Table 5. Correlation coefficients among pairs of predictor variables (n=198)
Pairs of predictor variables Correlation coefficient
Fairness by KPI 0.6123
Fairness by Feedback 0.5192
Feedback by KPI 0.4897
Table 6. Estimates obtained from discriminant analysis (n=198)
Pairs of predictor variables Correlation coefficient
Canonoical correlation coefficient 0.8326
Eigen value 2.25948
Calcualted value of F-statistic with degrees of freedom 3 and
194 146.11
P-value for F-test 0.0000
Table 7 shows standardized canonical discriminant function coefficients for the 3 predictor variables of study (fairness, feedback and KPI).
Table 7. Standardized canonical discriminant function coefficients (n=198)
Predictor variables Standardized canonical discriminant function coefficients
Fairness 0.61
Feedback 0.33
KPI 0.56
Based on etimates shown in Table 7, the estimated discriminant function could be expressed as shown below:
D = 0.61(fairness) + 0.33(feedback) + 0.56(KPI) Equation (2)
The estimated discriminant function (D) is statistically significant enough for classifying respondents into groups. Two of the 3 estimated regression coefficients (0.61, 0.33 and 0.56) are greater than 0.50. Thus, the variables fairness and kpi are useful for classifying respondents into one of two groups. The variable feedback is not important. Based on Equation (2), interpretation can be given readily for any one of the 3 predictor variables in the fitted model. For example, an increase of 1 standard deviation in the value of the predictor variable fairness results in an increase of 0.61 standard deviation in the predicted value of the discriminant function D.
The magnitude of the F-statistic is equal to 146.11 with degrees of freedom 3 and 194. The P-value is equal to 0.0000 < 0.05.
Null hypothesis: The canonical correlations are zero.
Alternative hypothesis: The canonical correlations are not zero.
At the 5% level of significance, the null hypothesis is rejected. We conclude that the estimated canonical correlations are significant. That is, the estimated discriminant function is valuable for classifying respondents into groups 1 and 2 fairly accurately.
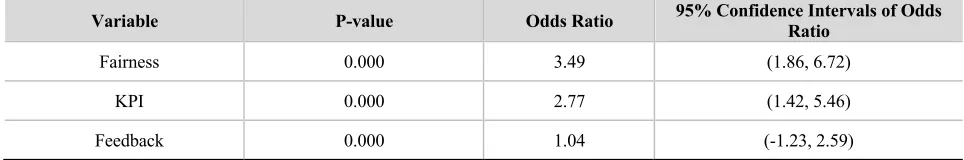
Table 8 shows comparative result estimated from logit analysis for the 3 predictor variables of study (fairness, feedback and KPI).
Table 8. Odds Ratios estimated from logit analysis (n=198)
Variable P-value Odds Ratio 95% Confidence Intervals of Odds Ratio
Fairness 0.000 3.49 (1.86, 6.72)
KPI 0.000 2.77 (1.42, 5.46)
The estimates shown above indicate that the variables fairness and kpi are useful for classifying respondents into one of two groups, and that the variable feedback is not important. The fitted logit model is highly accurate (94.5%) in classifying respondents accurately into one of two groups. A large P-value (0.1429) was obtained from the Hosmer-Lemeshow goodness-of-fit test. This confirms the adequacy of the fitted logit model. The odds ratio of the variable fairness is equal to 3.49. This indicates that an employee who is treated fairly is 3.49 times as likely to have a positive perception in comparison with another employee who is treated unfairly. The odds ratio of the variable KPI is equal to 2.77. This indicates that an employee who is assessed based on his or her KPI is 2.77 times as likely to have a positive perception in comparison with another employee who is not assessed based on his or her KPI.
DISCUSSION OF RESULTS
By the standards of Pichler (2012), about 63% of employees who took part in the study were happy with the performance appraisal system used by Transnet Engineering for the assessment and evaluation of performance, whereas about 37% of respondents held a negative perception about the suitability of tools used for performance appraisal. The perception of employees on the suitability of tools used for performance appraisal was significantly influenced by the perception of employees on fairness, and the assessment of performance of employees based on key performance indicators. Oswald et al. (2015) have found that there is a significant statistical association between happiness and productivity at the workplace. Platis et al. (2015) have found a significant association between job satisfaction and performance at the workplace in the healthcare industry. The authors have shown that it is worthwhile for employers to invest on the general working environment in which employees operate on a daily basis. The creation of an economically enabling environment requires sound leadership qualities (Romiszowski, 2016; Jung, 2014; Inkinen, 2016; Wilkin, 2013; Teelken, 2015; Top et al. 2015). The potential benefits of comprehensive monitoring and evaluation programmes has been highlighted by Wang and Liesveld (2015), Aiston and Jung (2015), Albert et al. (2018) and Atkinson (2012). Harrington and Lee (2015) have pointed out that line function managers must be fair and objective in performance assessment and appraisal exercises, and that performance appraisal must be consistent with key performance indicators that have been agreed upon at the beginning of the assessment period. Based on a study conducted among librarians working in Nigeria, Babalola and Nwalo (2013) have shown that having employees motivated at the workplace requires sound leadership qualities such as fairness, objectivity, accountability and transparency. Callaghan and Coldwell (2014) have highlighted the need for transformational leadership in which employees are actively encouraged and supported to own and promote a shared vision for the growth of their company. Shollen, Bland, Center, Finstad and Taylor (2014) have constructed a framework in which line function managers play the role of mentors. The framework constructed by the authors is based on the provision of skills-related workplace training opportunities to employees.
The “Hawthorne Effect” arises when employees change their performance or workplace behaviour depending on who assesses their performance and how assessment is made (Sedgwick & Greenwood, 2015). The most common causes that undermine the credibility of performance appraisal systems are bias due to sociodemographic characteristics, leniency, severity, recency, the effect of first actions, favouritism, the Halo Effect, the Hawthorne Effect, attributional bias, and salary increase. An appraisal system could be biased if it is affected by self-serving bias, social projection and false consensus bias. An appraisal process can easily be biased if there is a relationship between supervisors and employees. In such cases, supervisors could disregard weaknesses that are evident in their subordinates.
Harrington and Lee (2015) have shown that the credibility of performance appraisal procedures depends on the availability of supportive structures, flexibility, trust, due respect for ethical behaviour, personal integrity, honesty, professionalism, dignity and respect on the part of both employers and subordinates. Assessment made by line function managers must be duly moderated and verified. All relevant information must be made available to all parties at the start of the performance appraisal procedure. Wilkin (2013) has pointed out that line function managers must be prepared to accept constructive criticisms arising from their subordinates during performance appraisal procedures. The author has highlighted the need to provide empirical evidence for assessment made and decisions taken during performance appraisal sessions. Wang and Liesveld (2015) have shown that the success of performance appraisal processes are often hindered due to sharp differences in expectations in cases where performance appraisal is not based on key performance indicators and key performance areas that were mutually adopted by subordinates and their line function managers at the start of the performance appraisal period. According to Kallio and Kallio (2014) and Sedgwick and Greenwood (2015), findings obtained from this study are quite relevant and valuable to all other South African state owned enterprises.
AUTHOR BIOGRAPHY
Professor Zeleke Worku is an academic working at the Business School of Tshwane University of Technology (TUT) Business School in Pretoria, South Africa. Professor Worku’s key research interests are in small businesses, project management, service delivery, econometrics, monitoring and evaluation, statistical data mining, biostatistics, epidemiology and public health.
REFERENCES
Aiston, S.J. & Jung, J. (2015). Women academics and research productivity: An international comparison. Gender and
Education, 27(3), 205-220.
Albert, C., Davia, M.A. & Legazpe, N. (2018). Job satisfaction amongst academics: the role of research productivity. Studies in
Higher Education, 43(8), 1362-1377.
Atkinson, M. (2012). Developing and using a performance management framework: A case study. International Journal of
Productivity and Performance Management, 16(3), 47-56.
Babalola, G.A. & Nwalo, D.R.K.I.N. (2013). Influence of job motivation on the productivity of librarians in colleges of education
in Nigeria. Commitment, 3(5), 70-75.
Callaghan, C.W. & Coldwell, D. (2014). Job satisfaction and job performance: The case of research productivity. Journal of
Economics, 5(1), 97-113.
Chadwick, C., Super, J.F. & Kwon, K. (2015). Resource orchestration in practice: CEO emphasis on SHRM, commitment‐based
HR systems, and firm performance. Strategic Management Journal, 36(3), 360-376.
Dewa, C.S., Loong, D., Bonato, S., Thanh, N.X. & Jacobs, P. (2014). How does burnout affect physician productivity? A
systematic literature review. BMC Health Services Research, 14(1), 325.
Ensslin, L., Ensslin, S.R., Dutra, A., Nunes, N.A. & Reis, C. (2017). BPM governance: A literature analysis of performance
evaluation. Business Process Management Journal, 23(1), 71-86.
Froghi, S., Ahmed, K., Finch, A., Fitzpatrick, J.M., Khan, M.S. & Dasgupta, P. (2012). Indicators for research performance
evaluation: An overview. BJU International, 109(3), 321-324.
Govindan, K., Rajendran, S., Sarkis, J. & Murugesan, P. (2015). Multi criteria decision making approaches for green supplier
evaluation and selection: A literature review. Journal of Cleaner Production, 98(1), 66-83.
Harrington, J.R. & Lee, J.H. (2015). What drives perceived fairness of performance appraisal? Exploring the effects of psychological contract fulfillment on employees’ perceived fairness of performance appraisal in US federal
agencies. Public Personnel Management, 44(2), 214-238.
Hair Jr, J.F., Wolfinbarger, M., Money, A.H., Samouel, P. & Page, M.J. (2015). Essentials of Business Research Methods. New York: Routledge.
Hosmer, D.W. & Lemeshow, S. (2013). Applied Logistic Regression Analysis. New York: John Wiley & Sons.
Inkinen, H. (2016). Review of empirical research on knowledge management practices and firm performance. Journal of
Knowledge Management, 20(2), 230-257.
Iqbal, M.Z., Akbar, S. & Budhwar, P. (2015). Effectiveness of performance appraisal: An integrated framework. International
Journal of Management Reviews, 17(4), 510-533.
Jung, J. (2014). Research productivity by career stage among Korean academics. Tertiary Education and Management, 20(2),
85-105.
Kallio, K.M. & Kallio, T.J. (2014). Management-by-results and performance measurement in universities–implications for work
motivation. Studies in Higher Education, 39(4), 574-589.
Khamisa, N., Oldenburg, B., Peltzer, K. & Ilic, D. (2015). Work related stress, burnout, job satisfaction and general health of
nurses. International Journal of Environmental Research and Public Health, 12(1), 652-666.
LoBiondo-Wood, G. & Haber, J. (2014). Nursing Research-E-Book: Methods and Critical Appraisal for Evidence-Based
Practice. New York: Elsevier Health Sciences.
Oswald, A.J., Proto, E. & Sgroi, D. (2015). Happiness and productivity. Journal of Labor Economics, 33(4), 789-822.
Pichler, S. (2012). The social context of performance appraisal and appraisal reactions: A meta‐analysis. Human Resource
Management, 51(5), 709-732.
Platis, C., Reklitis, P. & Zimeras, S. (2015). Relation between job satisfaction and job performance in healthcare services.
Procedia-Social and Behavioral Sciences, 175(1), 480-487.
Raziq, A. & Maulabakhsh, R. (2015). Impact of working environment on job satisfaction. Procedia Economics and Finance,
23(1), 717-725.
Romiszowski, A.J. (2016). Designing instructional systems: Decision making in course planning and curriculum design. New
York: Routledge.
Saunders, M.N., Lewis, P., Thornhill, A. & Bristow, A. (2015). Understanding Research Philosophy and Approaches to Theory
Development. Harlow: Pearson Education.
Sedgwick, P. & Greenwood, N. (2015). Understanding the Hawthorne effect. British Medical Journal, 351(1): 4672.
Shollen, S.L., Bland, C.J., Center, B.A., Finstad, D.A. & Taylor, A.L. (2014). Relating mentor type and mentoring behaviors to
academic medicine faculty satisfaction and productivity at one medical school. Academic Medicine, 89(9), 1267-1275.
South African Auditor-General. (2018). Annual Report for the financial year 2016/2017. [Online]. Available from:
http://www.df.gov.za/reports/index.asp [Accessed: 09 May 2019].
Teelken, C. (2015). Hybridity, coping mechanisms, and academic performance management: Comparing three countries. Public
Administration, 93(2), 307-323.
Top, M., Akdere, M. & Tarcan, M. (2015). Examining transformational leadership, job satisfaction, organizational commitment
and organizational trust in Turkish hospitals: Public servants versus private sector employees. The International
Journal of Human Resource Management, 26(9), 1259-1282. Transnet (2018). Integrated Report 2018. [Online]. Available from:
https://www.transnet.net/InvestorRelations/AR2018/Integrated%20Report.pdf [Accessed: 09 May 2019].
Wang, Y. & Liesveld, J. (2015). Exploring job satisfaction of nursing Faculty: theoretical approaches. Journal of Professional
Nursing, 31(6), 482-492.
Wilkin, C.L. (2013). I can't get no job satisfaction: Meta‐analysis comparing permanent and contingent workers. Journal of