Application Business Intelligence For Policy
Decision
Asfiyan, Abba Suganda Girsang
Abstract: The purpose of this study was to design device flexible business intelligence software that is intended for managers to be able to analyze data to help make decisions. Components that will be displayed in OLAP Analysis and Design Reports and Dashboards. This result will be used as a reference to build Business Intelligence, data warehouse and web reporting. The data warehouse designed in this study is very helpful in processing daily transaction data generated and stored in OLTP databases (Online Transactional Processing) into data that can be analyzed as Online Analysis Processing data using the Qlik Sense tool. BI reports are designed to help in making research reports and can be tailored to the needs, so the problem of making reports can be overcome without using complicated programing codes. BI Dashboard designed in this research, certainly very helpful for leaders in analyzing data to support decision making and can also be used to study sales trends and market analysis.
Index Terms: olap analysis, data warehouse, web reporting, business intelligence, real estate. ————————————————————
1
I
NTRODUCTIONCOMPETITIVE business environments require companies to collect, analyze, and interpret large amounts of data to enable better and more appropriate decision making[1]. In addition, the company is required to be able to maximize, and manage all existing data quickly (within a few hours or even in a few minutes) and efficiently in one container that can be accessed anytime and anywhere. Besides that, the company currently does not have an integrated system to analyze the property development process, financial analysis or analysis of financial projections for each project and analysis of prospective customers about the tendency for bad credit to occur. Associated with BI and its relationship with the data warehouse says that BI, in the context of a data warehouse, is the ability of a company to study past behavior and actions in order to understand where the organization is, determine the current situation, and predict or change what will happen in the future front [2]. BI and analytics will support the growth of data source. data source rapidly grow within organization[3]. BI related topics and concepts are very numerous and very popular both from professionals and academics, this shows high enthusiasm among researchers and the use of BI among businesses [4]. BI has been applied in various domains to make better decisions and provide different levels of information to stakeholders in accordance with information needs[5]. Models of BI[6]: (1) Data marts model used to perform ad hoc analysis, comparative analysis or for reporting to a narrow scope and limited to a several departments. Reporting tools usually used such as, OLAP, or just using tool a simple visualization.
OLAP is used to organized information and helped to get analytic conclusion by using different slices of data[7]. (2) Data Warehouse Model is used to perform multi-dimensional analysis that includes operational decisions, tactical and strategic organization. The tool used is OLAP and data mining. (3) BI with Predictive[8] Analysis (PA), This PA model is used to conduct analysis and prediction with various kinds of scenarios with narrow coverage and limited to certain departments. Tool use is OLAP, AP, ERGMs, data mining[9]. (4) Real-Time BI Model is used to monitor current activities and to find activities irregularly with a narrow scope and limited to a department. Tool use is EII, OLTP, in-memory Data bases. (5) BI Corporative Model Corporative BI is widely used in the management of the company in building loyalty strategy with operational decisions, tactical and strategic organization. The tool used is Extract Transform and Load (ETL)[10], data mining, dashboard. BI Portals, Model BI Portals contain Content management, document management, and working groups, with coverage limited to a several communities for decision making operational, tactical and strategic organization. tool, Spoken Text mining web mining, CMS, work group, personalization techniques, interactive visualization. (6) BI Nets Model provides expert networks with coverage in the capital management for the global community decision making operational, tactical and the group or individual level. Tool used Web mining, opinion mining, text mining, search-based applications, cloud computing, interactive visualization tools. (7) BI for every-one Model was used to build a network of social capital with a global scope, the tool used Mobile, social media, semantic web, web mining, opinion mining, cloud computing, search-based applications, interactive visualization tools
2
C
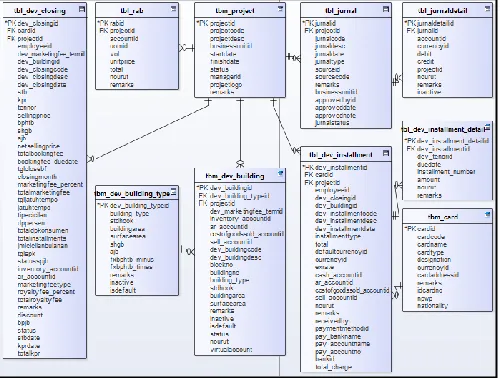
ASE STUDYThe data source used to build the data warehouse get from ONIQ Property Management Systems are OLTP applications with limited features that function to record daily transactions, customer data, marketing agent data, record consumer installment data, billing information. The Fig.1 shows Entity Relationship used as the source of data in this research using the Postgres database.
______________________________
Asfiyan currently pursuing masters degree program at Computer Science Department, BINUS Graduate Program-Master of Computer Science, Bina Nusantara University, Jakarta, Indonesia 11480, Email:
Abba Suganda Girsang S.T., M.Cs., Ph.D is currently a lecturer at Computer Science Department, BINUS Graduate Program-Master of Computer Science, Bina Nusantara University, Jakarta, Indonesia 11480, Email:
Fig. 1. Entity Relationship Diagram
following are the needs needed, in this case study[11]: (1) Project Dashboard which is visualized in the form of a chart to make it easier for leaders to understand. This Project Dashboard will display measures that can be in the number of units, number of consumers, number of estimates, etc., per certain period according to the specified time parameter. (2) OLAP Analysis that can display historical progress data based on project, region, type of house, and so on from time to time both daily, monthly and yearly. (3) The need for web-based reports, so that they are easily accessed anytime and anywhere. (4) Requires a server as a depository from the data warehouse and web reporting so as not to interfere with transaction processing on the OLTP database server. OLAP technology allows an analyst, manager and executive to simultaneously access data quickly, consistently and interactively with various variations and visualization of information reviews where each row of data can be transformed to reflect the dimensions of the company or organization so that it is easily understood by users or users[12][13]. Aggregation operation at different levels of the dimensional hierarchy can be done moving up or down by reducing one dimension. The Decision Support System is defined as an interactive information system based on computers that is designed to support solutions to a complex problem encountered in managing public, private and organizational companies[14]. The most important selection of processes or operational activities in business processes is also the easiest to extract the data, in this case by modeling the process on the customer installment schedule form and from reports from customer invoices or monthly reports. In addition to the easily accessible data sources, it is also quite high quality. Fig. 3. used as the initial document in the analysis process.
Fig 3. Installment Schedule
3
S
YSTEM DESIGNThe stages in designing the following Data Warehouse are stages of Development of Data warehouses & ETL Tools from the Vercelli’s method. Data sources are taken from OLTP databases which are generated from daily transaction processes recorded into stored databases, the database will then be used as the main data source in designing the data warehouse, namely in the ETL process. Execution time and complexity data access performance should be considered by designers before Data Warehouse designed[15].
Fig 4. Star Schema
The physical form of a star scheme design as shown in Figure 4, designed for the analysis process. a star schema contains fact table surrounded by dimension tables[16]. To simplify the process the author will create a Job [17] and that contains the process Transformation Fig. 5. from the dimension tables and fact tables, the process is shown in Fig, 5.
dm PostgreSQL
closing_facttable «column» *PK closingid_pkey: bigint FK projectid_pkey: bigint FK unittypeid_pkey: bigint FK customertypeid_pkey: bigint FK locationid_pkey: bigint FK periodid_pkey: bigint
sellingprice: numeric bookingfee: numeric installment: numeric netsellingprice: numeric kpr: numeric version: varchar(200) date_from: timestamp(6) without time zone date_to: timestamp(6) without time zone date_insert: timestamp(6) without time zone
date_update: timestamp(6) without time zone dim_customertype «column» *PK customertypeid_pkey: bigint
customertype_name: varchar(100) version: varchar(200) date_from: timestamp(6) without time zone date_to: timestamp(6) without time zone date_insert: timestamp(6) without time zone date_update: timestamp(6) without time zone dim_location
«column» *PK locationid_pkey: bigint
location_name: varchar(100) version: varchar(200) date_from: timestamp(6) without time zone date_to: timestamp(6) without time zone date_insert: timestamp(6) without time zone date_update: timestamp(6) without time zone
dim_period «column» *PK periodid_pkey: bigint
period_date: date period_day: integer week_label: varchar(100) period_week: integer period_month: integer month_label: varchar(100) period_quarter: integer quarter_label: varchar(20) period_year: integer version: varchar(200) date_from: timestamp(6) without time zone date_to: timestamp(6) without time zone date_insert: timestamp(6) without time zone date_update: timestamp(6) without time zone
dim_project «column» *PK projectid_pkey: bigint
project_code: varchar(100) project_name: varchar(255) version: varchar(200) date_from: timestamp(6) without time zone date_to: timestamp(6) without time zone date_insert: timestamp(6) without time zone date_update: timestamp(6) without time zone
dim_unittype «column» *PK unittypeid_pkey: bigint
Fig. 5. ETL Process Job Integration
Design Fig. 5. to simplify and show the tasks to be executed in the ETL process.
3.1. ETL Process Project Dimensions
The process in this dimension Fig. 5. aims to display data based on the project, for example is sales data based on the project.
Fig. 6. ETL Process Project
The steps in this process consist of: 1. Get Table Project
This step will generate a project list, result from this process is shown in Fig. 7. Displaying project list
Fig. 7. Preview Process Dim Project
Figure 7 describes the result of ETL process from OLTP data into dimension table Dim Project.
2. Select & alter table project
This process aims to select and filter project data that will be used and stored in the data warehouse
Fig. 8. Process Select tblproject
Figure 8 shows process of data filtering to filter required data project into dimension table dim_project.
3.2. ETL Process Installment Dimensions
Fig. 9. ETL Process Installments
Figure 8 is required to do the transformation from table OLTP table installment, on second step is selecting and altering then on third step to sort data as required and finally load the data into dimensions table installment type. Steps in the ETL process The Unit Dimension consists of: 1. Get table
This step will generate installment type list, result from this process is shown in Fig. 10. Displaying installment type list
Fig. 10. install type Dimensions Select & alter dimension
Figure 10 describes the result of ETL process from OLTP data.
Fig 11 - Select table installment and Sort by type of installments.
Figure 11 shows a process of selecting required field or rename it into appropriate field.
2. Sort by installment type
Fig. 12. Sort by installment type
The process in Fig. 12. Is used to sort appropriate field and continue the process to next process as shown in Fig. 13. 3. Load to installment dimension
The process in Fig. 12 below is the final process or output of the unit type ETL that aims to enter and update data in the table dim installment
Fig 13 - Load Installed
3.3. Designing OLAP Cube Schemes The
Design of the OLAP cube scheme is one of the stages of Development of Applications method[13]. The author uses Pentaho [18] Schema Workbench in designing the OLAP Cube scheme, the version used is 3.14.0.0-12. The following are the steps and results of the design of OLAP
Cube that I have designed [7]: (1) Making a connection to a data warehouse database. Before creating the OLAP Cube schema, the first step is making connection to the previously created data warehouse database. (2) Creating the Dim Project Hierarchy. As shown in figure 14. Project dimensions are taken from the Dim Project with the Foreign Key and will be used as a link if using the Project dimension.
Fig 14 - Dim Project
(3) Create Hierarchy Dimensions periods, this dimension is taken from Dim Period. (4) Create Dimension Periods, this dimension is taken from Dim Location (5) Create Dim Type of Installment, from Dim Type Installments which will be used as a link if using the installment type dimension. (6) Create Dim Unit Type, this dimension is taken from the Dim Unit Type. (7) Create Cube Closing, several dimensions and measures that will be calculated and made into the analysis process, the base table of the cube is taken from the fact table as shown in the following Fig. 14
3.4. Designing Dashboard and BI Report
BI system is the most Software product recently needed[19] the first step in creating BI dashboard is to create a new application or project in Qlik Sense software (Figure 15).
Fig. 15. Cube Closing
Fig. 16. Adding Data Sources
The next step is to connect to the data warehouse database, this proses shown in Figure 17.
Fig. 17. Database connection settings
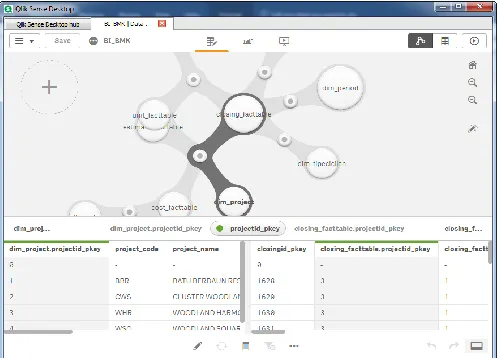
As shown in Figure 18, is to associate or link between table dimensions and fact tables through primary and foreign key.
Fig. 18 - Association settings Closing Fact Table and Dim
Project
The next step is to associate or link between table dimensions and fact tables between Dim Period and
Closing fact table, associate between Dim Installment Type
and Closing Fact Table, and then associate between Dim
Location and Closing Fact table, and the last step is making association between dimension Unit Type and Closing Fact Table.
4
T
OOLS AND DEVELOPMENTPentaho is a comprehensive platform used to access, integrate, manipulate, visualize, and analyze data, data stored in files, relational databases, Hadoop, NoSQL databases, analytic databases, social media, operational and databases cloud[20][8]. Pentaho can help users analyze and visualize data for ordinary users who do not have programming experience or for users with programming experience to create reports, queries, and transformations with wider functionality[21]. Pentaho products include web-based components and design tools that can be used in accordance with workflows or processes in the business environment, including the following[18]:
4.1. Web-based Components-based
Pentaho web components are used to share BI solutions by analyzing data, making reports, and creating dashboards integrated, which consists of: (a) User Console, Pentaho User Console (PUC) is a design environment for accessing Analyzer, Interactive Reports, and Dashboard Designer. PUC also offers system administration features for configuring the Pentaho Server. (b) The Analyzer, Analyzer helps in visualizing data to make the right business decisions. With this tool you can create geographic graphics, scatter charts, heat grids, and multi-chart visualization. And this tool can filter data, add query parameters, Config drill-down links, apply conditional formats, and generate hyperlinks. (c) Interactive Reports Interactive, Report is a design interface that is used to create simple and demand-based operational reports without relying on IT developers or reports. So that users can add elements to the report quickly and format it according to their wishes. (d). Dashboard Designer, Dashboard Designer is used to choose the layout of templates, themes, and content to create an attractive dashboard visualization that helps decision makers get information at a glance. And can be combined with a variety of content including Interactive Reports, Visualization Analyzers, and collaborative content. (e) C Tools, community-based framework for creating dashboards using web technologies such as JavaScript, CSS, and HTML. It can also easily create dynamic dashboards so that users can easily understand large data, using charts, tables and other components. (f) Data Source Wizard, a tool that can help users to determine data sources by guiding through creating a relational or multidimensional model for use in making reports and analysis. (g) The Data Source Model Editor is used to help organize and improve relational and multidimensional data models. Just drag fields to the appropriate location, mix and match fields from different tables, add fields to more than one category, or delete fields.
4.2. Design Tools
(Extraction, Transformation, and Loading) that capture, clean, and store data using a uniform format so that it can be accessed and relevant to end users and IoT technology. (b) The Report Designer, Report Designer is used to produce detailed reports using all data sources. This allows BI professionals to make reports with very detailed print quality based on adequate data prepared. (c) Aggregation Designer, Aggregation Designer is used to design aggregation and provide a simple interface for creating combined tables of levels in the specified dimensions and to improve the performance of Pentaho Analysis (Mondrian) OLAP cubes. (e) Metadata Editor, The Metadata Editor is used to simplify report generation. This editor can also be used to build Pentaho domains and metadata models. Pentaho Metadata Maps models from the physical structure of the database into a logical business model. (f) The Schema Workbench, Schema Workbench is used to edit and create multidimensional (Mondrian) models graphically or define them with manually created XML files.
5
R
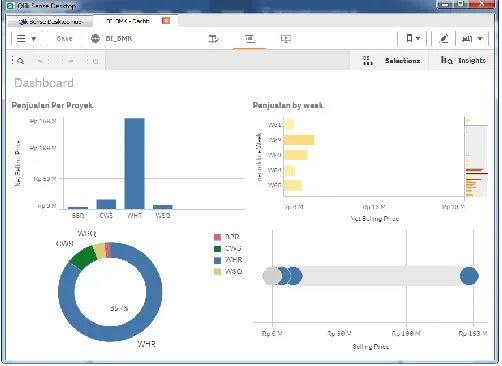
ESULTSAfter associating each dimension, the next step is to design the dashboard according to the needs, as shown in Figure 19. There are 4 categories of charts designed: Sales Chart Per Project, is display the overall sales amount based on the project, so that it can be used as a reference for decision makers in achieving the specified sales target, which is based on the amount of sales displayed by each project. Sales Chart Per Week, the sales value of all units in all group projects per week, other uses are to filter the sales value for each week in one year. Chart Percentage of Sales by Project is to see the amount of sales progress for each project, this data can be used as a reference to see sales comparisons per project, then if the user wants to see details of data sources, users can rolldown until the data the smallest. Per Month Sales Project Per Project, to see the value of sales in each month and in each project besides this Chart also has features in rollup and rolldown if the user wants more detailed information from the chart displayed
Fig. 19. Designing a Sales Dashboard
Figure 19 shows summary information in dashboard view, there are bar chart for sales by project, sales by current
week by bar chart, and pie chard is describing a sales summary data by project. And summary for Net Selling price.
Fig 20.- Designing a Sales Dashboard by Unit Type
Figure 20 shows summary information for sales by type of unit. This information is required for management to see what unit type is first sold in the period of time. Management could use this data for guidance to do the development for unit types for next future project.
Fig. 21 - Monthly Dashboard Design
Figure 21 describes a summary information of monthly sales by comparing Unit Type and Unit Price. This information is required by management to decide what unit type should be developed in next future development, what unit type is bought the most in previous period of selling back log.
6
C
ONCLUSIONreports are designed with Qlik Sense helping in making research reports and can be tailor made as needed, so there will be no difficulties in generating the reports for future project development. By designed BI Dashboard in research, it is certainly very helpful for decision maker in analyzing data to support decision making and be used to study sales trends and market analysis. Authors suggests incorporating the usage of Data mining in Data warehouse to do sales prediction analysis and effectiveness sales pattern implemented in marketing division.
7
R
EFERENCE[1] K. Foster, G. Smith, T. Ariyachandra, and M. N. Frolick, ―Business Intelligence Competency Center: Improving Data and Decisions,‖ Inf. Syst. Manag., vol. 32, no. 3, pp. 229–233, 2015.
[2] C. Imhoff, N. Galemmo, and J. G. Geiger, Mastering Data Warehouse Design: Relational and Dimensional Techniques. Wiley Publishing, Inc. [3] M. Murugesan and K. Karthikeyan, ―Business
Intelligence Market Trends and Growth in Enterprise Business,‖ Int. J. Recent Innov. Trends Comput. Commun., vol. 4, no. 3, pp. 188–192, 2016.
[4] K. Kasemsap, ―The Fundamentals of Business Intelligence,‖ Int. J. Organ. Collect. Intell., vol. 6, no. 2, pp. 12–25, 2016.
[5] M. Aruldoss, M. Lakshmi Travis, and V. Prasanna Venkatesan, ―A survey on recent research in business intelligence,‖ J. Enterp. Inf. Manag., vol. 27, no. 6, pp. 831–866, 2014.
[6] C. M. Olszak, ―Toward Better Understanding and Use of Business Intelligence in Organizations,‖ Inf. Syst. Manag., vol. 33, no. 2, pp. 105–123, 2016. [7] S. N. Kane, A. Mishra, and A. K. Dutta, ―Preface:
International Conference on Recent Trends in Physics (ICRTP 2016),‖ J. Phys. Conf. Ser., vol. 755, no. 1, 2016.
[8] C. Hazen, Benjamin;Skipper, Joseph;Ezell, Jeremy;Boone, ―Big Data and Predictive Analytics for Supply Chain Sustainability: A Theory-driven Research Agenda,‖ Comput. Ind. Eng., vol. 101. [9] A. S. Syed Fiaz, N. Asha, D. Sumathi, and A. S.
Syed Navaz, ―Visualization: Enhancing big data more adaptable and valuable,‖ Int. J. Appl. Eng. Res., vol. 11, no. 4, pp. 2801–2804, 2016.
[10] J. P. A. Runtuwene, I. R. H. T. Tangkawarow, C. T. M. Manoppo, and R. J. Salaki, ―A Comparative Analysis of Extract, Transformation and Loading (ETL) Process,‖ IOP Conf. Ser. Mater. Sci. Eng., vol. 306, no. 1, 2018.
[11] J. Completo, R. S. Cruz, L. Coheur, and M. Delgado, ―Design and Implementation of a Data Warehouse for Benchmarking in Clinical Rehabilitation,‖ Procedia Technol., vol. 5, pp. 885– 894, 2012.
[12] S. Bāliņa, R. Žuka, and J. Krasts, ―Opportunities for the Use of Business Data Analysis Technologies,‖ Econ. Bus., vol. 28, no. 1, pp. 20–25, 2016.
[13] C. Vercellis, Business intelligence: data mining and optimization for decision making. 2009.
[14] V. L. V. L. Sauter, Decision Support Systems for Business Intelligence: Second Edition. 2011. [15] M. Benjelloun, M. El, and E. Amin, ―Using
Snowflake Schema and Bitmap Index for Big Data Warehouse Volume,‖ Int. J. Comput. Appl., vol. 180, no. 8, pp. 30–32, 2017.
[16] E. Sidi, M. El, and E. Amin, ―Star Schema Advantages on Data Warehouse: Using Bitmap Index and Partitioned Fact Tables,‖ Int. J. Comput. Appl., vol. 134, no. 13, pp. 11–13, 2016.
[17] A. Amine, R. A. Daoud, and B. Bouikhalene, ―Efficiency comparaison and evaluation between two ETL extraction tools,‖ Indones. J. Electr. Eng. Comput. Sci., vol. 3, no. 1, pp. 174–181, 2016. [18] H. Vantara, ―Hitachi Vantara: Pentaho
Documentation,‖ 2017. [Online]. Available: https://help.pentaho.com/Documentation/8.0/Produc ts. [Accessed: 02-Aug-2018].
[19] S. Klisarova-Belcheva and G. Ilieva, ―Business intelligence and analytics – contemporary system model,‖ Trakia J. Sci., vol. 15, no. Suppl.1, pp. 298– 304, 2018.
[20] V. M., A. Syed, A. Mohammad, and M. N., ―Pentaho and Jaspersoft: A Comparative Study of Business Intelligence Open Source Tools Processing Big Data to Evaluate Performances,‖ Int. J. Adv. Comput. Sci. Appl., vol. 7, no. 10, pp. 20–29, 2016. [21] P. Hawking and C. Sellitto, ―A Fast-Moving