300
Functionality And Efficiency Measurement Of
Corporate Payable ERP System Development As
One Gate Payment To Vendor
Nyoman Diah Kumara Dewi, Muhardi Saputra, R. Wahjoe Witjaksono, Deden Witarsyah, Marheni Eka Saputri
Abstract: The importance of system quality testing in a software will prove that software is feasible to be used and applied in a company. Functionality of a system will provide on how well the ability of software. The ability of software that has complex capabilities will help companies in managing business processes in accordance with company goals and are able to carry out operational activities with efficient time and appropriate use of resources. In the system quality testing carried out in this study related to ERP system namely One Gate Payment (OGP). To test the quality of OGP system is uses a system quality standard ISO 9126 that focuses on system functionality and efficiency. The results of this study are in the form of recommendations in terms of interoperability of system functionality, taken based on the lowest data that has been tested using measurement test ing. The recommendation of functionality system is to implement SAP EDI that can be used to handle differences format data to send data manually and automatically by Host-to-Host (H2H) from SAP system core to the non-SAP system, which will improve interoperability of functionality system and automatically improve the quality system in the OGP system.
Index Terms: ERP System, SAP, System Quality, Functionality, Efficiency, ISO 9126, Payment Gateway
—————————— ——————————
1 INTRODUCTION
he development of technology and information systems currently has a large influence on the company, so that the company requires to operate and competently well [1]. In the development of information systems, many national and international companies have moved from separate systems to integrated information systems. In the transfer of the application, the quality of the system also has an important role in the success of the system applied, because the quality of the system is a measurement of an information system process that focuses on the results of interaction between the user and the newly implemented system, to be more efficient and effective [2]. Along with the increasing complexity of processes and operational functions within the company, the need arises for the need for an information system that integrates all functional areas of the company to provide benefits in terms of productivity and performance and competitive advantage of companies and relies on information in making decisions using ERP (Enterprise Resources Planning) [3 ], which is able to support the company by providing solutions to meet the needs and objectives of the company by integrating all the functions that exist within a company [4]. Regarding this, some large companies that are developing at this time apply the concept of an ERP system to have good quality. One of the big telecommunications companies in Indonesia has implemented an ERP system using one of the ERP software or tools, namely System Application and Product (SAP).The SAP system that is used as an information system in processing all data with the availability of integrated applications will perform calculation and compensation management, cost planning employees, management of official travel and management for training, and increase employees and management involvement directly in personal data management, as well as employee data under the coordination of a management [3]. One of the systems used in telecommunications companies is namely One Gate Payment system (OGP). OGP is a system developed to conduct transactions related to banking matters to vendors through online transactions or E-payment in real-time. The purpose of the establishment of the OGP system is to meet the needs of companies to process payments to partners / third parties automatically from ERP core system and Host-to-Host (H2H) into the Bank's core ERP system which will then forward transactions or payments to the vendors. According to Delone and McLean, ―an application system quality is a characteristic of the inherent information about the application system itself where the quality of the application system refers to how well the capabilities of hardware, software and procedure policies of the information application system can provide information on user needs‖ [5]. Seeing the ERP OGP system has been established for almost 9 (nine) years, then system quality testing is needed to measure the function in system quality specifically especially in terms of functionality. According to Melathi, in the results of the system quality research conducted stated that the variable functionality and efficiency have relevance, especially in the time behaviour variable. With this, measurement in terms of efficiency has a big influence in determining performance in system functionality including in the utilization of resources in operations, costs and time needed in the operation of a function in a system [6]. The compatibility of the characteristics possessed by ISO 9126 with testing in measuring the quality of ERP systems is estimated to be compatible with compatibility, modularity, complexity, and usability that have been involved as sub-characteristics under the sub-characteristics of function, usability, and maintenance [7]. The purpose of this study is to measure and determine the quality of OGP systems and provide recommendations based on the results of system quality T
————————————————
Nyoman Diah Kumara Dewi, Information System Department, Telkom University, Bandung, Indonesia, [email protected]
Muhardi Saputra, Information System Department, Telkom University, Bandung, Indonesia, [email protected]
R. Wahjoe Witjaksono, Information System Department, Telkom
University, Bandung, Indonesia,
Deden Witarsyah, Information System Department, Telkom University, Bandung, Indonesia
301 testing that focuses on system functionality and efficiency
using the ISO 9126 standard.
2
LITERATURE
REVIEW
2.1 Enterprise Resource Planning
Enterprise Resource Planning (ERP) is a set of integrated architectural software modules that serve to connect and handle information between various corporate functions to a centralized database [8]. ERP was developed to support efficient business processes by integrating business activities within companies such as marketing, sales, production, logistics, accounting to human resources used in companies [9]. ERP also makes it possible to integrate globally, where obstacles that have been in the form of currency, language, and cultural differences can be bridged automatically so that data can be integrated [10] Enterprise Resource Planning (ERP) is a software intended for companies to integrate and automation some business processes using a database. ERP has a basic concept as an information system that integrates the information or data from all the functional parts of the company, so that each piece can use more accurate data section [8]
2.2 System Application and Product
The Application System and Product in Data Processing, better known as SAP, is one of the ERP software or tools that was developed to support an organization or company in carrying out its operational activities by integrating departmental systems centrally and allowing information to be shared among functional fields [11]. SAP has the ABAP programming language that makes it easier for developers to implement business logic, so that the usefulness of SAP will be customized according to company requirements
2.3 Quality System
System quality is a process of measuring information systems that focuses on the results of interactions between users and systems [12]. According to Bharati and Chaudury, the quality of the system can be explained as the overall performance of the information system contained in the company [13]. To get good performance in implementing an ERP system, adequate ICT infrastructure support is needed. ERP implementation which means adding new file structures, new module functions, and new report writing will improve the software and will support companies to improve the quality and operating systems and new databases to suit system requirements.
2.4 ISO 9126
International Organization for Standardization (ISO) in ISO Standard 9126 is an evaluation framework or quality testing software with a purpose to determine software quality models and a set of guidelines for measuring related characteristics or variables [14]. A set of characteristics and relations to test the quality of software. ISO 9126 identifies 6 (six) characteristics of software that are said to be of quality, namely: functionality, reliability, usability, efficiency, maintainability, and portability. Based on the important background of a quality system in terms of functionality and efficiency, the variables used in this study are Functionality and Efficiency, and the variable quality in use that is used is effectiveness.
Fig. 1 - ISO 9126 Model
1. Functionality: an attribute that supports the existence of a specified set of functions and properties. Its function is to meet the needs stated or implied in the company. With 5 (five) sub-variables are suitability, accuracy, interoperability, standardization, and security.
2. Efficiency: is a set of attributes that support the relationship between the level of performance of the software and the amount of resources used in the stated time condition. efficiency has sub-variables which are stated to be able to support measurement in efficiency, are time behavior, and resource utilization.
Fig. 2 - ISO 9126-4 Quality in Use
One of the variables used in measuring the quality of the system in terms of use in functionality and efficiency is the Effectiveness variable. The Effectiveness variable can describe the ability of a system that allows users to arrive at a destination with accuracy and completeness in the context of a predetermined use
3 RESEARCH
METHOD
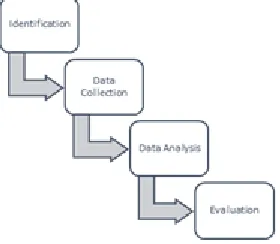
Research method is a descriptive elaboration with the steps taken in building the IT Artifact during the research. IT Artefact in this study is the results of hypothesis testing and system recommendations based on the results of the analysis using a system quality test with ISO-9126 standards that focus on functionality and efficiency in the OGP ERP system.
302 The steps taken in analyzing the quality of the system to get IT
Artefact using the ISO-9126 standard, namely conducting the identification stage, data collection stage, data analysis stage, evaluation stage in decision making in the form of recommendations and solutions for the OGP ERP system.
4 RESULT
AND
DISCUSSION
The case in this study is analyses the quality of OGP systems, focused on functionality and efficiency system because systems that have been established more than 5 (five) years is needed to be measured whether the system is feasible to be developed, maintained, update, continued or stopped.
4.1 Test Validity and Reliability
In testing the validity and reliability of this study using the help of SPSS 25 software. The number of respondents to this questionnaire was 86 people. To measure rtabel follows a degree of freedom. The formula df is df = N-2 which means df = 86 - 2 which is df = 84 (with a significance of 5%). Which means the value of rtable = N = 84 = 0.2120. The results of the validity test on all variables in this study are valid. Whereas for the minimal reliability test the value of Cronbach's Alpha (α) is 0.6 [15]. The reliability test results for all variables are reliable.
4.2 Outer Model Analysis
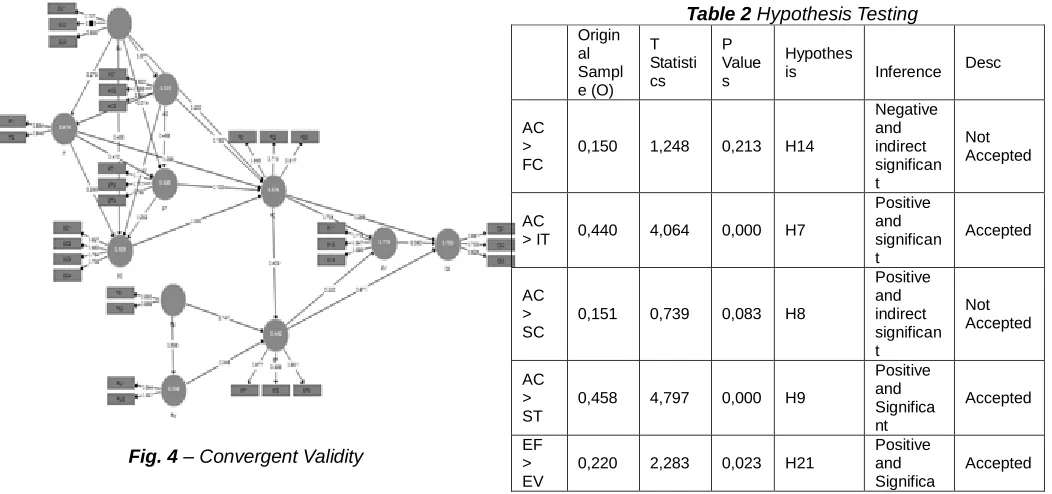
In measuring the construct model by analyzing the outer model in SmartPLS 3 software, the flow diagram of the relationship between the construct model and the indicator is a way to get the effect or effect of the independent variables on the dependent variable. From the tests carried out, it will explain how the relationships of each indicator with each variable. And the analysis of the outer model serves to ascertain whether the indicators used to measure whether the indicator is reliable or valid. Convergent validity is used to measure whether the two instruments are highly correlated in measuring a concept. The value of convergent validity is the value of outer loading on latent variables with the indicators. The expected value is > 0.7 so a value below 0.7 indicates that the indicator is invalid [16].
Fig. 4 – Convergent Validity
The results of this measurement can be seen from the composite reliability that has been outlined in the composite reliability table which is used to measure the construct that can be evaluated by internal consistency or internal consistency reliability. For measurement of composite reliability on smart pls use composite reliability value. The recommended value is > 0.7 [17].
Table 1 Reliability Testing used SmartPLS Variable Composite Reliability Description
AC 0,889 Reliable
EF 0,918 Reliable
EV 0,862 Reliable
FC 0,843 Reliable
IT 0,845 Reliable
QS 0,848 Reliable
RU 0,877 Reliable
SC 0,871 Reliable
ST 0,795 Reliable
SU 0,839 Reliable
TB 0,905 Reliable
4.3 Inner Model Analysis
In the inner model, measurement produces a structural model test that can be used to ensure empirical data on research with the relationship of the research hypotheses. To see the hypothesis accepted or rejected can see the value of the T-statistic and P-Values with the provisions of alpha 5% = 0.05. Provisions so that the hypothesis is accepted, namely the value of T-Statistics used is the 5% significance level so that the minimum T-Statistics limit is 1.96 [18]. The probability value, p-value with alpha 5% p-value 5 0.05. Whereas to see positive and negative influences can be observed from the original sample value. The closer the +1 value is, the stronger the two constructs. Relationships that are closer to -1 indicate that the relationship is negative [19]. If there is a T-statistic and P-Values value under these conditions, the hypothesis is rejected.
Table 2 Hypothesis Testing Origin
al Sampl e (O)
T Statisti cs
P Value s
Hypothes
is Inference Desc
AC > FC
0,150 1,248 0,213 H14
Negative and indirect significan t
Not Accepted
AC
> IT 0,440 4,064 0,000 H7
Positive and significan t
Accepted
AC > SC
0,151 0,739 0,083 H8
Positive and indirect significan t
Not Accepted
AC > ST
0,458 4,797 0,000 H9
Positive and Significa nt
Accepted
EF > EV
0,220 2,283 0,023 H21
Positive and Significa
303 nt
EF > QS
0,671 5,812 0,000 H23
Positive and Significa nt Accepted EV > QS
-0,060 0,348 0,728 H24
Negative and indirect significan t Not Accepted FC > EF
0,409 3,069 0,002 H20
Positive and Significa nt Accepted FC > EV
0,706 8,702 0,000 H19
Positive and Significa nt Accepted FC > QS
0,285 2,012 0,045 H22
Positive and Significa nt
Accepted
IT >
FC 0,093 1,023 0,307 H13
Positive but indirect significan t Not Accepted
IT >
SC 0,255 3,894 0,000 H5
Positive and Significa nt
Accepted
IT >
ST 0,410 4,684 0,000 H6
Positive and Significa nt Accepted RU > EF
0,348 3,019 0,003 H18
Positive and Significa nt Accepted SC > FC
0,350 1,926 0,055 H16
Positive but indirect significan t Accepted ST >
FC 0,103 0,997 0,319 H15
Positive but indirect significan t Not Accepted ST >
SC 0,232 3,045 0,002 H10
Positive and Significa nt Not Accepted SU > AC
0,577 8,129 0,000 H3
Positive and Significa nt Accepted SU > FC
0,200 1,373 0,170 H12
Positive but indirect significan t Not Accepted SU
> IT 0,279 2,617 0,009 H4
Positive and Significa nt Accepted SU > SC
0,455 7,442 0,000 H1
Positive and Significa nt Accepted SU > ST
-0,014 0,170 0,865 H2
Positive but indirect significan Not Accepted t TB > EF
0,141 1,407 0,160 H17
Positive but indirect significan t Not Accepted TB > RU
0,598 9,110 0,000 H11
Positive and Significa nt
Accepted
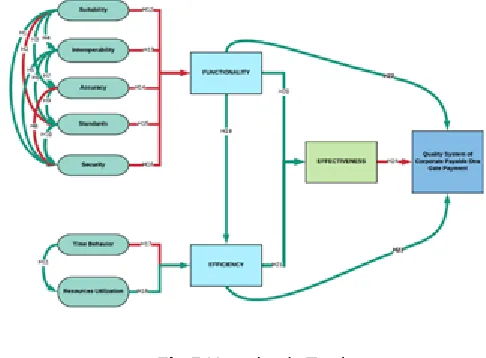
Measurements in SmartPLS were carried out by statistical calculations of each relationship hypothesized with bootstrapping simulation. The test results with bootstrapping from the SmartPLS analysis can be described as follows which red line indicated to rejected and green indicated to accepted.:
Fig 5 Hypothesis Testing
With the description of the picture above are as follows: Testing the hypothesis can be seen from Table 2 that the accepted hypotheses are H1, H3, H4, H5, H5, H6, H7, H9, H10, H11, H18, H19, H20, H21, H22, H23. While the rejected hypotheses are H14, H8, H24, H13, H16, H15, H12, H2, and H17.
4.4. Measurement Testing
Measurement testing is a test in making decisions whether a system can be developed, continued, or stopped. The feasibility test can be used to ensure the value of the hypothesis test to obtain the overall value of system quality using the system quality model ISO 9126 which is poured into a continuous percentage assessment. The following calculation formula can be used to determine the feasibility test of a system [20]:
Measurement percentage =
Description:
Actual score (f) = number of answer scores from respondents Ideal score (n) = highest score if the respondent chooses the answer with the highest scoreAfter getting the results of the calculation, then compared to the scale of conversion to be stated as very good, good, enough, lacking, and very lacking
304 Based on the measurement test, the results of the data
obtained are as follows:
Table 4. Measurement Testing
The lowest value in the measurement test of 74.41% in the Interoperability variable and the largest percentage value is 85.03% in the effectiveness variable. From that system, recommendations are made based on the lowest value of the results of the feasibility test obtained.
Fig7. Measurement Testing of Interoperability variable
Interoperability has the lowest value in the OGP system functionality, with a score of 74.41% and is quite a good category. Where in the interoperability variable conclusions can be drawn based on the results of the questionnaire with 2 possibilities, are:
1. Lack of system interoperability with other system, and 2. Lack of system is converting, or bridging data formats carried out between OGP core system and Bank’s core ERP system
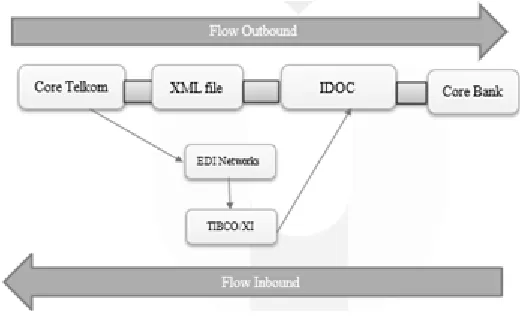
By looking at the existing system flow contained in the OGP system, stating that the data transmission used can be through XML and IDOC data formats, using the payment instruction method that is sent through Telkom's core ERP with the online messaging Web Service Description Language (WSDL) method or IDOC file through Host-to-Host (H2H) connection, and can only be sent with SAP-SAP server. So that it can be concluded that the lack of interoperability that occurs in the system with 2 (two) possibilities, are
1. Lack of good interaction between OGP system and other system
2. There is a desire to make payments and interact with the bank’s system that does not use SAP.
The solution offered is to use middleware technology, such as TIBCO or XI. TIBCO or XI will convert data into a format that can be understood by the recipient's data system again. Whereas EDI is a technology that is used to carry out communication or relations to transfer data from the SAP system to non-SAP systems. With the file format that is sent in the form of an XML file to IDOC.
The recommended flow of implementing EDI using the TIBCO
and XI middleware can be described as follows
Fig 8 Recommended System
In Outbound EDI (Electronic Data Interchange) Flow Subsystem is an SAP object that is used to transfer data or information from SAP to non-SAP systems. The IDOC file sent from Telkom's ERP core system in the Telkom OGP system will go through the EDI Subsystem, then the EDI Subsystem will use the TIBCO / XI middleware to change the data in a format that can be received by the system receiver that sent it for the first time. By changing the data in XML format to IDOC then it will be sent back as an XML file format to the receiver system. Thus, the interoperability of Telkom's OGP ERP system can still be carried out even with non-SAP companies with the implementation of EDI by using the TIBCO / XI middleware. With the improvement of system quality in the interoperability sub-variable, it will influence the results of the hypothesis, because all the variables in the ISO 9126 model are mutually correlated and connected so that the quality of the system in OGP will be in line with the company's target in functionality and more efficiency
5 CONCLUSIONS
This research was conducted with the aim of testing the results of measuring the quality of the system using the ISO 9126 standard, which focuses on the functionality and efficiency of the system in telecommunications companies called "OGP ERP System". Based on testing using ISO 9126, it was found that:
1. The results of the carried out using the model, it states that the correlation of variable functionality has a significant effect on the quality of the system in OGP which obtained by the T-Statistic of 2.012, where the value is greater than the minimum T-Statistic with a 5% significance level of 1.96 and has a P-value 0.035 with the provisions of alpha 0.05.
2. The results of the carried out using the model, it states that the correlation of variable efficiency has a significant effect on the quality of the system in OGP which obtained by the T-Statistic of 5.812, where the value is greater than the minimum T-Statistic with a 5% significance level of 1.96 and has a P-value 0.035 with the provisions of alpha 0.05.
Based on the feasibility test, the lowest value is obtained which affects the quality of the system to be maintained, developed or continued. The results showed that the interoperability variable has a percentage value of 74.41%, so Percentage of Achievement (%) Interpretation
0% - 20% Very Lacking
21% - 40% Lacking
41% - 60% Sufficient
61% - 80% Good
81% - 100% Very Good
Variable Percentage of Measurement Testing
Suitability 81,16%
Accuracy 81,62%
Interoperability 74,41%
Standard 78,91%
Security 81,97%
Time Behavior 84,88%
Resources Utilization 83,02%
Functionality 82,48%
Efficiency 84,34%
Effectiveness 85,03%
305 the proposed recommendation is a system design that
supports system interoperability by adjusting the file format in sending data using EDI networks which includes the application of TIBCO / XI middleware to change data formats to be acceptable by the receiver system.
With the improvement of the system quality on the interoperability sub-variable will affect the results of the hypothesis, because all the variables in the ISO 9126 model are correlated and connected, so that the quality of the system in Telkom OGP will be able to match the company's targets in functionality and more efficiently
ACKNOWLEDGMENT
I am very grateful and thank you very much to Mr. Muhardi and Mr. Wahjoe for his continued encouragement, good advice during my studies and I thank to PT Telekomunikasi Indonesia for good advice, extraordinary cooperation and support for me in analyzing a very complex system in internal company. And of course, I am very grateful to Telkom University for funding research for this paper, and I will be do my best.
REFERENCES
[1] Ayu Laely Qomariah, ―Penerapan System Application And Product (SAP) Pada Administrasi Kepegawaian Di PT KAI (Persero) DAOP 8 Surabaya,‖ J. Penerapan Syst. Appl. Prod., pp. 4–5, 2015..
[2] R. Waluyo, M. Dianingrum, and G. D. Dewi, ―Pengukuran Kualitas Sistem Informasi Pelayanan Pasien Pada Klinik Xyz Menggunakan Iso 9126,‖ J. Pro Bisnis, vol. 11, no. 2, pp. 76–87, 2018.
[3] E. Ekawati, ―Strategi Perencanaan Pengembangan Sistem Sap pada Human Capital and Legal di Institusi Pendidikan Xyz,‖ ComTech Comput. Math. Eng. Appl., vol. 5, no. 1, p. 174, 2014.
[4] E. S. S. abMagister Ari Cahaya Puspitaningruma, ―Jurnal Teknologi dan Sistem Informasi Literatur Review : Critical Success Factor Penerapan Sistem ERP pada Perusahaan,‖ vol. 02, pp. 89–97, 2018.
[5] N. Agus Widodo, Honorata Ratna Dwi, ―Media Ekonomi dan Manajemen Vol. 31 No. 2 Juli 2016,‖ vol. 31, no. 2, pp. 160–181, 2016.
[6] A. A. Melathi, W. Suharso, J. T. Informatika, F. Teknik, and U. M. Jember, ―Penerapan Model Kualitas ISO / IEC 9126 Untuk Evaluasi Sistem Informasi Akademik Lembaga Bimbingan Belajar Berbasis Web,‖ no. 2012, pp. 75–83, 2015.
[7] T. A. Alrawashdeh, M. I. Muhairat, and S. M. Alqatawneh, ―A quantitative evaluation of ERP systems quality model,‖ ITNG 2014 - Proc. 11th Int. Conf. Inf. Technol. New Gener., no. April, pp. 46–49, 2014.
[8] P. Garg and A. Garg, ―Factors influencing ERP implementation in retail sector: An empirical study from India,‖ J. Enterp. Inf. Manag., vol. 27, no. 4, pp. 424–448, 2014.
[9] R. Akbar and J. Juliastrioza, ―Penerapan Enterprise Resource Planning (ERP) untuk Sistem Informasi Pembelian, Persedian dan Penjualan Barang pada Toko EMI GROSIR dan ECERAN,‖ J. Teknol. dan Sist. Inf., vol. 1, no. 1, p. 7, 2017.
[10]R. Akbar and J. Juliastrioza, ―Penerapan Enterprise Resource Planning (ERP) untuk Sistem Informasi Pembelian, Persedian dan Penjualan Barang pada Toko
EMI GROSIR dan ECERAN,‖ J. Teknol. dan Sist. Inf., vol. 1, no. 1, p. 7, 2017.
[11]Y. Putri, A. Y. Ridwan, and R. W. Witjaksono, ―Berbasis Enterprise Resource Planning Modul Purchasing ( Mm-Pur ) Pada Sap Dengan Metode Asap Di,‖ J. Rekayasa Sist. Ind., vol. 3, pp. 108–114, 2016.
[12]S. Pawirosumarto, P. S. Katidjan, and D. Mulyanto, ―Pengaruh Computer Self-Efficacy Terhadap Kualitas Sistem, Kualitas Informasi, Kualitas Layanan, Penggunaan, Kepuasan Pengguna, dan Dampak Individu,‖ Vol. Vi, No. 2, Pp. 310–327, 2015.
[13]K. Falgenti and S. M. Pahlevi, ―Evaluasi Kesuksesan Sistem Informasi ERP pada Usaha Kecil Menengah Studi Kasus : Implementasi SAP B1 di PT . CP,‖ no. July 2014, 2013.
[14]R. Djouab and M. Bari, ―An ISO 9126 Based Quality Model for the e-Learning Systems,‖ vol. 6, no. 5, 2016. [15]M. P. Guntur Nurcahyanto, S.T., ―Uji Instrumen
Penelitian,‖ 2014, pp. 1–19.
[16]A. Sutanti, ―Pengukuran Kualitas Perangkat Lunak Sistem Informasi Hotel Berbasis Standard ISO 9126 Asih,‖ 2016. [17]J. F. Hair, C. M. Ringle, M. Sarstedt, J. F. Hair, C. M.
Ringle, and M. Sarstedt, ―PLS-SEM : Indeed a Silver Bullet,‖ no. January 2015, pp. 37–41, 2014.
[18]M. S. Joseph F.Hair, Jr. G.Tomas M.Hult, Christian M.Ringle, ―A Primer on Partial Least Squares Structural Equation Modeling (PLS-SEM),‖ 2017.
[19]M. Sarstedt, C. M. Ringle, and J. F. Hair, Partial Least Squares Structural Equation Modeling. 2017.