R E S E A R C H
Open Access
An ontological analysis of medical Bayesian
indicators of performance
Adrien Barton
1,5*†, Jean-François Ethier
1,4,5†, Régis Duvauferrier
2,3and Anita Burgun
4Abstract
Background:Biomedical ontologies aim at providing the most exhaustive and rigorous representation of reality as described by biomedical sciences. A large part of medical reasoning deals with diagnosis and is essentially
probabilistic. It would be an asset for biomedical ontologies to be able to support such a probabilistic reasoning and formalize Bayesian indicators of performance: sensitivity, specificity, positive predictive value and negative predictive value. In doing so, one has to consider that not only the positive and negative predictive values, but also sensitivity and specificity depend upon the group under consideration: this is the“spectrum effect”.
Methods:The sensitivity value of an index testITfor a diseaseMin a groupgis identified with the proportion of people ingwho haveMwho would get a positive result toITif the testITwas realized on them. This value can be estimated by selecting a reference testRTforMand a samplesofg, and measuring the proportion, among members ofshaving a positive result toRT, of those who got a positive result toIT. Similar approximation
strategies hold for prevalence, specificity, PPV and NPV. Indicators of diagnostic performances and their estimations are formalized in the context of the OBO Foundry, built on the realist upper ontology Basic Formal Ontology (BFO). Results:Entities and relations from the Ontology for Biomedical investigations (OBI) and the Information Artifact Ontology (IAO) are used and complemented to represent reference tests and index tests, tests executions, tests results and the relations involving those entities, as well as the values of indicators of performance and their estimates. The computations taking as input several estimates of an indicator of performance to produce a finer estimate are also represented. The value of e.g. sensitivity estimates should be dissociated from the real sensitivity value–which involves possible, non-actual conditions, namely the result a person would get if a medical test would be performed on her. Such conditions could not be directly represented in a realist ontology, but a
representation is proposed that introduces only actual entities by considering a disposition whose probability value is the real sensitivity value. A sensitivity estimate is a data item which is about such a disposition.
Conclusions:This model provides theoretical basis for the representation of entities supporting Bayesian reasoning in ontologies.
Keywords:Sensitivity, Specificity, Medical test, Spectrum effect, Disposition, Realist ontology, Informational entity
Background
Definition of indicators of performance
Biomedical ontologies aim at providing the most exhaust-ive and rigorous representation of reality as described by biomedical sciences. A large part of medical reasoning deals with diagnosis and is essentially probabilistic. It
would be an asset for biomedical ontologies to be able to support such a probabilistic reasoning.
Ledley and Lusted’s seminal article [1] on Bayesian rea-soning in medicine defines different kinds of probabilistic entities. Consider for example the simple case of an in-stance of test of typeIT(for“index test” –a test whose ac-curacy is being measured) aiming at detecting if a patient in a group ghas an instance of disease of typeM.1The per-formance of testITin diagnosing Mcan be quantified by the positive predictive value of this test, hereafter abbrevi-ated PPV, defined by the Oxford Handbook of Medical * Correspondence:[email protected]
†Equal contributors
1
Département de médecine, Université de Sherbrooke, Sherbrooke, Québec, Canada 5Centre de recherche du CHUS, CIUSSS de l’Estrie-CHUS, Sherbrooke,
Québec, Canada
Full list of author information is available at the end of the article
Statistics[2] as the“proportion of tested positives who are true positives” and by the negative predictive value, here-after abbreviated NPV, defined as the“proportion of tested negatives who are true negatives”. These values provide the probability that a patient has or not the disease, depending upon the result (positive or negative) to the test.
However, such values depend on some characteristics of the patient. If a patient received a positive test, the probability that he has the disease can for example depend upon his sex, his status of smoker or non-smoker, and other biological or environmental parameters. In particular, it depends on the prevalence of the disease among the group of persons with those characteristics.
Therefore, the statistical data communicated in the medical literature for a test are generally not the positive and negative predictive values, but the so-called “ sen-sitivity” and “specificity”. The Oxford Handbook of Medical Statistics defines sensitivity as “the propor-tion of those who have the disease who are correctly identified by the test as positive” ([2], p. 340) and spe-cificity as “the proportion of those who do not have the disease who are correctly identified by the test as negative“. The PPV and NPV can be computed on the basis of the prevalence Prev, sensitivity Se and specifi-city Sp thanks to the following Bayesian equations:
PPV ¼ Prev:Se
Prev:Seþð1−PrevÞð1−SpÞ
NPV¼ ð1−PrevÞ:Sp Prev:ð1−SeÞ þð1−PrevÞ:Sp
In the remainder of the article, sensitivity, specificity, PPV and NPV will be called “(Bayesian) indicators of performance”and abbreviated“IPs”.
In the wake of Ledley and Lusted [1] the sensitivity and specificity values have often been considered as de-pending only on the pathophysiological characteristics of the disease and of the test, and thus as being independent of the group of people under consideration. However, sen-sitivity and specificity values do in fact depend upon the group under consideration: this is the “spectrum effect” [3].
The spectrum effect
If IT is an index test andM is a disease, let’s introduce f1(IT,M) as“the proportion of individuals who get a posi-tive result toIT, among individuals who haveM”, which fits with the usual definition of sensitivity (as provided by [2]). The main problem with this definition is that it does not specify the reference population. "The individ-uals who have M” are part of which population: the population in a given sample? The population of a spe-cific country? The whole human population? Ledley and Lusted [1] considered that sensitivity and specificity
depend upon pathophysiological characteristics of the disease, but not upon the population in consideration. If this was the case, the proportion of people tested posi-tive among the diseased would be the same in any group under consideration–abstracting from statistical fluctua-tions due to randomness. However, as has been recog-nized by the medical literature, but regularly omitted, this hypothesis is false for at least two reasons. First, most tests
are not inherently dichotomous but rely on a
categorization of individuals based on continuous traits [3]. Second, various populations can express various dis-ease characteristics (such as various degrees of severity [4]) that will influence the chance to get a positive result to a test.
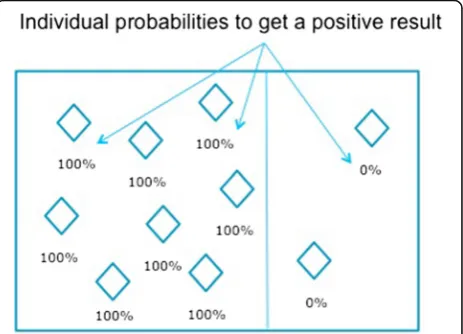
The latter can be illustrated with the following ex-ample. Suppose that around 80 % of people having rheumatoid arthritis have a rheumatoid factor (RF), and would with certainty receive a positive result to a test that would perfectly2 detect this factor; and that the remaining 20 % do not have a rheumatoid factor, and would receive a negative result (yet do have the disease). The diseased population is then composed of two sub-groups: a subgroup sg1 whose members would all get for sure a positive result to IT, and a subgroup sg2 whose members would all get for sure a negative result (see Fig. 1). The sensitivity calculated in this example would be 80 %.
Nevertheless, in reality, those proportions vary based upon various characteristics of the patients. For example, RF presence increases with age at onset of disease in juvenile arthritis [5]. As a result, the sensi-tivity of a test for RF will increase according to the age of the individuals of the population being tested. Its sensitivity will be lower in younger patients and higher in older patients.
Therefore, f1is not a well-defined function: the value of the proportion does not depend only uponITandM, but also upon the population g under consideration (which could be, for example, the whole human tion, the Canadian smoker population, the female popula-tion, etc.). This is the“spectrum effect”, which can also be manifested, for example, as a dependence of sensitivity and specificity on the degree of severity of the disease in the group under consideration [4].
The sensitivity can therefore depend on the group g
under consideration. A better candidate than f1(IT,M) to the definition of the sensitivity value would be the func-tion f2(g,IT,M) defined as “the proportion3 among people ing who haveMof those who would get a posi-tive result to IT if the test IT was realized on them” – the mention in italic is necessary, as a testITwill not be realized on all individuals who haveM, but on a sample only. The next part will distinguish three related entities: the real sensitivity4 value, its estimates, and the measure-ments of proportion in samples. It will also explain how such entities should be distinguished in an ontology of IPs.
Methods
Proportion measurement in a sample
It is impossible to know f2(g,IT,M) with certainty in practice, for two reasons. The first reason is that it is often not possible to determine with certainty, through reasonable means, whether a given person has the dis-easeM or not; in some cases, the only way to be certain would be to perform an autopsy on the deceased patient. Therefore, one needs to use a “reference test”, which is the best diagnostic test that is reasonable to perform in the present context (for more on the distinction between a reference test and the associated disease, see section “The challenge of representing indicators of performance in an ontology”below).
If the patient receives a positive result to this reference test, it will be concluded that he has the disease; if he re-ceives a negative result, it will be concluded that he does not have it. But those inferences can be wrong: the refer-ence test might lead to a positive result for a non-diseased person, or a negative result for a non-diseased per-son. If RT is a reference test for M and IT is an index test (of unknown accuracy) for M, then one can define the function f3(g,IT,RT) as“the proportion, among indi-viduals ofg who would get a positive result toRT if the test RT had been performed on them, of people who would get a positive result to IT if the test IT was real-ized on them”. Since RT is a reference test for M, f3(g,IT,RT) approximates f2(g,IT,M). Both values can dif-fer though: this is a first epistemic limit to the know-ledge of f2(g,IT,M).
On top of this, f3(g,IT,RT) is not directly measurable. As a matter of fact, a test IT is never realized on a
population as large as e.g., the whole population of smokers, or the whole male population. It is however possible to approximate f3(g,IT,RT) by performing both tests ITand RT on individuals in a sample s judged as being representative of the population g. Let’s define f4(s,IT,RT) as “the proportion, among members of swho got a positive result toRT, of those who got a positive re-sult to IT”. If s is a representative sample of g, then f4(s,IT,RT) does approximate f3(g,IT,RT) – and thus, by transitivity, does approximate f2(g,IT,M). Note that as long as the samplesis not perfectly representative ofg, f4(s,IT,RT) will differ at least slightly from f3(g,IT,RT) (which also differs from f2(g,IT,M)): this is a second limit to the knowledge of f2(g,IT,M).
Let’s illustrate those two limits of estimations with a study [4] which analyzes the quality of the Neer test (here written IT’) for diagnosing the shoulder impinge-ment syndrome (writtenM’), a syndrome that is charac-terized by rotator cuff muscles inflammation near the sub-acromial space. In this study, the Neer testIT’is re-alized on a sample (writtens’) of 552 patients, judged as representative of the target population (g’). Park et al. [4] take as reference test (RT’) the surgical observation. Here, f4(s’,IT’,RT’) is the proportion of people in the sample who have received a positive result to the Neer test, among those diagnosed as positive by surgical op-eration. f4(s’,IT’,RT’) approximates f3(g’,IT’,RT’), namely the proportion of individualsin the target populationg’
who would get a positive result to the Neer test among those who would get a positive result by surgical observa-tion, if those tests were performed on them. Finally, f3(g’,IT’,RT’) itself approximates f2(g’,IT’,M’), which is the proportion of individuals ing’who would receive a posi-tive Neer test result among those who have an im-pingement syndrome. Thus, f4(s’,IT’,RT’) approximates f2(g’,IT’,M’).
Note that similar approximation strategies hold for prevalence, specificity, PPV and NPV. Concerning e.g. specificity, one could thus define f’2(g,IT,M) as“the pro-portion5 among people ing who don’t have M of those who would get a negative result to IT if the test IT was performed on them”; and f’4(s,IT,RT) as “the proportion, among members of s who got a negative result to RT, of those who got a negative result to IT”. Thus, f’4(s,IT,RT) approximates f’2(g,IT,M).
Sensitivity value and sensitivity estimates
30 % and men 64 %)” [6]. On one hand, the statement “sensitivity varies substantially according to the sex” sug-gests that sensitivity depends on the target populationg
in consideration, and that there is a sensitivity value for the female population, and another one for the male population. This formulation thus suggests that sensitivity value is given by the function f2(g,IT,M). However, the value 30 % assigned to the sensitivity of the test for women refers to a proportion which has been measured by the au-thors in a sample of 37 women, using coronary angiog-raphy as a reference test. This might thus suggest that the sensitivity value is in fact given by the function f4(s,IT,RT)
However, two arguments suggest that the sensitivity value should be interpreted as f2(g,IT,M) rather than f4(s,IT,RT). First, the value which is ultimately relevant for medical practice is f2(g,IT,M): if s is a sample of g andRTis a reference test forM, f4(s,IT,RT) is of interest for the medical practitioner only insofar as it provides an information on the diseaseMand the target population
g from which the sample is taken –that is, insofar as it provides an estimate of f2(g,IT,M). Indeed, the fact that a few people who got a positive result toRTin a given sam-ple have got a positive or negative result to a test IThas medical relevance only insofar as it teaches us something about howdiseased people in the target population (not only in the sample) will react to this testIT.
Second, the sensitivity value is usually given with a 95 % confidence interval (see e.g., [7] or [8]), which esti-mates the likely range of error in determining the sensitivity value. But f4(s,IT,RT) can be measured with certainty,6and thus the confidence interval cannot characterize the uncer-tainty on our knowledge of f4. On the other hand, there is some uncertainty on the knowledge of f2(g,IT,M) and f3(g,IT,RT), as they are estimated on the basis of f4(s,IT,RT). Therefore, the 95 % confidence interval would characterize the uncertainty on the knowledge of f3(g,IT,RT), which is taken as a proxy for f2(g,IT,M).7
Thus, those two arguments suggest that the term“ sensi-tivity” should refer to f2(g,IT,M)– which is relative to a disease and a target population–rather than to f4(s,IT,RT) – which is relative to a reference test and a sample.8As for f4(s,IT,RT), it can be interpreted as the value of a meas-urement of proportion in a sample, which provides an es-timate of the sensitivity value.
Therefore, a sentence such as “The sensitivity varied substantially according to sex (women 30 % and men 64 %)” should, more rigorously, be formulated as: “The sensitivity varies substantially depending on the sex: through measurement of proportions in samples, its value was estimated to be 30 % for the women, and 64 % for the men”. We could prefer the first formulation, more compact, for practical reasons; but it is important to remember that it is only a shortcut for the second formulation.
Accordingly, we will need to dissociate three different kinds of entities. First, tests execution on a samples, re-ferring more precisely to the process of performing tests ITand RTand measuring the numbers of true positive, false positive, true negative and false negative as opera-tionalized by ITand RT- for example, the false positive are people who are tested positive by the index test IT but negative by the reference test RT in the sample s. Second, the proportion of true positives among positives (as given by the reference test) is relative to the index test, the reference test and the sample, and its value is given by the function f4(s,IT,RT); as such, it provides an estimate of the sensitivity value. Third, the“real sensitiv-ity”, which is relative to an index test, a disease and a populationg, and whose value f2(g,IT,M) is given by the proportion of people in the group who would have a positive result to the test ITamong those who are dis-eased. The real sensitivity would provide a better infor-mation than a sensitivity estimate on the probability that a random member of the group g would get a positive test result, in case he has the disease. However, its value f2(g,IT,M) cannot be known with certainty, contrarily to the value of the sensitivity estimate f4(s,IT,RT).
More generally, those considerations can be adapted to other indicators of performance (specificity, PPV and NPV), as well as the prevalence. In particular, f’2(g,IT,M) should refer to the real specificity value, whereas f’4(s,IT,RT) can be interpreted as the value of a measured proportion in a sample that provides an estimate of the real specificity value. In particular,realsensitivity, speci-ficity, PPV and NPV, as we have defined them above, de-pend neither on the sample nor on the reference test. However, they are estimated on the basis of proportion measurements which depend both on the sample and the reference test. Accordingly, when a study [9] men-tions“cadaveric prevalence”of the rotator cuff tears, this expression should be understood as a linguistical shortcut denoting a proportion measurement in a sample when the cadaverical analysis is adopted as reference test; and the “radiological prevalence”should be understood as a pro-portion measurement when the radiological analysis is adopted as reference test. The real prevalence, how-ever, does not depend on the reference test.
Aggregation of sensitivity estimates
assessing the sensitivity and specificity of those devices. Combining those values, they come up with an estimate of 0.64 for the sensitivity and of 0.96 for the specificity.
The challenge of representing indicators of performance in an ontology
To the extent that they aim at representing biomedical knowledge and enabling medical reasoning, biomedical ontologies should provide a formalization of IPs as well as the prevalence, by dissociating e.g. the real sensitivity from the sensitivity estimates, and the process leading to those estimates. This article will introduce such a formalization in the context of the OBO Foundry [10], one of the most massive set of interoperable ontologies in the biomedical domain, built on the upper ontology Basic Formal Ontology (BFO) 1.1 [11].
BFO endorses a realist methodology, which carefully dissociates material entities (such as disorders) from informational entities (such as diagnosis). In common medical practice, a disease may be diagnosed in ideal circumstances by a given gold standard test, which can be defined as the most accurate reference test; but the dis-ease, the diagnosis, and the result to a gold standard test are three different entities that should be distinguished. As a matter of fact, many human diseases already existed a few thousands of years ago, much before they could be di-agnosed. Moreover, a diagnosis can be wrong or imprecise. Finally, a given gold standard can be later replaced by a better one: this shows that the disease cannot be defined by a positive result to a gold standard - otherwise, there could not be, by definition, a“better”gold standard. Thus, while a diagnosis of a disease represents the best know-ledge by some health or research professional of the pres-ence of the disease in a particular patient, a diagnosis is not equivalent to a disease: it is rather “about” a disease. This formalization is compatible with IAO (Information Artifact Ontology [16]) and OGMS (Ontology for General Medical Sciences).
The question of how probabilistic notions can be rep-resented in ontologies has been tackled from different perspectives in the past. For example, [12] has proposed the alternative PR-OWL format that extends the clas-sical OWL format; we take here a different approach, which does not aim at changing the OWL format. Solda-tova and colleagues [13] have described a model in which probabilities can be assigned to research state-ments. We build here upon an alternative approach [14], in which probabilities can be assigned to dispositions.
Sensitivity and specificity have been recently introduced in the Ontology of Biological and Clinical Statistics (OBCS [15]) as subclasses of Data item. We will partly endorse and refine this classification, by considering estimates of sensitivity and specificity as subclasses ofData Item, and extend this classification to PPV and NPV. A data item, as
defined by the Information Artifact Ontology (IAO) [16], is intended to be a truthful statement about something. In order to formalize IPs, one should thus clarify which en-tities in the real world they are about.
Proportion measurements are data items that are ob-tained from some processes named "proportion mea-sures", which involve performing two kinds of tests (the index test and the reference test) in a sample. On the other hand, we have defined a real sensitivity value f2(g,IT,M) as the proportion of people who would get a positive result by ITamong those who have the disease M. But note here the conditional structure: what is re-ferred to is the proportion of true positives among dis-eased if IT was performed on them. In realistic situations, however, as explained above, the sensitivity value will be estimated by performing the test on a sam-ple of the population only–not the entire populationg; thus, f2(g,IT,M) is the value of a non-actual proportion.9 However, possible-but-non-actual situations cannot be straightforwardly represented in a realist ontology like BFO. To solve this problem, we will formalize the real IP value as the probability assigned to a disposition borne by an instance of group of individuals; and estimates of IPs as data items which are about such a disposition. This will provide a formal characterization of IPs and their esti-mates based on proportion measurements.
Results
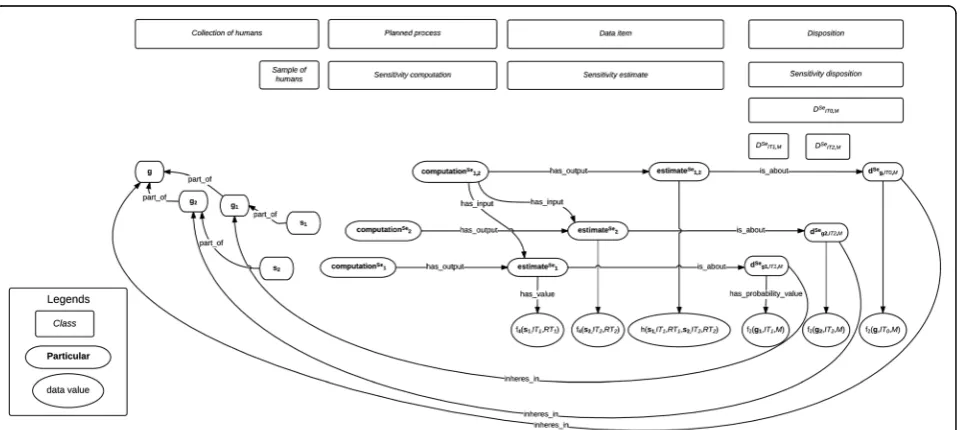
The formalization that will be presented here can be visu-alized on Fig. 2 and Fig. 3, in which classes are in rectan-gles, instances in boxes with rounded edges, and the numerical value assigned by datatype properties in ellipses. Unless specified otherwise, all the relations used here be-long to BFO 1.1 [11].
Test results and sensitivity estimate
Let us first start with the formalization of test results and the IP estimates they lead to (see Fig. 1).10AMedical_test will be here considered as a subclass of Planned_process (as defined by OBI, the Ontology for Biomedical Investiga-tions [17]) which consists in the observation of a given feature to infer the presence of another feature– in the case of interest, a pathological entity such as a disease. Consider a medical test11IT1and a diseaseM:
Medical_test is_a Planned_process
IT1is_a Medical_test
M is_a Disease
considered to be representative ofg1(which will be called the reference class). Thus:
g1instance_ofCollection_of_humans
s1instance_ofSample_of_humans
Sample_of_humans is_a Collection_of_humans
s1part_of g1
Let’s now introduce the class of tests RT1 which are reference tests forM:
RT1is_a Medical_test
s1 is composed of n humans, named p1, p2,…,pn. Two12tests will be performed on eachpi: an instance of
RT1, named thereafter rt1,i, and an instance of IT1, namedit1,i; thus, for everyibetween 1 andn:
piinstance_ofHuman
pipart_of s1
piparticipates_in rt1,i
piparticipates_in it1,i
We introduce tests_executions1,IT1,RT1 which has as part all the testsrt1,iandit1,ifor i between 1 and n and the recording of which members of the sample are true positives (those who have been tested positive both by IT1andRT1), true negatives (those who have been tested negative both byIT1andRT1), false positives (those who have been tested positive by IT1 but negative by RT1)
Fig. 2Real sensitivity and specificity values and their estimates
and false negatives (those who have been tested negative by IT1but positive by RT1). This recording leads
(OBI:-has_specified_output) to the creation of the instance of Data_setnamedtests_resultss1,IT1,RT1:
tests_executions1,IT1,RT1instance_ofPlanned_process
rt1,ipart_of tests_executions1,IT1,RT1
it1,ipart_of tests_executions1,IT1,RT1
tests_resultss1,IT1,RT1instance_ofData_set
tests_executions1,IT1,RT1has_specified_output
tests_resultss1,IT1,RT1
The tests_resultss1,IT1,RT1 will then serve as input (OBI:has_specified_input) to a planned process noted
computationSe1 which computes a sensitivity estimates noted estimateSe1, by calculating the proportion of true positives among positives:13
computationSe1 is_aPlanned_process
estimateSe1 is_aData_item
computationSe1 has_specified_input
tests_resultss1,IT1,RT1
computationSe1 has_specified_output estimateSe1
Finally, we can use the datatype property OBI: has_-specified_value to relate estimateSe1 with its numerical value f4(s1,IT1,RT1):
estimateSe1 has_specified_valuef4(s1,IT1,RT1)
Similar strategies can hold for representing Specificity, PPV and NPV and their estimates.14
Aggregation of sensitivity estimates
We will now show how various sensitivity estimates can be aggregated for a finer sensitivity estimate (cf. Fig. 3). Suppose that we have another samples2(also apart_of g), composed of n’humans namedq1,q2, ...,qn'. We can per-form another measure of sensitivity for a related (possibly identical toIT1) index test IT2forM ingon this sample, using a related (possibly identical to RT1) reference test RT2, by performing instances of RT2 named rt2,j (for j between 1 and n’) and instances ofIT2namedit2,jon each memberqjofs2. One can then define the entity
tests_exe-cutions2,IT2,RT2 as a planned process which has as part those testsrt2,jandit2,j, and which has as output
tests_re-sultss2,IT2,RT2; the latter serves as input to another compu-tation of sensitivity computationSe2, which has as output another estimate of sensitivity estimateSe2, to which the value f4(s2,IT2,RT2) can be assigned (the latter being the proportion, among people who have been tested positive by RT2ins2, of people who had a positive result toIT2).
As explained earlier, various sensitivity estimates can be combined to estimate the value of the sensitivity of a
test forM ing. IfIT1and IT2on one hand, andRT1and RT2on the other hand, are similar enough (in particular, if they are identical), those results might be gathered to come up with a finer estimate of the sensitivity value. More specifically, ifIT1andIT2can be subsumed under a common index test classIT0, andRT1andRT2can also be subsumed under a common reference test class RT0, then their values can be compiled mathematically (for ex-ample by meta-analysis methods) to come up with the value of a (hopefully finer) estimate named estimateSe1,2, whose value is given by a function h(s1,IT1,RT1,s2,IT2,RT2). This can be generalized to the aggregation of more than two former estimates.
We can here introduce a planned process of computa-tion of sensitivity namedcomputationSe1,2, which takes as input bothestimateSe1 andestimateSe2, and the output of such a process, a data item namedestimateSe1,2:
computationSe1,2instance_ofPlanned_process
estimateSe1,2instance_ofData_item
computationSe1,2has_specified_input estimateSe1
computationSe1,2has_specified_input estimateSe2
computationSe1,2has_specified_output estimateSe1,2
estimateSe1,2has_specified_valueh(s1,IT1,RT1,s2,IT2,RT2)
We will not aim at giving the details of this function h, which is the responsibility of the statistician, not the on-tologist–who focuses on how to represent such values.
Finally, sinceestimateSe1 orestimateSe1,2are informational entities, they must be about some entities. To determine what those entities are about, we will need to formalize the entity to which is assigned the“real sensitivity value”.
Real sensitivity value
As said earlier, estimates of sensitivity of ITfor M in g
aim at estimating the real sensitivity value, which is given by the proportion of members ofgwho would get a posi-tive result toITamong those who have M. However, the condition of performing the testITon the members ofg
is never realized, because the test is performed (at best) on one or several samples of the population, not on the whole populationg: the performance of testITon the members ofg is apossible(leaving aside practical difficulties), non-actual condition. Interpreting specificity, PPV, and NPV along the former lines would also imply such possible, non-actual conditions.
sensitivity is about, namely about this disposition. Thus, it will enable to represent IPs in a realist fashion, compliant with BFO’s methodology.
From proportions to objective probabilities: the randomization strategy
We will explain first how the proportion of a subgroup in a group can be formalized as a probability value assigned to a disposition; this will help explaining later how the proportion of a subgroup in a group undergoing a possible, non-actual condition can be formalized along similar lines.
Dispositions are entities that can exist without being manifested; an example of disposition is the fragility of a glass, which can exist even when the glass does not break. We will use Röhl & Jansen's model of disposition [20] in BFO, which associates to every instance of dis-position one or several instances of realizations, and one or several instances of triggers (a trigger is the specific process that can lead to a realization occurring). In this model, the fragility of a glass is a disposition of the glass to break (the breaking process is the realization) when it undergoes some kind of stress (the process of undergo-ing such a stress is the trigger); this disposition inheres in the glass. Starting with the definition of these entities and their relations at the instance level, Röhl & Jansen proceed to formalize them at the universal level. Previ-ous work [14] has shown how to adapt this model to probabilistic dispositions. Thus, an instance of balanced coin is the bearer of an instance of disposition to fall on heads (the realization process) when it is tossed (the trigger process), to which an objective probability 1/2 can be assigned.
We will now extend the scope of this model to the situation at hand. Consider the prevalence Prev(g,M), which was defined above as the proportion of persons having Min the actual populationg. We can define the disposition dPrevg,M, borne by the group g, that a person randomly drawn inghasM. More specifically, let’s write Tg the process “randomly drawing a person in g”, and Rg,Mthe process “drawing by Tg someone who has M”: the triggers ofdPrevg,M are instances ofTgand its realizations are instances ofRg,M. Following the lines of previous work [14], one can thus define the probability assigned to the disposition15 dPrevg,M, which is the probability of drawing randomly someone who hasM ing. This probability is equal to the proportion of individuals who haveMing, that is, to Prev(g,M): if there are e.g., 10 % diseased people ing, then the probability of drawing randomly a diseased person ingis 10 %. Thus, the prevalence value can be identified to the objective probability assigned to the disposition dPrevg,M. We name this strategy the “randomization” of the proportion of persons having Ming.
The randomization strategy may not be necessary to formalize a proportion in an actual group, such as the prevalence. But this strategy can also be applied to pro-portions of people in groups which are subject to a pos-sible, non-actual condition – and thus, be relevant to formalize sensitivity and other IPs, and their estimates. As a matter of fact, the real sensitivity value f2(g,IT,M) was defined as the proportion of people who would get a positive result toITamongM’s bearers ing. This value can be“randomized”as follows. We can definedSeg,IT,Mas the disposition16 to draw randomly, among the individ-uals ofgwho haveM, someone who is tested positive by IT. More specifically, let’s define the process TSeg,IT,M as the “performance of test ITon the individuals in g, and random draw of an individual among those who have the diseaseM”;17and the processRSeg,IT,Mas the“drawing by TSeg,IT,M of someone who got a positive result to IT”. The triggers ofdSeg,IT,Mare instances ofTSeg,IT,M, and its re-alizations are instances ofRSeg,IT,M. As it happens, the real sensitivity value f2(g,IT,M) is the objective probability assigned to this disposition dSeg,IT,M,: indeed, if there are e.g., 15 % of the diseased people in g who would get a positive result by IT, then the probability of randomly drawing someone who got a positive test result by IT among diseased people in g if test IT would be per-formed on them is equal to 15 %.
Specificity value can be defined along similar lines, as probabilities assigned to actual dispositions borne by the group g noted dSpg,IT,M (and similarly for the PPV and NPV). Although bothdSeg,IT,Mand dSpg,IT,M are dispositions inhering in g, they have different triggers and different realizations; the process TSpg,IT,M is the “performance of test ITon the individuals in g, and random draw of an individual among those who do nothave the disease M” and the process RSpg,IT,M is the “drawing by T
Sp g,IT,M of someone who got anegativeresult toIT”.
Assignment of real sensitivity values to dispositions Let us now consider how to formalize these probability values in ontologies.dSeg,IT,Mis a disposition individual in-hering in the group g; and a probability value can be assigned to this disposition using a datatype property
has_probability_value [15]. This probability value is what we called the real sensitivity value:18
dSeg,IT,Mhas_probability_valuef2(g,IT,M)
Thanks to our analysis above, we can now answer our original question, and state what sensitivity estimates such as estimateSe1 or estimateSe2 are about
19
- namely, about this disposition:
estimateSe1 is_about dSeg1,IT1,M
Also, if the samples s1 and s2 are considered by the statistician as representative enough of a general popula-tiong0encompassingg1andg2, ifRT1andRT2are consid-ered as similar enough to be representative in the same way of the diseaseM, and ifIT1andIT2are considered as similar enough to be representative of a more general index testIT0, then:
estimateSe1,2is_about dSeg0,IT0,M
AsdSeg,IT,Mis an individual, it cannot be related directly to the classesITandM, but only indirectly, through the following formalization. First, dSeg,IT,M can be seen as an instance of a disposition class written DSeIT,M, which has as trigger the process class TSeIT,M: “performance of test IT on the members of a group, and random draw of a person among those who have the disease M”; and as realization the process classRSeIT,Mdefined as“drawing by TSeIT,M of someone who got a positive result to IT”. We can then introduce two new relations sensitivity_dispositio-n_of_test and sensitivity_disposition_for (abreviated as se_of_testandse_for_disease) relatingDSeIT,MwithITandM:
dSeg,IT,Minstance_ofDSeIT,M
DSeIT,Mis_a Disposition
DSeIT,Mse_of_test IT
DSeIT,Mse_for_disease M
These two relations se_of_test and se_for_disease are introduced for pragmatic reasons of facility of use: on a foundational level, DSeIT,M and M (resp. IT) could be re-lated through a complex array of relations and entities that involve the relation has_trigger between DSeIT,M and TIT,MSe , as well as a sequence of relations between TSeIT,M and M (resp. IT). Such an analysis would raise interest-ing theoretical questions, as instances of DSeIT,M can exist even if no instance of M or IT do exist - we therefore face here issues similar to the ones addressed by [20] and [21].
Figure 2 represents classes and particulars involved in formalizing tests execution and results, sensitivity estimates, the disposition this estimate is about, and the real sensitivity value. Figure 3 represents the classes and particulars in-volved in formalizing aggregation of sensitivity estimates into a finer estimate. Specificity, PPV and NPV can be for-malized along similar lines, as data items about dispositions related to tests and diseases through relations that could be labeledsp_of_test, sp_for_disease,ppv_of_test, ppv_for_-disease,npv_of_test,andnpv_for_disease.
Example of application
An example will now illustrate this formalization. McTaggart and colleagues [8] have performed a meta-analysis to determine the accuracy of point-of-care tests
for detecting albuminuria (let’s callIT0the class of such index tests), using as reference test a laboratory test albumin-creatinine ratio-ACR (let’s call RT0 the class of such reference tests).
They take into account ten studies in their article. Consider for example Lloyd et al. [22], which measures the accuracy of semiquantitative Clinitek® microalbumin urine dipstick with a cutoff value indicating albumineria at 3.4 mg/mmol (let’s call IT1 the class of such index tests), with a laboratory ACR test with the same cutoff value as a reference (let’s callRT1the class of such refer-ence tests). A samples1of 204 diabetic patients (labelled here p1,1, p1,2,…, p1,204) was considered. On each of those patients, one measurement ofIT1called a1,i,1and one of RT1 called rt1,i,1 is performed. The 2x204 = 408 processual entities are all part of a general tests execution process labelledtests_executions1,IT1,RT1, which leads after computation to the informational entityestimateSe1, giving the proportion of measure pairs in whichIT1led to a posi-tive result among those in which RT1led to a positive result. This proportion is 83.8 %, and therefore, the value f4(s1,IT1,RT1) of the informational entity
estima-teSe1 is 0.838.
Writinggthe human population, we haves1part_of g; also, RT1 is_a RT0 and IT1 is_a IT0. Therefore, f4(s1,IT1,RT1) provides an estimate of f2(g,IT0,RT0), which is the sensitivity value of a point-of-care test in detecting al-buminuria in the general population. However, other stud-ies are pooled with this one by McTaggart and colleagues [8] to provide a better estimate of f2(g,IT0,RT0). All together, they lead to the value h(s1,IT1,RT1,…,s10,IT10,RT10) which provides an estimate of the value of f2(g,IT0,RT0).
Note that the ten studies taken into account in this meta-analysis include different kinds of patients. Seven studies involve each a different sample of patients (let’s call them s1, s2, …., s7) with diabetes mellitus, one of them (s7) involving young patients with type 1 diabetes. Two studies consider samples of patients (s8 and s9) with kidney disease, diabetes mellitus, or both. Finally, one study includes a sample (s10) of patients treated for advanced chronic kidney disease in a renal outpatient clinic. Let’s call g the human population, g1 the mem-bers of g who have diabetes mellitus,g2the members of
Note also that various cutoff values can be used to de-fine the presence of albuminuria, varying between 2.65 mg/mmol to 3.4 mg/mmol, and those values are chosen by the medical sub-community who is con-ducting the study (the same cutoff value is taken for both IT0 and RT0 in each study). Therefore, the clas-ses IT0 and RT0, which mention ‘detecting albumin-uria’ without specifying a cutoff value, are not scientifically defined: those classes are not universals, but rather collection of particulars [19] whose nature is partly social ([8] acknowledge this limitation in their meta-analysis).
Alternative meta-analysis could use a subset of those studies to estimate various sensitivities, for example the sensitivity f2(g1,IT1,RT1) of point-of-care test with a reference of laboratory ACR test, with albuminuria de-fined as ACR greater than 3.4 mg/mmol, in the refer-ence class of patients with diabetes mellitus; or the sensitivity f2(g2,IT2,RT2) of point-of-care test, with a reference of laboratory ACR test, with albuminuria de-fined as ACR greater than 2.65 mg/mmol, in the refer-ence class of patients with kidney disease; etc. A well-founded semantic representation of sensitivity should thus make clear what is the reference class, as well as the class of index test and reference test.
Discussion and conclusions
We have thus provided a practically tractable formalization of IPs in a realist ontology, which clearly dissociates IPs’real values, their estimates and the related proportion measure-ments. It has defined the central entities that are concerned by an IP estimation in a way that is compliant with OBO Foundry. In particular, it addresses the difficulty of considering possible, non-actual conditions in a realist ontology based on BFO by introducing dispositions.
This model could then be extended in three directions. A first step would be to clarify the ontological status of the two following entities: sample sizes on one hand; and 95 % confidence interval for sensitivity and specifi-city values on the other hand. A second step would be to clarify the relations se_of_test and se_for_disease, which could be reduced to basic relations and entities already accepted in the OBO Foundry. A third step would be to use this model in an ontology-based diag-nostic system that would compute positive predictive values or negative predictive values from the prevalence, sensitivity and specificity values. More generally, it could be articulated with medical Bayesian networks. As a matter of fact, the notion of medical test used here could be generalized to a very general notion of test consisting in inferring the presence of an entity on the basis of the knowledge of the presence of another entity; as such, it could serve as a foundation for the integration of Bayes-ian reasoning into ontologies.
This model could be used in two kinds of computer applications targeted at two different kinds of audiences. First, clinicians could determine more easily which kind of sensitivity and specificity (or PPV and NPV) estimates they could use when diagnosing a disease for a given pa-tient, by having a clearer view of the subjects’ characteris-tics in each samples on which those IP estimates are based. As a matter of fact, section 3.4 illustrates how an ontological analysis can make explicit what are the index test, the reference test and the sample associated with a sensitivity estimation. Universal qualities that are instanti-ated by all members of the sample - such as having dia-betes mellitus, being a man, being more than 65 years old, etc. - would enable to determine what could be the refer-ence classgassociated with a sensitivity estimate. This en-ables to determine, when applying some given IP values to a specific patient with given characteristics, whether this application is warranted or not.
Second, statisticians could determine more easily which kind of sensitivity estimates they could aggregate together. If several estimations of IPs are represented ontologically according to the structure shown above, one could use this ontological structure to determine which estimations of IPs could be combined to obtain a finer estimate. First, one would have to find a groupg0 that would encompass the reference classes (such asg1 andg2) associated with those studies. Second, one would have to analyze whether there exists some general index test class such as IT0(resp. some general reference test class such as RT0) which would subsume the various index tests classes such as IT1 and IT2 (resp. reference tests such asRT1andRT2) that are used in those studies. Once those are found, one could use meta-analytic methods to derive a value for f2(g0,IT0,RT0) from the other studies. Future work will aim at building an ontol-ogy of medical tests to facilitate finding such encompass-ing index and reference test classes.
As it takes into account the dependence of IPs upon the group of people considered, it has the potential to contribute to the development of precision medicine [23] in context of learning health systems [24, 25], an emerging approach that takes into consideration patients characteristics and dispositions, including individual variability in genes, to offer more personalized prevent-ive, diagnostic and therapeutic strategies.
Endnotes
1
(such as a glycemia higher than 1.26 g/l). Several tests results can then be considered to draw a diagnostic conclusion for a disease. Therefore, in the general case, indicators of performance are indicators ofassay perform-ance rather than indicators ofdiagnosticperformance (we thank an anonymous reviewer for this suggestion of ter-minology). Also, a test does not need to be performed on a human–it can be performed on a non-human animal. In the following, we will consider tests aiming at diagnos-ing a disease on a human, but our considerations can be straightforwardly adapted to tests aiming at evaluat-ing another medically relevant entity on a human or non-human animal.
2
In practice, such a test is not perfect; thus, it could be analyzed as a chain of two tests: one that detects the rheumatoid factor on the basis of e.g., some chemical re-action, and another one that detects rheumatoid arthritis on the basis of the presence of the rheumatoid factor.
3
More specifically, it should be interpreted as the ex-pected value of such a proportion –but we will ignore here this additional subtlety.
4
The article will concentrate on the case of sensitivity, but it can be similarly adapted to other IPs.
5
Here again (see footnote 3), this should be interpreted as the expected value of such a proportion.
6
At least for all practical purposes: from a theoretical point of view, every measurement can be wrong, even pure observations.
7
If one assumes that the sample is representative of the target population, there should be no selection bias (which occurs when proper randomization is not achieved). However, the sensitivity values that would be obtained using two different samples could be slightly different since randomness at the selection process will yield slightly different samples. That is why statisticians use confidence interval for character-izing sensitivity and specificity.
8
We might also speak of a“sensitivity in a sample”for the function f2(s,IT,M), that is, the proportion of people who are tested positive byITamong the diseased person in the sample s. But it might be confusing to speak of both the“sensitivity in a target population”and the“ sen-sitivity in a sample”; and the first and the second argu-ments above may justify keeping the label “sensitivity” for this proportion in a target populationg –that is, for f2(g,IT,M).
9
Let us summarize. On one hand, f2(g,IT,M) is the value of a non-actual proportion (because the testIT is not performed on all members of g), which cannot be known with certainty, but only estimated. On the other hand, both f4(s,IT,RT) and f2(s,IT,M) (see footnote 8) are values of actual proportions (because the testsITandRT are performed on all members of s); and although f2(s,IT,M) cannot be known with certainty (because we
cannot know with certainty who has the disease: we can only use a reference test–at best the gold standard–to determine who are those individuals), f4(s,IT,RT) can be known with certainty for all practical purposes (because we can know with certainty who got a positive result toRT).
10
We have created an ontology according the lines of what is described below, built on OBI, called BIPO (Bayesian Indicator of Performance Ontology). It can be found at https://github.com/OpenLHS/BIPO. It contains 24 classes, 12 object properties, 2 data properties and 42 logical axioms.
11
We will not take a stance on whether Medical_test should be interpreted as identical to OBI:Assay, as pro-posed by [27].
12
Note that in some cases, several pairs of tests will be performed on a person. See e.g., Kimberger et al. (2007), which measures the accuracy of a temporal artery thermometer in detecting fever (defined as a temperature greater than 37.8 °C), with respect to a reference standard given by a bladder thermometer: four measurement pairs of temporal artery temperature and bladder temperature are performed on each of the seventy patients of the sam-ple considered by the authors. To represent such a case, one can introduce for every humanpia sequence of four reference testsrt1,i,1,rt1,i,2,rt1,i,3andrt1,i,4.and four index testsit1,i,1,it1,i,2,it1,i,3andit1,i,4; but the formalization that is described below remains similar.
13
See e.g., http://vassarstats.net/clin1.html for an ex-ample of webpage supporting this kind of computation.
14
As a reminder, not only the values of PPV and NPV but also the values of sensitivity and specificity depend on the group under consideration (this is the spectrum effect), and it is not the task of the ontologist to deter-mine which ones should be idealized as constant (for all practical matters) across groups and which ones should be considered as variable: the task of the ontologist is to represent those values and the entities those values de-pend upon.
15
[15] assigned a probability to a triplet (d,T,R) rather than to a disposition d, because it had to take into ac-count dispositions that may have several classes of trig-gers or realizations (that is, multi-trigger and multi-track dispositions [20]). However, in the present situation,
dSeg,M is simple-trigger and simple-track: all its triggers are instances ofTSeg , and all its realizations are instances of RSeg,M. Therefore, the probability value assigned to (dSeg,M,TgSe,RSeg,M) can be, for practical matters, assigned dir-ectly todSeg,M.
16
formalized as disposition. However, the disposition to draw randomly, among the individuals ofgwho haveM, someone who is tested positive byIT, exists independently of whether the disease (or a predisposition to this disease) is formalized or not as a disposition. Note also that this disposition inheres in a group of people, whereas a disease as a disposition (as formalized by OGMS), or a predispos-ition to a disease, inheres in a single person.
17
In general, we cannot determine in practice with cer-tainty which individuals of ghave M, and which do not (see the discussion about gold standard tests above); but the practical impossibility to realize this trigger does not preclude to define this entity.
18
We could also introduce the entity real_sensitivity -g,IT,Minstance ofData_item, as a sibling ofestimateSe1 such that real_sensitivityg,IT,M has_specified_value f2(g,IT,M) (cf. [14], in which real_sensitivityg,IT,M was denoted
seg,IT,M). However, the value f2(g,IT,M) assigned to such an entity will never be known with certainty. We could substi-tute to this value the best estimate of the sensitivity value, as was proposed in [14]; however, such a model could not represent in a single ontology various estimates of the same sensitivity – whereas it is possible in the present framework, which also makes unnecessary the introduc-tion of the informaintroduc-tional entityreal_sensitivityg,IT,M.
19
It is important to differentiate what a sensitivity esti-mate is about (namely a disposition) from how it has been mathematically obtained (for example, by weight-ing different proportion measurements) – as explained earlier, the latter will not be represented in the ontology, as various mathematical methods can be used.
Abbreviations
General abbreviations for indicators of performance
IP:(Bayesian) Indicators of performance; NPV: Negative predictive value; PPV: Positive predictive value; Prev: Prevalence; Se: Sensitivity; Sp: Specificity
Other general abbreviations
ACR:Albumin-creatinine ratio; RF: Rheumatoid factor
Classes and instances abbreviations for disposition-related entities
dPrev
g,M:Disposition (borne by the groupg) that a person randomly drawn among the individuals ingwould haveM;dSeg,IT,M: Disposition (borne by the
groupg) that a person randomly drawn among the individuals ofgwho haveMwould have a positive result toIT; this is an instance ofDSe
IT,M;DSeIT,M: A
subclass ofSensitivity dispositionsuch thatDSe
IT,Mse_for_disease MandDSeIT,M
se_of_test IT;DSpIT,M: A subclass ofSpecificity dispositionsuch thatDSpIT,M
sp_for_disease MandDSp
IT,Msp_of_test IT;Tg: The process of drawing randomly
a person ing; the triggers ofdPrev
g,M are instances ofTg;TSeg,IT,M: The process of
performing testITon the individuals ing, and then drawing randomly an individual among those who have the diseaseM; the triggers ofdSeg,IT,Mare
instances ofTSe
g,IT,M;Rg,M: The process of drawing byTgsomeone who hasM;
the realizations ofdPrev
g,M are instances ofRg,M;RSeg,IT,M: The process of drawing
byTSe
g,IT,Msomeone who got a positive result toIT; the realizations ofdSeg,IT,M
are instances ofRSeg,IT,M;
Other classes abbreviations
IT / IT0/ IT1/ IT2:A subclass ofMedical testwhich is an index test (test whose indicator of performance is being estimated);M: A subclass ofDisease;RT / RT0/ RT1/ RT2: A subclass ofMedical testwhich is a reference test
Other instances abbreviations
g/g0/g1/g2:An instance ofCollection of humanswhich is a general
human population;pi/ qj: An instance ofHuman;it1,i(resp.it2,j): An instance
of (index)Medical testperformed on personpi(resp.qj);rt1,i(resp.rt2,j): An
instance of (reference)Medical testperformed on personpi(resp.qj);s/s1/
s2: An instance ofSample of humans;
Functions abbreviations
f1(IT,M):Proportion of individuals who get a positive result toIT, among individuals who haveM; f2(g,IT,M): Proportion, among members ofgwho
haveM, of those who would get a positive result toIT if the test IT was realized on them; this is the real sensitivity value ofITforM;
f3(g,IT,RT): Proportion, among members ofgwho would get a positive result
toRT if the test RT was realized on them, of those who would get a positive result toIT if the test IT was realized on them; f4(s,IT,RT): Proportion, among
members of sampleswho had a positive result toRT, of those who got a positive result toIT;this is an estimate of the real sensitivity value ofITforM, performed on a samples, withRTas a reference test; f’2(g,IT,M): Proportion, among members ofgwho don’t haveM, of those who would get a negative result toIT if the test IT was realized on them; this is the real specificity value ofITforM; f’4(s,IT,RT): Proportion, among members of sample
swho had a negative result toRT, of those who got a negative result toIT;
this is an estimate of the real specificity value ofITforM, performed on a samples, withRTas a reference test; h(s1,IT1,RT1,s2,IT2,RT2): Estimate of the
sensitivity value obtained by aggregating the estimate on samples1and the
estimate on samples2
Acknowledgements
We would like to thank two anonymous reviewers for their comments that led to significant improvements in our model and in the manuscript, as well as assistance during various presentations of this work for their suggestions. ABa would like to thank the bourse de fellowship of the department of medicine of Sherbrooke University for financial support. This manuscript is an extended version of work presented at ICBO (International Conference on Biomedical Ontology) 2015.
Authors’contributions
ABa conceived the formalization of the real indicator of performance values, JFE and ABa conceived the formalization of the estimation of indicators of performances, and ABa and JFE developped the BIPO ontology, in light of inputs from ABu and RD. JFE and RD provided the medical examples supporting the formalization.
ABa drafted the manuscript with important feedbacks from JFE, RD and ABu. All authors read and approved the final manuscript.
Competing interests
The authors declare that they have no competing interests.
Author details
1
Département de médecine, Université de Sherbrooke, Sherbrooke, Québec, Canada.2INSERM UMR 1099, LSTI, Rennes, France.3CHU de Martinique, Université Antilles-Guyane, Fort-de-France, France.4INSERM UMR_S 1138 Eq 22, Université Paris Descartes, Hôpital européen Georges Pompidou, AP-HP, Paris, France.5Centre de recherche du CHUS, CIUSSS de l’Estrie-CHUS, Sherbrooke, Québec, Canada.
Received: 2 February 2016 Accepted: 6 September 2016
References
1. Ledley RS, Lusted LB. Reasoning foundations of medical diagnosis. Science. 1959;130:9–21.
2. Peacock J, Peacock P. Oxford Handbook of Medical Statistics. Oxford: Oxford University Press; 2011.
3. Brenner H, Gefeller O. Variation of sensitivity, specificity, likelihood ratios and predictive values with disease prevalence. Stat Med. 1997;16:981–91. 4. Park HB, Yokota A, Gill HS, El Rassi G, McFarland EG. Diagnostic accuracy of
clinical tests for the different degrees of subacromial impingement syndrome. J Bone Joint Surg Am. 2005;87:1446–55.
5. Hanson V, Rexler ED, Kornreich H. The relationship of rheumatoid factor to age of onset in Juvenile rheumatoid arthritis. Arthritis Rheum. 1969;12:82–6. 6. Moons KGM, van Es G-A, Deckers JW, Habbema JDF, Grobbee DE. Limitations
7. Niven DJ, Gaudet JE, Laupland KB, Mrklas KJ, Roberts DJ, Stelfox HT. Accuracy of peripheral thermometers for estimating temperature: a systematic review and meta-analysis. Ann Intern Med. 2015;163:768–77. 8. McTaggart MP, Newall RG, Hirst JA, Bankhead CR, Lamb EJ, Roberts NW,
Price CP. Diagnostic accuracy of point-of-care tests for detecting albuminuria: a systematic review and meta-analysis. Ann Intern Med. 2014;160(8):550–7. 9. Reilly P, Macleod I, Macfarlane R, Windley J, Emery R. Dead men and
radiologists don’t lie: a review of cadaveric and radiological studies of rotator cuff tear prevalence. Ann R Coll Surg Engl. 2006;88:116–21. 10. Smith B, Ashburner M, Rosse C, Bard J, Bug W, Ceusters W, Goldberg LJ, Eilbeck K,
Ireland A, Mungall CJ. The OBO Foundry: coordinated evolution of ontologies to support biomedical data integration. Nat Biotechnol. 2007;25:1251–5. 11. Grenon P, Smith B, Goldberg L. Biodynamic ontology: applying BFO in the
biomedical domain. In: Pisanelli D, editor. Ontologies in medicine. Amsterdam: Ios Press; 2004. p. 20–38.
12. Ceusters W. An information artifact ontology perspective on data collections and associated representational artifacts. Stud Health Technol Inform. 2012;180:68–72.
13. da Costa PCG, Laskey KB, Laskey KJ. PR-OWL: A Bayesian Ontology Language for the Semantic Web. In: Costa PCG, d'Amato C, Fanizzi N, Laskey KB, Laskey KJ, Nickles M, Pool M, editors. Uncertainty Reasoning for the Semantic Web I. Berlin: Springer; 2008. p. 88–107.
14. Soldatova LN, Rzhetsky A, De Grave K, King RD. Representation of probabilistic scientific knowledge. J Biomed Semant. 2013;4 Suppl 1:S7. 15. Barton A, Duvauferrier R, Burgun A. Formalization of indicators of di
agnostic performance in a realist ontology. In: Couto F M, Hastings J, editors. Proceedings of 6th International Conference on Biomedical Ontology (ICBO2015). CEUR Workshop Proceedings 1515, CEUR-WS.org; 2015. p. 63-70.
16. Zheng J, Harris MR, Masci AM, Lin Y, Hero A, Smith B, He Y. OBCS: The Ontology of Biological and Clinical Statistics. In: Hogan W, Arabandi S, Brochhausen M, editors. Proceedings of the 5th International Conference on Biomedical Ontology. Houston: CEUR Workshop Proceedings; 2014. p. 65. 17. Brinkman RR, Courtot M, Derom D, Fostel JM, He Y, Lord P, Malone J,
Parkinson H, Peters B, Rocca-Serra P, Ruttenberg A, Sansone S-A, Soldatova LN, Stoeckert Jr CJ, Turner JA, Zheng J, OBI consortium. Modeling biomedical experimental processes with OBI. J Biomed Semant. 2010;1 Suppl 1:S7. 18. Jansen L, Schulz S. Grains, components and mixtures in biomedical
ontologies. J Biomed Semant. 2011;2:S2.
19. Smith B, Ceusters W. Ontological realism: A methodology for coordinated evolution of scientific ontologies. Appl Ontol. 2010;5:139–88.
20. Röhl J, Jansen L. Representing dispositions. J Biomed Semant. 2011;2 Suppl 4:S4. 21. Schulz S, Martínez-Costa C, Karlsson D, Cornet R, Brochhausen M, Rector A.
An Ontological Analysis of Reference in Health Record Statements. In: Garbacz P, Kutz O, editors. Proceedings of the 8th International Conference on Formal Ontology in Information Systems (FOIS2014). Amsterdam: Ios Press; 2014. p. 289–302.
22. Lloyd, Mariana M, Johannes K, H. Van Jaarsveld. Evaluation of point-of-care tests for detecting microalbuminuria in diabetic patients. South African Family Practice 53.3. 2011;281–286.
23. Mirnezami R, Nicholson J, Darzi A. Preparing for precision medicine. N Engl J Med. 2012;366:489–91.
24. Delaney BC, Curcin V, Andreasson A, Arvanitis TN, Bastiaens H, Corrigan D, Ethier J-F, Kostopoulou O, Kuchinke W, McGilchrist M, Van Royen P, Wagner P. Translational medicine and patient safety in Europe: TRANSFoRm—architecture for the Learning Health System in Europe. BioMed Res Int. 2015;2015:1–8. 25. Friedman C, Rubin J, Brown J, Buntin M, Corn M, Etheredge L, Gunter C,
Musen M, Platt R, Stead W, Sullivan K, Van Houweling D. Toward a science of learning systems: a research agenda for the high-functioning Learning Health System. J Am Med Inform Assoc. 2014;22(1):43-50.
26. Scheuermann RH, Ceusters W, Smith B. Toward an ontological treatment of disease and diagnosis. San Francisco: Proceedings of the 2009 AMIA Summit on Translational Bioinformatics; 2009. p. 116–20.
27. Jensen M, Cox AP, Bona JP, Duncan W, Ray PL, Diehl AD. Applications of OBI“assay.”. In: Hogan W, Arabandi S, Brochhausen M, editors. Proceedings of the 5th International Conference on Biomedical Ontology. Houston: CEUR Workshop Proceedings; 2014. p. 96–7.
• We accept pre-submission inquiries
• Our selector tool helps you to find the most relevant journal
• We provide round the clock customer support
• Convenient online submission
• Thorough peer review
• Inclusion in PubMed and all major indexing services
• Maximum visibility for your research
Submit your manuscript at www.biomedcentral.com/submit