R E S E A R C H
Open Access
The strength of co-authorship ties
through different topological properties
Michele A. Brandão
*and Mirella M. Moro
Abstract
Social networks are complex structures that describe individuals (graph nodes) connected in any social context (graph edges). Different metrics can be applied to those networks and their properties in order to understand behavior and even predict the future. One of such properties is tie strength, which allows to identify prominent individuals, analyze how relationships play different roles, predict links, and so on. Here, we specifically address the problem of measuring tie strength in co-authorship social networks (nodes are researchers and edges represent their co-authored publications). We start by presenting four cases that emphasize the problems of current metrics. Then, we propose a new metric for tie strength, calledtieness, that is simple to calculate and better differentiates the degrees of strength. Accompanied with a nominal scale, tieness also provides better results when compared to the existing metrics. Our analyses consider three real social networks built from publications collected from digital libraries on Computer Science, Medicine, and Physics. Finally, we also make all datasets publicly available.
Keywords: Academic social networks, Weak ties, Topological properties, Computer Science
Introduction
Social networks are complex structures that describe individuals in any social context. Theoretically, they can be mapped to graphs where nodes represent the uals and edges connect nodes according to the individ-uals’ relationships. Then, properties and features can be extracted from the graph, and metrics can be applied to nodes and edges in order to better understand the indi-viduals’ social behavior. Finally, there are many interesting applications based on such networks, including (but defi-nitely not limited to) ranking individuals and their groups, link prediction, information diffusion, recommendation, and pattern analysis (e.g., [5, 14, 22]).
One of such properties is the strength of ties (given by the graph edges). Initial studies of social networks have emphasized the importance of properly measuring tie strength to understand social behaviors [17, 25]. More recently, analyzing how strong a tie is has allowed to inves-tigate the different roles of relationships including ranking for influence detection [14], identifying impact at micro-macro levels in the network [7], its influence in patterns of communications [31], and team formation [8].
*Correspondence: [email protected]
Departamento de Ciência da Computação - Universidade Federal de Minas Gerais, Belo Horizonte, MG, Brazil
Despite the importance of analyzing the strength of ties, there are not many studies on evaluating how to mea-sure it in scientific collaboration networks (also called co-authorship networks). In such networks, nodes are researchers and there is an edge between those pairs that have co-authored at least one scientific publication. Specifically, studying the strength of co-authorship ties may reveal how its behaviors relate to research and how any application based on co-authorship patterns may ben-efit. For instance, new strength-related metrics could help existing works on measuring research productivity [12] and ranking researchers [14] and their graduate programs [21], as well as recommending collaborations [5].
Furthermore, properly measuring the strength of co-authorship ties may help to identify which collaborations are more influent to each researcher. For example, if a researcher A collaborates with other researchers B and C, the strength of ties reveals which one is more important to A, then allowing different studies, such as team forma-tion analyses. Also, researchers that form mostly weak (or strong) ties in the social network may indicate different collaboration patterns, for example, a researcher who has many collaborators through single papers, i.e., that person has collaborated only once with many people.
Overall, tie strength may be measured by a combina-tion of the amount of time, the cooperacombina-tion intensity, and
the reciprocal services that characterize the tie [17]. Such strength may also be measured by using theneighborhood overlapmetric [4, 13], a topological property that captures the total number of collaborations between the two ends of each edge and identifies the edges forming bridges in a community (set of nodes that are densely connected). The advantages of using such metric are its simple computa-tion, the possibility to identify if ties are bridges or not, and the inclusion of neighbors to calculate tie strength (then allowing to analyze how a tie is in the social network, for example, isolated or not).
Another metric that has been largely used to mea-sure the intensity of co-authorship between ties is the absolute frequency of interaction (the number of publi-cations between pairs of researchers) [29, 32]. Besides its simple calculation, another advantage is the represen-tation of the exact frequency of collaboration between ties. However, we find a few problems in both metrics that complicate their sole use to measure the strength of co-authorship ties, such as presenting extreme values that do not represent reality. The existence of such prob-lems suggests the metrics should be considered together and with other social network (SN) properties to better measure tie strength.
To overcome such limitations, this work proposes a new metric, calledtieness, that helps to define a tie as weak or strong.1Note the goal of tieness is not to replace neigh-borhood overlap and absolute frequency of interaction, but to be an additional feature that may allow deeper and complementary analyses.
In summary, tieness is an easy-computing metric that considers the neighbors and the intensity of co-authorships between researchers to measure tie strength. It differs from the existing ones by combining relevant aspects from the social network. Moreover, tieness can solve problems present in neighborhood overlap and weight (a simpler way to call absolute frequency of interac-tion), which have been largely used to measure tie strength [13, 26]. It may also be applied to different social net-works, not only co-authorship social netnet-works, e.g., a movie-producing network such as the one in [30].
After discussing the methods (“Methods overview” section), we present the contributions of this paper, sum-marized as follows:
– We discuss four case studies where neighborhood overlap and absolute frequency of interaction alone have problems to measure the strength of ties. Also, we show the relationship between both metrics in three real datasets built from digital libraries of dis-tinct fields—Computer Science with DBLP2, Medicine with PubMed3, and Physics with APS4 (“Neighbor-hood overlap and absolute frequency of interaction” section).
– We propose a new metric called tieness that is a combination between a modification in neighborhood overlap and absolute frequency of interaction. It is easy to calculate and better differentiate tie strength in dif-ferent levels. We also introduce a nominal scale to tieness based on the values of a modified neighbor-hood overlap and absolute frequency of interaction. Such nominal scale allows to identify when a tie is weak or strong and if it links researchers from differ-ent communities or not (“Tieness: a new metric for the strength of ties” section).
– We validate tieness and its nominal scale according to Granovetter’s theory by removing weak and strong ties (“Results and discussion” section).
We finish this article by discussing previous work in the “Related work” section and final remarks in the “Conclu-sion” section.
Methods overview
The main goal of this article is to propose a new met-ric to measure the strength of co-authorship ties. In order to do so, we empirically evaluate four cases in which existing metrics commonly used to measure tie strength (neighborhood overlap and absolute frequency of interac-tion) present problems. Then, we propose our new metric calledtienessfocusing on solving these problems.
Next, we analyze the linear and non-linear correlation between neighborhood overlap (NO) and absolute fre-quency of interaction (W). The result of such correlation helps to identify whether both metrics are independent, i.e., whether they add or multiply when taken together. We do so by analyzing the relationship between both metrics on academic social networks from three different areas of expertise. The areas and their datasets are (i) Computer Science given by DBLP (collected in September 2015), (ii) Medicine by PubMed (April 2016), and (iii) Physics by APS (March 2016). For DBLP, we split it into two datasets: DBLP articles and DBLP inproceedings. For PubMed (a US national library of the Medicine National Institute of Health that comprises biomedical publications), we con-sider publications from the top-20 journals classified by h-index. For APS (American Physical Society), we con-sider a sample dataset with its journal publications. Then, we build a co-authorship SN for each dataset with features shown in Table 1.
Table 1Datasets and their basic statistics and information
Dataset Number
of nodes
Number of edges
Period
DBLP articles 837,583 2,935,590 2000 to 2015
DBLP inproceedings 945,297 3,760,247 2000 to 2015
PubMed 443,784 5,550,294 2000 to 2016
APS 180,718 821,870 2000 to 2013
In the following, we propose a nominal scale to tieness by analyzing the ECDFs (Empirical Cumulative Distribu-tion FuncDistribu-tions [20]) of neighborhood overlap, absolute frequency of interaction, modified neighborhood overlap, and tieness for each social network. ECDF is a graph used to evaluate the data distribution, estimate percentiles, and compare distinct distributions. The analysis of such graph reveals the percentile of data that falls below a specific value.
Finally, we validate such nominal scale by following Gra-novetter’s theory, which claims that weak ties connect nodes from different communities, whereas the strong ones link nodes from the same community. In other words, weak ties are acquaintances and provide access to novel information, while strong ties represent relation-ships with people whose social circles overlap. In order to follow this theory, we remove weak and strong ties at a time and analyze the effect of such removals in the co-authorship social networks.
Neighborhood overlap and absolute frequency of interaction
In this section, we first present four cases in which neigh-borhood overlap and absolute frequency of interaction cannot be solely used to measure tie strength. Then, we empirically show their relationship on three different networks.
Four motivating cases
We have empirically studied different co-authorship social networks and identified four cases in which existing met-rics cannot be solely used to measure tie strength. Such study considers three different networks and the two main metrics: neighborhood overlap (NO) and absolute frequency of interaction (W).
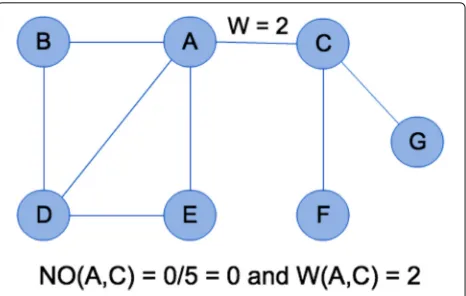
Case 1: a pair of collaborators without any common neighbor. One of the problems of using only NO to mea-sure the strength of ties is when an author has a high frequency of collaboration with another author but they do not have anycommon neighbor. In this case, the NO is zero, which does not represent reality. Figure 1 exem-plifies this case. Another problem here is that NO andW
present contradictory results. Analyzing NO, the pairA,C
Fig. 1Case 1: no common co-author
is a bridge as the strength of co-authorship is very weak. At the same time, W may indicate that such tie is not very weak. Therefore, considering both metrics is better to analyze how strong a tie is.
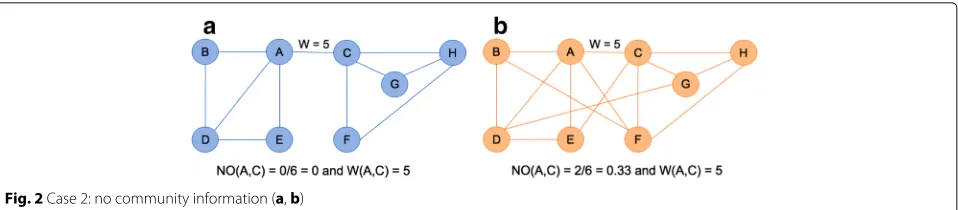
Case 2: determining if two collaborators are from the same community or not. One problem in measuring the strength of ties using onlyWis that such metric provides a simple vision of the relationship. It is not possible to know if the relationship is intracommunity or not. This case is exemplified by Fig. 2. Since ties with lowW may be intracommunity and ties with high W may be inter-communities, using onlyW is not enough to assess how weak/strong a tie is (i.e., it does not allow to properly ver-ify Granovetter’s theory [17], in which weak ties serve as bridges in the network).
Case 3: little collaboration between a pair of col-laborators and plenty of common neighbors. In this case, NO and W give values with opposite meaning, i.e., high NO and low W. Such results make it hard to define tie strength. Certainly, it depends on the analysis of the context. However, following Granovetter’s theory, such tie should be strong. Figure 3 gives an example of this case.
Fig. 2Case 2: no community information (a,b)
Based on these four cases, we claim that developing a new metric for tie strength is necessary. Then, after exper-imentally analyzing both metrics in the “Analysis of NO andW over different networks” section, we introduce a new one in the “Tieness: a new metric to measure the strength of ties” section.
Analysis of NO andWover different networks
We now analyze the relationship between neighbor-hood and absolute frequency of interaction on DBLP, PubMed, and APS. As we consider co-authorship social networks, we call absolute frequency of interaction as
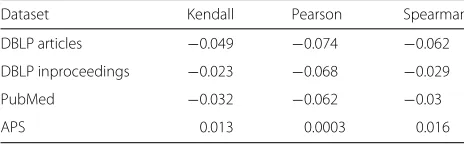
co-authorship frequency, which measures the amount of publications that a pair of researchers has co-authored. Table 2 presents the correlation between both metrics for each dataset considering three coefficients: Kendall measures the degree of non-linear dependence between two variables; Pearson evaluates the linear relationship between two variables; and Spearman is more appropri-ate to measure the non-linear association between two variables [1, 18].
Overall, the correlation between neighborhood over-lap and co-authorship frequency is small for the three coefficients. Therefore, neighborhood overlap and co-authorship frequency are monotonically and linearly
independent in the three datasets. In other words, both metrics are important to measure the strength of ties as they capture different characteristics of the social net-work.
Fig. 3Case 3: many common co-authors
Tieness: a new metric for the strength of ties
Motivated by the problems generated by using neighborhood overlap and co-authorship frequency (coAfrequency—a short name to the absolute frequency of interaction in the co-authorship social network con-text) alone to measure tie strength, we now introduce a new metric calledtieness. Specifically, tieness results from a combination between a modification in neighborhood overlap (entitled modified neighborhood overlap), which captures the social circle of nodes involved in a tie, and co-authorship frequency, which represents the absolute number of publications common to a pair of researchers, as shown by Eq. 1.
tienessi,j=
N(vi)∩N
vj+1
1+N(vi)∪N
vj−
vi,vj
coAfrequencyi,j
(1)
where N(vi) represents the co-authors (neighbors) of
researcher vi andN
vj
the co-authors of vj. Note that
we sum one at the numerator of neighborhood overlap to indicate that there is a link betweenviandvj. This solves
the problem when a pair of authors does not have any co-author in common. Then, we sum one at the denom-inator to give the right proportion to the equation. Also, for unweighted social networks, tieness value is the same as the modified neighborhood overlap.
Regarding computation time cost of tieness, the operations with the highest time cost are intersection
(O(N(vi) + N(vj))) and union (O(min(N(vi),N(vj))))
using hash tables. Thus, the time complexity of tieness is O(max(N(vi),N(vj)))—Big O notation property:
O(min(N(vi),N(vj))) + O(N(vi) + N(vj)) = O(min
(N(vi),N(vj))+N(vi)+N(vj))=O(max(min(N(vi),N
(vj)),N(vi),N(vj)))[10].
Fig. 4Case 4: results too small/high (a,b)
appropriate, because the norm of the coAfrequency vec-tor is very high, which reduces most of the weights to the magnitude of 104. Regarding the second method, it means to fit the data within unity (1), so all data will be in the range 0 to 1. However, sometimes it is important to choose a different range to the data. The unity-based normaliza-tion allows to normalize the data within a selected range. Thus, let the co-authorship frequency of all edges in the social network be defined as a vector coAfrequency that represents each data pointk(i.e., value of the edge). Then, the unity-based normalization is computed by
||coAfrequencyi,j||
=a+
coAfrequencyk−min(coAfrequency)(b−a)
max(coAfrequency)−min(coAfrequency) (2)
where coAfrequencyk is the k-value in the vector coAfrequency, min(coAfrequency)is the minimum value among all the sets of co-authorship frequency in the social network (i.e., the minimum value in coAfrequency), and max(coAfrequency)is the maximum value among all the sets of co-authorship frequency (i.e., the maximum value in coAfrequency). Moreover, a and b define the range of values for the co-authorship frequency, i.e., the data will be normalized in that range. Here, we selecta = 1 andb = 2, because considering the range [ 0, 1] makes the value of neighborhood overlap be annulled when the co-authorship frequency is 1 without the normalization. Thus, the range [ 1, 2] guarantees that the co-authorship
Table 2The correlation coefficients between neighborhood overlap and co-authorship frequency
Dataset Kendall Pearson Spearman
DBLP articles −0.049 −0.074 −0.062
DBLP inproceedings −0.023 −0.068 −0.029
PubMed −0.032 −0.062 −0.03
APS 0.013 0.0003 0.016
Allpvalues are smaller than 2.2e−16
frequency can indeed contribute to increase the value of tieness.
Such improvement is presented in Eq. 3, where tienessi,j
is in the range [ 0; 4]. Then, we divide the equation by 4 to put tienessi,jin the range [ 0; 1].
tienessi,j=
|N(vi)∩N(vj)|+1
1+|N(vi)∪N(vj)|−{vi,vj} ||coAfrequencyi,j||
4
(3)
where||coAfrequencyi,j||is the co-authorship frequency of a pair of researchersviandvjas unity-based normalized
by Eq. 2.
Tieness is calculated for each edge (pair of nodes) in the social network. Let tieness be a vector that contains tienessi,jfor each edgekin the social network. Thus, the
overall level of tieness in a social network is measured by the average of the tieness values of all edges:
tieness= 1 |E|
|E|
k=1
tienessk (4)
where tienessk is the value of tieness for each edge in the social network and |E| is the number of edges in the social network. Also, the time complex-ity of the algorithm to measure the overall tieness is
O|E| maxN(vi),N
vj
.
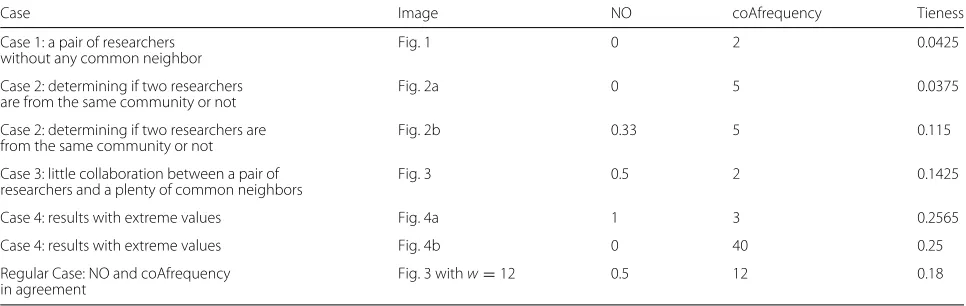
Table 3Tieness for each case study and an extra case study representing the situation when NO and coAfrequency are in accordance
Case Image NO coAfrequency Tieness
Case 1: a pair of researchers Fig. 1 0 2 0.0425
without any common neighbor
Case 2: determining if two researchers Fig. 2a 0 5 0.0375
are from the same community or not
Case 2: determining if two researchers are Fig. 2b 0.33 5 0.115
from the same community or not
Case 3: little collaboration between a pair of Fig. 3 0.5 2 0.1425
researchers and a plenty of common neighbors
Case 4: results with extreme values Fig. 4a 1 3 0.2565
Case 4: results with extreme values Fig. 4b 0 40 0.25
Regular Case: NO and coAfrequency Fig. 3 withw=12 0.5 12 0.18
in agreement
Note that coAfrequency is normalized considering only the values in the table to compute tieness. Thus, min(coAfrequency) = 2 and min(coAfrequency) = 40
represent a strong tie. Such results cannot be used to iden-tify if the tie belongs to a community and if it is a bridge or not.
Indeed, an advantage of using our new metric is the values of tie strength are more distinct, then allowing to better differentiate the strength of a tie and establish different levels of tie strength. Moreover, we can con-sider the value of the modified neighborhood overlap and co-authorship frequency separately to evaluate the final result of tieness. Thus, the definition of a nominal scale is necessary to identify when a tie is weak or strong.
We define a nominal scale to tieness by comparing the modified neighborhood overlap and co-authorship fre-quency. In doing so, we follow concepts discussed by Easley and Kleinberg [13]: a weak tie has a small neighbor-hood overlap and a strong tie has a large one.
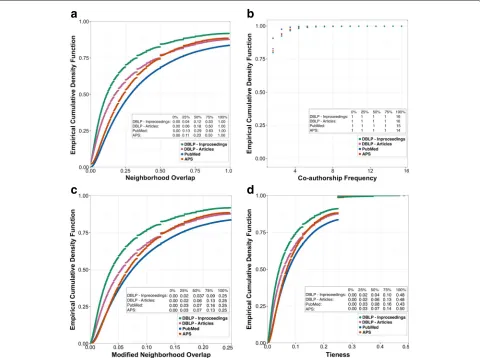
Therefore, Fig. 5 shows the ECDFs and quartiles for neighborhood overlap, co-authorship frequency, mod-ified neighborhood overlap, and tieness. The analysis of ECDFs shows that co-authorship frequency provides many repeated results to the strength of ties, as 50% of the data are equal to 1. On the other hand, the neigh-borhood overlap, modified neighneigh-borhood overlap, and tieness provide different results for each quartile. Fur-thermore, considering the neighborhood overlap’s ECDFs of each dataset, they are very different from each other. For example, the values of APS’s ECDF are different from PubMed’s ECDF. However, modified neighborhood over-lap and tieness ECDFs have similar values through dif-ferent datasets. This result may indicate that tieness is less sensible to the dataset and better distinguishes the relationship between nodes.
Having studied such distributions, we may now consider the values of quartiles to define a nominal scale. In other words, the quartiles’ distributions help to identify when a tie is weak or strong and if it connects different com-munities or not. Equation 5 shows the nominal scale to tieness based on the quartiles. Note for an unweighted
social network, such scale is also valid because modified neighborhood overlap has the same value as tieness to the second and third quartiles.
⎧ ⎪ ⎨ ⎪ ⎩
weak, tieness0.10
moderate, 0.10<tieness<0.43 strong, 0.43tieness
(5)
Results and discussion
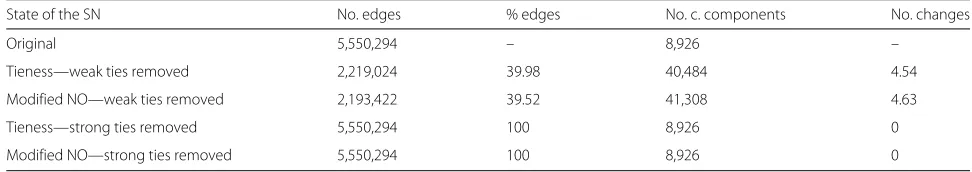
In order to validate the proposed nominal scale, we verify if Granovetter’s theory governs the social net-work and the strength of ties with such values. Given that weak ties are bridges that connect different parts of the network, his theory claims the network tends to be more disconnected when weak ties are removed (i.e., the number of connected components tends to increase). Hence, we analyze the number of connected compo-nents in the social network after removing weak and strong ties.
Tables 4, 5, 6, and 7 present the number of edges and connected components after removing weak and strong ties in each dataset. Also, we show results when the strength of ties is measured by tieness (weighted SN) and modified neighborhood overlap (considering the SN as unweighted). According to these tables, when weak ties are removed, the number of connected components is higher than when removing strong ties. Also, there are differences between the result for modified neigh-borhood overlap and tieness, which is caused by the co-authorship frequency of interaction. Moreover, the number of removed edges is larger when weak ties are removed. Indeed, the larger number of connected compo-nents may be explained by the larger removal of bridging edges.
a
b
c
d
Fig. 5ECDF of each metric (a–d). In this scenario, modified neighborhood overlap and tieness metrics have more distinct values through the quartiles
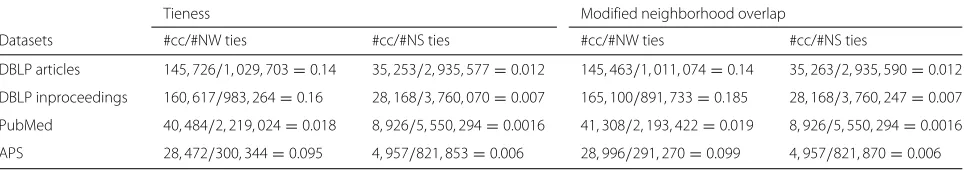
presents these proportions. The analysis of such propor-tions shows that the number of connected components per edge is larger when weak ties are removed. Thus, the nominal scale is valid. Moreover, as the removal of weak ties (defined according to the nominal scale) breaks the connected components of the social network, tieness is indeed able to identify when a tie connects different communities or not.
Furthermore, we note that the different research areas considered (Computer Science, Medicine, and Physics) present similar behavior. The presence of weak ties is bigger than the strong ones when they are measured by tieness. This is a result from a network with nodes not very well clustered (regarding their neighbors). In order to verify it, we analyze the clustering coefficient6from the four co-authorship social networks. The results show that
Table 4DBLP articles: number of connected components when weak and strong ties are removed from the social network
State of the SN No. edges % edges No. c. components No. changes
Original 2,935,590 – 35,253 –
Tieness—weak ties removed 1,029,703 35.08 145,726 4.13
Modified NO—weak ties removed 1,011,074 34.34 145,463 4,126
Tieness—strong ties removed 2,935,577 99.99 35,253 0
Modified NO—strong ties removed 2,935,590 100 35,253 0
Table 5DBLP inproceedings: number of connected components when weak and strong ties are removed from the social network
State of the SN No. edges % edges No. c. components No. changes
Original 3,760,247 – 28,168 –
Tieness—weak ties removed 983,264 26.15 160,617 5.7
Modified NO—weak ties removed 891,733 23.71 165,100 5.86
Tieness—strong ties removed 3,760,070 99.99 28,168 0
Modified NO—strong ties removed 3,760,247 100 28,168 0
c. componentsconnected components
the highest clustering coefficient is from PubMed (equal to 0.357) and the smallest one is from DBLP inproceedings (equal to 0.16). Thus, the clustering coefficient from the four networks is very small, which justifies the low tieness for the pairs of researchers.
Although tieness is able to better differentiate the strength of ties when compared to neighborhood over-lap and co-authorship frequency, there are limitations. One of them is that tieness classifies a tie as strong when the modified neighborhood overlap and weight are very high. Thus, few ties are classified as strong. A solution to this is changing the nominal scale, but it requires to make more analyses from the social networks. Another limitation is applying tieness in co-authorship social net-works from research areas in which collaborations among researchers arenot a common practice. For example, in the sociology area, the level of collaboration is low [4]. Nonetheless, this is a limitation intrinsic to the definition of co-authorship networks, which should contain a good number of connections for any proper analysis.
Moreover, defining a nominal scale is very hard, because it requires to consider different parameters from the data. Here, the nominal scale of tieness has a simplifying assumption: to consider only the values of the ECDFs and percentiles. Another possibility is to define the nominal scale by combining different properties from the ties in the social networks with tieness in a math model. Then, the nominal scale would be more complete but more complex as well.
Related work
Many studies address tie strength in social networks [4, 6, 8, 16, 17, 31]. Following Granovetter’s theory [17],
ties are weak when they serve as bridges in the network by connecting users from different groups, and strong when they link individuals in the same group. All previous studies contextualize the importance of our work to use different networks to corroborate previous insights, such as when distinct relationships play different roles, ties have large impact at the micro-macro level in the network depending on their strength, the influences in the patterns of communications, and so on.
Specifically, those studies consider the strength of ties in different social networks. For example, Pappalardo et al. [28] propose a definition of tie strength by measuring the interaction between two individuals over three different social channels: Facebook, Twitter, and Foursquare. Also in Facebook, Gilbert and Karahalios [15] classify friend-ship strength based on variables from interaction history (e.g., inbox messages exchanged, days since first or last communication), whereas Kahanda and Neville [19] map four different categories of features: transactional (such as picture postings and groups), network-transactional (con-siders the interaction between a pair of users and the overall interaction of these two users with the remain-ing users), topological (e.g., node degree and number of shared neighbors), and attribute-based features (such as gender and interests). On a different perspective and network (now, Twitter), McGee et al. [23] study if the geographic distance influence the strength of ties among users by considering users’ friends, followers, and recent tweets.
Overall, those methods require an interaction through the history (messages on timeline, tweets, shared check-ins, etc.) to build a predictive model or to measure tie strength. Nonetheless, Wiese et al. [31] show that the
Table 6PubMed: number of connected components when weak and strong ties are removed from the social network
State of the SN No. edges % edges No. c. components No. changes
Original 5,550,294 – 8,926 –
Tieness—weak ties removed 2,219,024 39.98 40,484 4.54
Modified NO—weak ties removed 2,193,422 39.52 41,308 4.63
Tieness—strong ties removed 5,550,294 100 8,926 0
Modified NO—strong ties removed 5,550,294 100 8,926 0
Table 7APS: number of connected components when weak and strong ties are removed from the social network
State of the SN No. edges % edges No. c. components No. changes
Original 821,870 – 4,957 –
Tieness—weak ties removed 300,344 36.54 28,472 5.74
Modified NO—weak ties removed 291,270 35.44 28,996 5.85
Tieness—strong ties removed 821,853 99.99 4,957 0
Modified NO—strong ties removed 821,870 100 4,957 0
c. componentsconnected components
accuracy of methods based only on interaction history may be misleading. Then, Zignani et al. [33] disregard his-tory and classify Facebook ties as interactive (strong) or non-interactive (weak) at their creation time. They con-sider topological features, interaction-graph features, and temporal features in supervised learning classifiers. In summary, these more recent studies favor the importance of developing metrics based on other information besides interaction history.
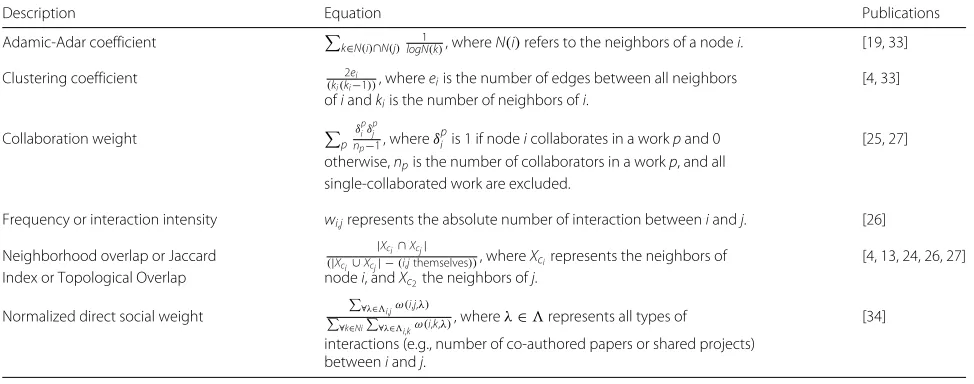
Whereas all the aforementioned studies rely on datasets from social networks that include people interaction, there are also studies on datasets without such infor-mation. Specifically, for academic social networks, the data available comes from collaboration between authors and/or publications [9, 11]. Not having the over-used social interaction, data requires new and better topolog-ical features. Hence, Table 9 shows different topologtopolog-ical properties that have been used to measure tie strength on such context. We emphasize that neighborhood overlap is the metric most used in such measurement. Also, note that we present the clustering coefficient which is not a metric for a pair of nodes, but it is commonly used to mea-sure the strength of a node in the social network regarding its neighbors. The clustering coefficient is computed for a nodeiand a nodej. Then, the clustering coefficient of both nodes is used to measure the strength of the tie.
In this context, we propose a new topological feature and a nominal scale that help to measure tie strength in co-authorship social networks. Our new metric is based on neighborhood overlap and the absolute frequency of interaction among researchers. Our new metric differs from the existing ones [4, 13, 19, 25–27, 33, 34] by
combining these two simple metrics commonly used to measure tie strength. Also, tieness is ideal for networks without much information available, such as academic social networks. Thus, this work is a step forward on social network metrics.
Conclusion
In the context of academic social networks, we identified problems with using solely a modification in neighbor-hood overlap and absolute frequency of interaction to measure the strength of co-authorship ties. Then, we pre-sented a new metric to measure such tie strength, called tieness, which has relatively low computational cost and can be applied to other social network types (since tieness is a topological feature). Also, the definition of tieness comes with a nominal scale that allows to identify when a tie is weak or strong and if it links researchers from different communities or not. The main limitation to such a new metric is that the network must have nodes collaborating with each other.
We have performed empirical studies considering the networks from three different areas of expertise (Com-puter Science, Medicine, and Physics). Overall, our anal-yses showed that tieness provides more distinct values through the ties than neighborhood overlap and absolute frequency of interaction. Such distinction is important to better compare how strong (weak) a tie is regarding another one. We also observed similar behavior through the three different research areas.
Furthermore, all the four co-authorship social networks are dominated by the presence of weak ties. This is so, because most pairs of researchers have low amount of
Table 8Proportion between the number of connected components and the number of edges in the social networks when weak and strong ties are removed
Tieness Modified neighborhood overlap
Datasets #cc/#NW ties #cc/#NS ties #cc/#NW ties #cc/#NS ties
Table 9Given two nodesiandj, there are different metrics that can be used to measure the strength of ties
Description Equation Publications
Adamic-Adar coefficient k∈N(i)∩N(j) 1
logN(k), whereN(i)refers to the neighbors of a nodei. [19, 33]
Clustering coefficient (ki(ki2ei−1)), whereeiis the number of edges between all neighbors [4, 33] ofiandkiis the number of neighbors ofi.
Collaboration weight p δ
p iδ
p j np−1, whereδ
p
i is 1 if nodeicollaborates in a workpand 0 [25, 27] otherwise,npis the number of collaborators in a workp, and all
single-collaborated work are excluded.
Frequency or interaction intensity wi,jrepresents the absolute number of interaction betweeniandj. [26]
Neighborhood overlap or Jaccard (|X |Xci∩Xcj|
ci∪Xcj| −(i,jthemselves)), whereXcirepresents the neighbors of [4, 13, 24, 26, 27] Index or Topological Overlap nodei, andXc2the neighbors ofj.
Normalized direct social weight
∀λ∈i,jω(i,j,λ)
∀k∈Ni
∀λ∈i,kω(i,k,λ)
, whereλ∈represents all types of [34]
interactions (e.g., number of co-authored papers or shared projects) betweeniandj.
shared neighbors and small co-authorship frequency of interaction. Therefore, tieness is able to classify as strong ties only pairs of researchers with very high neighborhood overlap and co-authorship frequency.
As future work, we plan to consider temporal aspects and other topological properties as features to a com-putational model to automatically define the strength of co-authorship ties. We also plan to improve the nom-inal scale by considering different properties from the co-authorship social networks. The datasets supporting the analyses of this article are publicly available at http:// www.dcc.ufmg.br/~mirella/projs/apoena/.
Endnotes
1An initial version of this work was published in [3].
It evaluates the metric over only one dataset and dis-cusses its relation to the quality of publication venues; not presented here.
2DBLP: http://dblp.uni-trier.de.
3PubMed: http://www.ncbi.nlm.nih.gov.
4APS: http://www.aps.org.
5Etzkorn, B. “Data normalization and standardization.”
BE BLOG [Online]. Available: http://www.benetzkorn. com/2011/11/data-normalization-and-standardization (2011).
6Clustering coefficient measures the proportion of
nodes’ neighbors that can be reached by other neigh-bors [13], i.e., it also considers the connectivity among neighbors.
Abbreviations
APS: American physical society; cc: Connected components; coAFrequency: Co-authorship frequency; ECDF: Empirical Cumulative Distribution Function; NS ties: Non-strong ties; NO: Neighborhood overlap; NW ties: Non-weak ties; SN: Social network;W: Absolute frequency of interaction
Acknowledgements
The authors thank Matheus A. Diniz for collecting the PubMed dataset and professor Pedro Olmo Vaz de Melo for his suggestions to improve tieness.
Funding
Research partially funded by CAPES, CNPq, and FAPEMIG - Brazil.
Authors’ contributions
The contributions of all authors are summarized as follows. MAB is a Ph.D. candidate in Computer Science who has developed the work as part of her thesis (designed the new metric and its nominal scale, collected the datasets, built the social networks, and conducted the experiments). MMM is a Computer Science Professor who has coordinated and helped funding the whole project as well as participated closely in the design, development, and writing phases. Both authors read and approved the final manuscript.
Competing interests
The authors declare that they have no competing interests.
Received: 31 October 2016 Accepted: 15 February 2017
References
1. Abdi H (2007) The Kendall rank correlation coefficient. Encyclopedia of Measurement and Statistics Sage, Thousand Oaks. doi:10.1.1.66.9039 2. Abdi H, Williams L (2010) Normalizing data. Encyclopedia of Research
Design Sage, Thousand Oaks
3. Brandão MA, Diniz MA, Moro MM (2016) Using topological properties to measure the strength of co-authorship ties. In: Proceedings of the Brazilian Workshop on Social Network Analysis and Mining. SBC, Rio de Janeiro. pp 199–210
4. Brandão MA, Moro MM (2015) Analyzing the strength of co-authorship ties with neighborhood overlap. In: International Conference on Database and Expert Systems Applications. Springer, Linz. pp 527–542 5. Brandão MA, Moro MM, Lopes GR, Oliveira JPM (2013) Using link
semantics to recommend collaborations in academic social networks. In: Proceedings of the 22nd International Conference on World Wide Web -Companion Volume. ACM, Rio de Janeiro. pp 833–840
6. Bruggeman J (2016) The strength of varying tie strength: comment on Aral and Van Alstyne1. Am J Sociol 121(6):1919–1930. doi:10.1086/686267 7. Burt RS (2010) Neighbor networks: competitive advantage local and
personal. Oxford University Press, New York
8. Castilho D, de Melo POV, Benevenuto F (2017) The strength of the work ties. Inf Sci 375:155–170. doi:10.1016/j.ins.2016.09.009
community by social network analysis. In: Proceedings of the Brazilian Workshop on Social Network Analysis and Mining. SBC, Rio de Janeiro 10. Cormen TH, Leiserson CE, Rivest RL, Stein C (2009) Introduction to
algorithms. MIT press, Cambridge
11. Digiampietri L, Maruyama W (2014) Predição de novas coautorias na rede social acadêmica dos programas brasileiros de pós-graduação em ciência da computação. In: Proceedings of the Brazilian Workshop on Social Network Analysis and Mining. SBC, Rio de Janeiro. pp 243–248 12. Ductor L (2015) Does co-authorship lead to higher academic
productivity? Oxford Bull Econ Stat 77(3):385–407
13. Easley D, Kleinberg J (2010) Networks, crowds, and markets: reasoning about a highly connected world. Cambridge University Press, Cambridge 14. Freire VP, Figueiredo DR (2011) Ranking in collaboration networks using a
group based metric. J Braz Comput Soc 41:255–266. doi:10.1007/s13173-011-0041-7
15. Gilbert E, Karahalios K (2009) Predicting tie strength with social media. In: Proceedings of the SIGCHI conference on human factors in computing systems. ACM, Boston. pp 211–220
16. Goulas A, Schaefer A, Margulies DS (2015) The strength of weak connections in the macaque cortico-cortical network. Brain Struct Funct 220(5):2939–2951. doi:10.1007/s00429-014-0836-3
17. Granovetter MS (1973) The strength of weak ties. American Joumal af Sociology, 78: 1360-1380. Dietz. Pugh. and Wiley 91(2004):423–433 18. Jain R (1990) The art of computer systems performance analysis:
techniques for experimental design, measurement, simulation, and modeling. John Wiley and Sons, New York
19. Kahanda I, Neville J (2009) Using transactional information to predict link strength in online social networks. In: Proceedings of 3rd International AAAI Conference on Weblogs and Social Media. AAAI Press, San Jose. pp 74–81
20. Lewis P, McKenzie E (1988) Simulation methodology for statisticians, operations analysts, and engineers, Vol. 1. CRC press, California 21. Lopes GR, Moro MM, da Silva R, Barbosa EM, de Oliveira JPM (2011)
Ranking strategy for graduate programs evaluation. In: Procs. IEEE 7th International Conference on Information Technology and Applications. AAI, Sydney. pp 253–260
22. Luna JEO, Revoredo K, Cozman FG (2013) Link prediction using a probabilistic description logic. J Braz Comput Soc 19(108). doi:10.1007/s13173-013-0108-8
23. McGee J, Caverlee JA, Cheng Z (2011) A geographic study of tie strength in social media. In: Proceedings of the 20th ACM Int’l Conf. on Information and Knowledge Management. ACM, Glasgow. pp 2333–2336
24. de Melo POV, Viana AC, Fiore M, Jaffrès-Runser K, Le Mouël F, Loureiro AA, Addepalli L, Guangshuo C (2015) Recast: telling apart social and random relationships in dynamic networks. Perform Eval 87:19–36.
doi:10.1016/j.peva.2015.01.005
25. Newman ME (2001) Scientific collaboration networks. ii. shortest paths, weighted networks, and centrality. Phys Rev E 64(1):016,132. doi:10.1103/PhysRevE.64.016132
26. Onnela JP, Saramäki J, Hyvönen J, Szabó G, Lazer D, Kaski K, Kertész J, Barabási AL (2007) Structure and tie strengths in mobile communication networks. Proc Natl Acad Sci 104(18):7332–7336.
doi:10.1073/pnas.0610245104
27. Pan RK, Saramäki J (2012) The strength of strong ties in scientific collaboration networks. EPL (Europhysics Letters) 97(1):18,007. doi:10.1209/0295-5075
28. Pappalardo L, Rossetti G, Pedreschi D (2012) “How well do we know each other?” detecting tie strength in multidimensional social networks. In: Proceedings of the IEEE/ACM International Conference on Advances in Social Networks Analysis and Mining. IEEE, Istanbul. pp 1040–1045 29. Silva TH, Moro MM, Silva APC, Meira Jr W, Laender AH (2014)
Community-based endogamy as an influence indicator. In: Proceedings of the 14th ACM/IEEE-CS Joint Conference on Digital Libraries. ACM, London. pp 67–76
30. Viana W, da Silva APC, Moro MM (2016) Pick the right team and make a blockbuster: a social analysis through movie history. In: Proceedings of the 31st Annual ACM Symposium on Applied Computing. ACM, Pisa. pp 1108–1114. doi:10.1145/2851613.2851812
31. Wiese J, Min JK, Hong JI, Zimmerman J (2015) You never call, you never write: call and SMS logs do not always indicate tie strength. In:
Proceedings of the 18th ACM Conference on Computer Supported Cooperative Work & Social Computing. ACM, Vancouver. pp 765–774 32. Yan R, Huang C, Tang J, Zhang Y, Li X (2012) To better stand on the
shoulder of giants. In: Proceedings of the 12th ACM/IEEE-CS Joint Conference on Digital Libraries. ACM, Washington, DC. pp 51–60 33. Zignani M, Gaito S, Rossi GP (2016) Predicting the link strength of
newborn links. In: Proceedings of the 25th International Conference on World Wide Web - Companion Volume. ACM, Montreal. pp 147–148 34. Zuo X, Blackburn J, Kourtellis N, Skvoretz J, Iamnitchi A (2016) The power
of indirect ties. Comput Commun 73:188–199. doi:10.1016/j.comcom.2015.07.013
Submit your manuscript to a
journal and benefi t from:
7Convenient online submission 7Rigorous peer review
7Immediate publication on acceptance 7Open access: articles freely available online 7High visibility within the fi eld
7Retaining the copyright to your article