Improved sqrt‑cosine similarity
measurement
Sahar Sohangir
*and Dingding Wang
Introduction
In the past decade, there has been explosive growth in the volume of text documents flowing over the internet. This has brought about a need for efficient and effective meth-ods of automated document understanding, which aims to deliver desired information to users. Document similarity is a practical and widely used approach to address the issues encountered when machines process natural language. Some examples of docu-ment similarity are docudocu-ment clustering, docudocu-ment categorization, docudocu-ment summari-zation, and query-based search.
Similarity measurement usually uses a bag of words model [1]. This model views a doc-ument as a collection of words and disregards grammar and word order. For example, consider that we want to compute a similarity score between two documents, t and d. One common method for similarity measurement is to first assign a weight to each term in the document by using the number of times the term occurs, then invert the num-ber of occurrences of the term in all documents (tfidft,d) [2, 3], and finally calculate the
similarity based on the weighting results using a vector space model [4]. In a vector space scoring model, each document is viewed as a vector and each term in the document cor-responds to a component in vector space. Another popular and commonly-used similar-ity measure is cosine similarity. This can be derived directly from Euclidean distance,
Abstract
Text similarity measurement aims to find the commonality existing among text docu-ments, which is fundamental to most information extraction, information retrieval, and text mining problems. Cosine similarity based on Euclidean distance is currently one of the most widely used similarity measurements. However, Euclidean distance is generally not an effective metric for dealing with probabilities, which are often used in text analytics. In this paper, we propose a new similarity measure based on sqrt-cosine similarity. We apply the proposed improved sqrt-sqrt-cosine similarity to a variety of document-understanding tasks, such as text classification, clustering, and query search. Comprehensive experiments are then conducted to evaluate our new similarity meas-urement in comparison to existing methods. These experimental results show that our proposed method is indeed effective.
Keywords: Similarity measure, Information retrieval, Hellinger distance
Open Access
© The Author(s) 2017. This article is distributed under the terms of the Creative Commons Attribution 4.0 International License (http://creativecommons.org/licenses/by/4.0/), which permits unrestricted use, distribution, and reproduction in any medium, provided you give appropriate credit to the original author(s) and the source, provide a link to the Creative Commons license, and indicate if changes were made.
RESEARCH
however, Euclidean distance is generally not a desirable metric for high-dimensional data mining applications.
In this paper, we propose a new similarity measurement based on Hellinger distance. Hellinger distance (L1 norm) is considerably more desirable than Euclidean distance (L2 norm) as a metric for high-dimensional data mining applications [5]. We conduct com-prehensive experiments to compare our newly proposed similarity measurement with the most widely used cosine and Gaussian model-based similarity measurements in vari-ous document understanding tasks, including document classification, document clus-tering, and query search.
Related work
Block distance, which is also known as Manhattan distance, computes the distance that would be traveled to get from one data point to the other if a grid-like path is followed. The Block distance between two items is the sum of the differences of their correspond-ing components [6]. Euclidean distance, or L2 distance, is the square root of the sum of squared differences between corresponding elements of the two vectors. Matching coefficient is a very simple vector based approach which simply counts the number of similar terms (dimensions), with which both vectors are non-zero. Overlap coefficient considers two strings as a full match if one is a subset of the other [7]. Gaussian model is a probabilistic model which can be used to characterize a group of feature vectors of any number of dimensions with two values, a mean vector, and a covariance matrix. The Gaussian model is one way of calculating the conditional probability [8]. Traditional spectral clustering algorithms typically use a Gaussian kernel function as a similarity measure. Kullback–Leibler divergences [9] is another measure for computing the simi-larity between two vectors. It is a non-symmetric measure of the difference between the probability distribution correspond with the two vectors [10]. The Canberra distance metric [11] is always used in a non-negative vector. Chebyshev distance is defined on a vector space where the distance between two vectors is the greatest of difference along any coordinate dimension [12]. Triangle distance is considered as the cosine of a triangle between two vectors and its value range between 0 and 2 [13]. The Bray–Curtis similar-ity measure [14] which is sensitive to outlying values is a city-block metric. The Ham-ming distance [15, 16] is the number of positions at which the associated symbols are different. IT-Sim (information-theoretic measure) for document similarity, proposed in [17, 18]. The Suffix Tree Document (STD) model [19] is a phrase-based measure.
proposed in [29] takes into account similarity of features. They add to the Vector Space Model new features by calculation of similarity of each pair of the already existing fea-tures. Pairwise-adaptive similarity dynamically select number of features prior to every similarity measurement. Based on this method a relevant subset of terms is selected that will contribute to the measured distance between both related vectors [30].
Cosine similarity
Similarity measurement is a major computational burden in document understanding tasks and cosine similarity is one of the most popular text similarity measures. Manning and Raghavan provide an example in [2] which clearly demonstrates the functionality of cosine similarity. In this example, four terms (affection, jealous, gossip, and wuther-ing) from the novels Sense and Sensibility (SaS) and Pride and Prejudice (PaP) from Jane Austen and Wuthering Heights (WH) from Emily Bronte are extracted. For the sake of simplicity we ignore idf and use Eq. 1 to calculate log frequency weight of term t in novel d.
In Tables 1 and 2, the number of occurrences and log frequency weight of these terms in each of the novels are provided, respectively. Table 3 then shows the cosine similarity between these novels. Cosine similarity returns one when two documents are practically identical, or zero when the documents are completely dissimilar.
(1) wt,d=
1+log10tft,d if tft,d >0
0 otherwise
Table 1 Term frequencies of terms in each of the novels
Term SaS PaP WH
Affection 115 58 20
Jealous 10 7 11
Gossip 2 0 6
Wuthering 0 0 38
Table 2 Log frequency weight of terms in each of the novels
Term SaS PaP WH
Affection 3.06 2.76 2.30
Jealous 2.00 1.85 2.04
Gossip 1.30 0 1.78
Wuthering 0 0 2.58
Table 3 Cosine similarity between novels
SaS PaP WH
SaS 1.00 0.94 0.79
PaP 0.94 1.00 0.69
In order to find cosine similarity between two documents x and y we need to normal-ize them to one in L2 norm (2).
By having two normalized vectors x and y the cosine similarity between them will be simply the dot product of them (Eq. 3).
Careful examination of Eq. 3 shows that cosine similarity is directly derived from Euclid-ean distance (Eq. 4).
Sqrt‑cosine similarity
Zhu et al. in [31] attempted to use the advantages of Hellinger distance Eq. (6) and pro-posed a new similarity measurement—sqrt-cosine similarity. They claim that as a simi-larity measurement, it provides a value between zero and one, which is better assessed with probability-based approaches. However, Euclidean distance is not a good metric to deal with probability. The sqrt-cosine similarity defined in Eq. (5) is based on Hellinger distance Eq. (6).
In some cases, the manner of sqrt-cosine similarity is in conflict with the definition of similarity measurement. To clarify our claim, we use the same example provided in "Cosine similarity". Sqrt-cosine similarity is calculated between these three novels and shown in Table 4. Surprisingly, the sqrt-cosine similarity between two equal novels does (2) m
i=1 xi2=1
(3)
cos(x,y)=
m
i=1xiyi
m
i=1xi2
m
i=1y2i .
(4)
dEuclid(x,y)=
i
(xi−yi)2
12
=
2−2
i
xiyi
12
(5)
SqrtCos(x,y)=
m
i=1√xiyi
m
i=1xi
m
i=1yi
.
(6) H(x,y)=
m
i √
xi−√yi2
1 2
=
2−2 m
i √
xiyi 12
,
Table 4 Sqrt-cosine similarity scores among novels
SaS PaP WH
SaS 0.15 0.16 0.11
PaP 0.16 0.21 0.11
not equal one, exposing flaws in this design. Furthermore, from on Table 4, we can see that the SaS (Sense and Sensibility) novel is more similar to PaP (Pride and Prejudice) than itself! comparing Tables 3 and 4 reveals that, opposed to cosine similarity, we can-not specify the sqrt-cos similarity of WH (Wuthering Heights) to other novels within two decimal places of accuracy. Based on the above example we believe that sqrt-cosine similarity is not a trustable similarity measurement. To address this problem, we pro-pose an improved similarity measurement based on sqrt-cosine similarity and compare it with other common similarity measurements.
The proposed ISC similarity
Information retrieved from high-dimensional data is very common, but this space becomes a problem when working with Euclidean distances. In higher dimensions, this can rarely be considered an effective distance measurement in machine learning.
Charu, in [5], prove that the Euclidean (L2) norm, from a theoretical and empirical view, is often not a desirable metric for high-dimensional data mining applications. For a wide variety of distance functions, because of the concentration of distance in high-dimensional spaces, the ratio of the distances of the nearest and farthest neighbors to a given target is almost one. As a result, there is no variation between the distances of different data points. Also in [5], Charu investigates the behavior of the Lk norm in
high-dimensional space. Based on these results, for a given value of the high-high-dimensionality d, it may be preferable to use a lower value of k. In other words, for a high-dimensional application, L1 distance, like Hellinger, is more favorable than L2 (Euclidean distance).
We propose our improved sqrt-cosine (ISC) similarity measurement below.
In Eq. 5, each document is normalized to 1 in L1 norm: mi=1xi=1. We propose the ISC similarity measurement in Eq. 7. In this equation, instead of using L1 norm, we use the
square root of L1 norm.
The same example is used in "Cosine similarity" to compare our ISC similarity with the previous one. The results from using ISC similarity between these three novels are available in Table 5. The similarity between two identical novels is one and we can clearly find a similar novel to WH (Wuthering Heights) within two decimal place of accuracy.
Cosine similarity is considered as the “state of the art” in similarity measurement. ISC is very close to cosine similarity in term of implementation complexity in major engines such as Spark [32] or any improved big data architecture [33, 34]. We con-duct comprehensive experiments to compare ISC similarity with cosine similarity and Gaussian model-based similarity in various application domains, including doc-ument classification, docdoc-ument clustering, and information retrieval query. In this study, we used several popular learning algorithms and applied them to multiple data sets. We also use various evaluation metrics in order to validate and compare our results.
(7)
ISC(x,y)=
m
i=1√xiyi
m i=1xi
m i=1yi
Experiments
Data sets
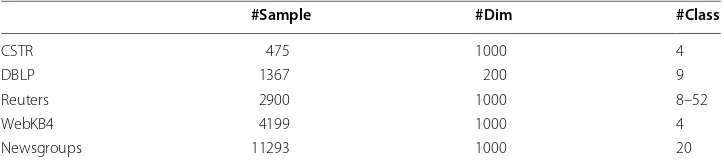
Five different data sets from different application domains were used in this experiment. In Table 6, a list of these sets is presented. Our reason for selecting these data sets is that they are commonly used and considered a benchmark for document classification and clustering. In the following table, more information about all the data sets used in our experiments can be found.
1. The CSTR is a collection of about 550 abstracts of technical reports published from 1991 to 2007 in computer science journals at the University of Rochester. They can be classified into four different groups: Natural Language Processing (NLP), Robot-ics/vision, Systems, and Theory.
2. The DBLP data set contains the titles of the last 20 years’ papers, published by 552 active researchers, from nine different research areas: database, data mining, soft-ware engineering, computer theory, computer vision, operating systems, machine learning, networking, and natural language processing.
3. Reuters-21578 is a collection of documents that appeared on the Reuters newswire in
1987. R8 and R52 are subsets of the Reuters-21578 Text Categorization. Reuters Ltd personnel collected this document set and labeled the contents.
4. The WebKB data set contains 8280 documents which are web pages from various col-lege computer science departments. These documents are divided into seven groups: student, faculty, staff, course, project, department, and other. The four most popular categories from these seven categories are selected and made into the WebKB4 set. These four categories are student, faculty, course and project [36].
5. The 20 Newsgroups data set is a collection of about 20 different newsgroups [37]. Containing around 20,000 newsgroup documents, this is one of the most commonly-used data sets in text processing.
Learners
We apply various classification and clustering methods to analyze the performance of our new similarity measurement. We used Nearest Neighbour [38], Naïve Bayes [39] Table 5 The proposed ISC similarity scores among novels
SaS PaP WH
SaS 1.00 0.89 0.83
PaP 0.89 1.00 0.70
WH 0.83 0.70 1.00
Table 6 Summary of the real-world data sets [35]
#Sample #Dim #Class
CSTR 475 1000 4
DBLP 1367 200 9
Reuters 2900 1000 8–52
WebKB4 4199 1000 4
and Support Vector Machine [40] which are most common classification models. As the clustering models we used K-Means [41], Normalized Cut Algorithm [42], K-means Clustering via Principal Component Analysis [43]. We implemented discussing learners in R language [44].
Performance metrics
In the experiments, we use five different performance metrics to compare the models we constructed based on our ISC similarity with other similarity measures. The evaluation metrics include the following.
Area under the ROC Curve [45], accuracy for classification [46], accuracy for cluster-ing [47], purity [2], and normalized mutual information [48].
In addition to these performance metrics, we test the results for statistical significance at the α=5% level using a one-factor analysis of variance (ANOVA) [49]. An ANOVA model can be used to test the hypothesis that classification performances for each level of the main factor(s) are equal versus the alternative hypothesis that at least one is dif-ferent. In this paper, we use a one-factor ANOVA model, which can be represented as:
where ψjn represents the response (i.e., AUC, ACC, Purity, NMI) for the nth observation of the jth level of experimental factor θ; µ represents overall mean performance; θj is the mean performance of level j for factor θ; and ǫjn is random error.
In our experiment, θ is the similarity measure and we aim to compare the average performance of the newly proposed similarity measurement with cosine similarity and Gaussian-based similarity measurement. If at least one level of θ is different, there are lots of procedures exist that can be used to specify which levels of θ is different. In this paper, we use Tukey’s Honestly Significant Difference (HSD) test [50] to identify which levels of θ are significantly different.
Experimental results
In this section, we provide the results of our experiments and compare our ISC similar-ity with cosine similarsimilar-ity and Gaussian base similarsimilar-ity. As a first step, we just focus on the performance metrics across all five data sets and seven different learners (three clas-sifications and four clustering models). As a second step, we consider different learners separately to compare the performance of these similarity measurements for different learners. At the end, the combinations of learners and data sets considered seeing their effectiveness.
Overall results
First, we compare the average performance of our proposed ISC similarity measurement with cosine similarity and Gaussian-based similarity measurement. Results are provided in Tables 7 and 8. Mean columns represent the average of performance metrics across all learners (clustering and classification) and data sets. According to the mean values in Tables 7 and 8, ISC similarity in all cases outperforms cosine similarity and Gaussian-based similarity measurement.
Columns labeled HSD represent results of Tukey’s Honestly Significant Difference test at the 95% confidence level. If two similarity measurements have the same letter in the HSD column, then according to HSD test their average performances are both good. For example, based on Table 7, using area under the ROC curve (AUC) or accuracy as a performance measure of each classifier indicates that ISC and cosine similarity are in the same group so their performance are not significantly different from each other. On Table 8 Gaussian-based similarity belongs to group B which means ISC and cosine simi-larity outperform Gaussian-based simisimi-larity. Generally speaking, based on the HSD test, when averaging performance across all data sets and learners, the proposed ISC similar-ity, and cosine similarity belong to the same group.
In addition, we use box plots to see outliers and spread the performance of classifi-cation and clustering across all data sets and learners for these three similarity meas-urements. In this way, we can compare their performance at various points in the distribution, not only the mean value as we did in Tables 7 and 8. For example, based on Figs. 1 and 2, the distribution of the accuracy and purity for ISC similarity is more favorable than those of cosine similarity and Gaussian.
Results using different learners
As a second step, we try to compare the effectiveness of different learners on the per-formance of our ISC similarity, cosine similarity, and Gaussian-based similarity meas-urement. Tables 9 and 10 show the average performance of discussing similarity measurements by applying different classification and clustering methods. We used K-Nearest Neighbor, Naïve Bayes, and SVM as our classification models. K-Means, Normalized cut, K-Mean clustering via Principal Component Analysis and Symmetric Nonnegative Matrix Factorization (SymNMF) are our applying clustering methods. We summarized our observations as below:
Table 7 Average performances of the similarity measure across all clustering learners and data sets
Similarity Accuracy Purity NMI
Mean HSD Mean HSD Mean HSD
ISC 0.3563 A 0.5950 A 0.1590 A
Cosine 0.3370 A 0.5608 A 0.1363 A
Gaussian 0.2949 A 0.5597 A 0.0990 A
Table 8 Average performance of the similarity measure across all classification learners and data sets
Similarity Accuracy AUC
Mean HSD Mean HSD
ISC 0.6562 A 0.7901 A
Cosine 0.6371 A 0.7780 A
1. With naïve Bays as the base learner and using accuracy and area under the ROC Curve (AUC) to measure performance, ISC similarity and cosine similarity are pre-ferred over Gaussian base similarity measurement.
2. Based on mean values, ISC similarity is preferred over cosine similarity and Gauss-ian-based similarity measurement.
3. Based on the HSD test, both ISC similarity and cosine similarity are belong to group ’A’ which is the top grade ranges.
Fig. 1 Accuracy in classification box plot
Fig. 2 Purity in clustering box plot
Table 9 Performances of the similarity measures using classification learners averaged across all data sets
Metric Similarity KNN Naïve Bays SVM
Mean HSD Mean HSD Mean HSD
Accuracy ISC 0.7079 A 0.8589 A 0.4019 A
Cosine 0.6476 A 0.8633 A 0.4004 A
Gaussian 0.4606 A 0.1795 B 0.2215 A
AUC ISC 0.8779 A 0.8806 A 0.612 A
Cosine 0.7977 AB 0.8892 A 0.6473 A
Results using different data sets and learners
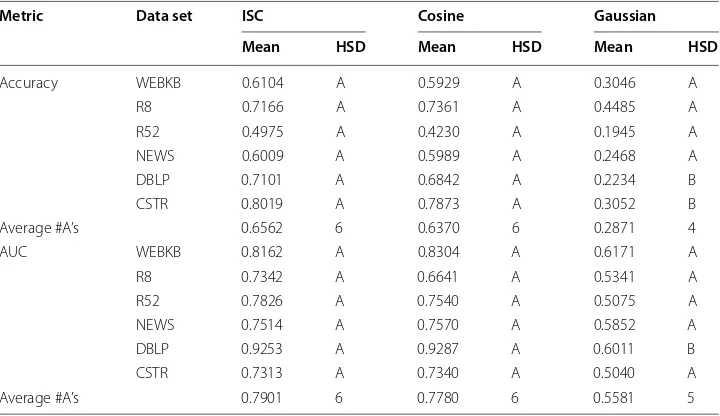
In this section, we try to investigate the effectiveness of different data sets in various domains on the performance of discussing similarity measurement. We consider six different data sets from different application domains including Webkb, Reuters8, Reuters52, News, dblp and cstr data sets. Table 11 shows the results of evaluating all classification methods and Table 12 presents the results of clustering methods. We use various performance evaluations for both classification and clustering. For each per-formance metric, we specify a row which represents the number of data sets where the given technique is in group A and also the average performance across all six data sets. Based on Tables 11 and 12 regardless of learners and data sets, ISC similarity and cosine similarity measures are always in group A. On the other hand, the Gaussian-based similarity measurement is in group B for some data sets while we use classifica-tion learners.
Table 10 Performances of the similarity measures using clustering learners averaged across all data sets
Metric Similarity Kmeans Ncut PCA‑Kmean SYM‑NMF
Mean HSD Mean HSD Mean HSD Mean HSD
Accuracy ISC 0.3354 A 0.3220 A 0.3090 A 0.4589 A
Cosine 0.3115 A 0.3104 A 0.3070 A 0.4191 A
Gaussian 0.3005 A 0.3020 A 0.3020 A 0.2750 A
Purity ISC 0.4357 A 0.5606 A 0.8499 A 0.5337 A
Cosine 0.4217 A 0.5626 A 0.7771 A 0.5072 A
Gaussian 0.3919 A 0.5693 A 0.8457 A 0.4066 A
NMI ISC 0.1740 A 0.1367 A 0.0369 A 0.2886 A
Cosine 0.1332 A 0.1321 A 0.0335 A 0.2464 A
Gaussian 0.0992 A 0.1337 A 0.0309 A 0.1321 A
Table 11 Performance of the similarity measures in data sets averaged across all classifica-tion learners
Metric Data set ISC Cosine Gaussian
Mean HSD Mean HSD Mean HSD
Accuracy WEBKB 0.6104 A 0.5929 A 0.3046 A
R8 0.7166 A 0.7361 A 0.4485 A
R52 0.4975 A 0.4230 A 0.1945 A
NEWS 0.6009 A 0.5989 A 0.2468 A
DBLP 0.7101 A 0.6842 A 0.2234 B
CSTR 0.8019 A 0.7873 A 0.3052 B
Average #A’s 0.6562 6 0.6370 6 0.2871 4
AUC WEBKB 0.8162 A 0.8304 A 0.6171 A
R8 0.7342 A 0.6641 A 0.5341 A
R52 0.7826 A 0.7540 A 0.5075 A
NEWS 0.7514 A 0.7570 A 0.5852 A
DBLP 0.9253 A 0.9287 A 0.6011 B
CSTR 0.7313 A 0.7340 A 0.5040 A
According to the average performance across all data sets in these Tables, regardless of learners, data sets or even quality measurement, ISC similarity always outperforms Gaussian-based and also cosine similarity measure.
Conclusion
Finding an effective and efficient way to calculate text similarity is a critical problem in text mining and information retrieval. One of the most popular similarity measures is cosine similarity, which is based on Euclidean distance. It has been shown useful in many applications, however, cosine similarity is not ideal. Euclidean distance is based on L2 norm and does not work well with high-dimensional data. In this paper, we pro-posed a new similarity measurement technique, called improved sqrt-cosine (ISC) simi-larity, which is based on Hellinger distance. Hellinger distance is based on L1 norm and it is proven that in high-dimensional data, L1 norm works better than L2 norm. Most applications consider cosine similarity “state of the art” in similarity measurement. We compare the performance of ISC with cosine similarity, and other popular techniques for measuring text similarities, in various document understanding tasks. Through com-prehensive experiments, we observe that although ISC is very close to cosine similar-ity in term of implementation, it performs favorably when compared to other similarsimilar-ity measures in high-dimensional data.
Authors’ contributions
DW brought up the idea of new similarity based on Hellingerdistance when work on the problem of cosine similarity in high-dimensional data. She found that Hellinger distance is a good choice to replace Euclidean distance in cosine Table 12 Performance of the similarity measures in data sets averaged across all cluster-ing learners
Metric Data set ISC Cosine Gaussian
Mean HSD Mean HSD Mean HSD
Accuracy WEBKB 0.4798 A 0.4434 A 0.3824 A
R8 0.4384 A 0.4291 A 0.4472 A
R52 0.2320 A 0.2283 A 0.2395 A
NEWS 0.1659 A 0.1544 A 0.1179 A
DBLP 0.3886 A 0.3574 A 0.2640 A
CSTR 0.4332 A 0.4095 A 0.3182 A
Average #A’s 0.3563 6 0.3370 6 0.2948 6
Purity WEBKB 0.6248 A 0.6091 A 0.5548 A
R8 0.5769 A 0.5790 A 0.6446 A
R52 0.4440 A 0.4225 A 0.4478 A
NEWS 0.4234 A 0.4410 A 0.3948 A
DBLP 0.7980 A 0.6363 A 0.6531 A
CSTR 0.7026 A 0.6704 A 0.6700 A
Average #A’s 0.59495 6 0.55971 6 0.56085 6
NMI WEBKB 0.1500 A 0.1177 A 0.0879 A
R8 0.1978 A 0.1912 A 0.2030 A
R52 0.1376 A 0.1321 A 0.1179 A
NEWS 0.0855 A 0.0761 A 0.0731 A
DBLP 0.2439 A 0.1940 A 0.0948 A
CSTR 0.1396 A 0.1069 A 0.0172 A
similarity. Sahar Sohangir prposed improved sqrt-cosine similarity. She did a comprehensive study to compare this new similarity measurement with other popular similarity measurements. Both authors read and approved the final manuscript.
Acknowledgements Not applicable. Competing interests
The authors declare that they have no competing interests.
Publisher’s Note
Springer Nature remains neutral with regard to jurisdictional claims in published maps and institutional affiliations.
Received: 2 May 2017 Accepted: 29 June 2017
References
1. Potts C. From frequency to meaning: vector space models of semantics. J Artif Intell Res. 2010;37:141–88. 2. Manning CD, Raghavan P, Schutze H. Introduction to information retrieval. New York: Cambridge; 2008. p. 279–88. 3. Tiwari P, Mishra BK, Kumar S, Kumar V. Implementation of n-gram methodology for rotten tomatoes review dataset
sentiment analysis. Int J Knowl Discov Bioinform. 2017;7(1):30–41.
4. Dubin D. The most influential paper gerard salton never wrote. Libr Trends. 2004;52(4):748–64.
5. Aggarwal CC, Hinneburg A, Keim DA. On the surprising behavior of distance metrics in high dimensional space. In: international conference on database theory. Springer; 2001. p. 420–34.
6. Krause EF. Taxicab geometry: an adventure in non-euclidean geometry. New York: Dover Publications; 1987. 7. Gomaa WH, Fahmy AA. A survey of text similarity approaches. Int J Comput Appl. 2013;68(13):0975–8887. 8. Rue H, Martino S, Chopin N. Approximate Bayesian inference for latent Gaussian models by using integrated nested
Laplace approximations. J R Stat Soc Series B Stat Methodol. 2009;71(2):319–92. 9. Kullback S, Leibler RA. On information and sufficiency. Ann. Math. Statist. 1951;22(1):70–86.
10. Cha SH. Comprehensive survey on distance/similarity measures between probability density functions. Int. J. Math. Models Methods Appl. Sci. 2007;1(4):300–7.
11. Schoenharl TW, Madey G. Evaluation of measurement techniques for the validation of agent-based simulations against streaming data. In: Bubak M, van Albada GD, Dongarra J, Sloot PMA, editors. Computational science—ICCS 2008. ICCS 2008. Lecture notes in computer science, vol. 5103. Berlin, Heidelberg: Springer; 1998.
12. Kumar S, Toshniwal D. Analysis of hourly road accident counts using hierarchical clustering and cophenetic correla-tion coefficient. J Big Data. 2016;3(1):1–11.
13. Kumar S, Toshniwal D. A novel framework to analyze raod accident time series data. J Big Data. 2016;3(1):8. 14. Michie MG. Use of the bray-curtis similarity measure in cluster analysis of foraminiferal data. Math Geol.
1982;14(6):661–7.
15. Gonzalez CG, Bonventil W, Rodrigues AV. Density of closed balls in real-valued and autometrized boolean spaces for clustering applications. In: Brazilian symposium artificial intelligence. 2008. p. 8–22.
16. Hamming RW. Error detecting and error correcting codes. Bell Syst Tech. 1950;29(2):147–60.
17. Aslam JA, Frost M. An information-theoretic measure for document similarity. In: Proceedings of the 26th annual international ACM SIGIR conference on research and development in informaion retrieval. 2003. p. 449–50. 18. Lin D. An information-theoretic definition of similarity. In: Shavlik JW, editor. Proceedings of the fifteenth
interna-tional conference on machine learning. San Francisco, CA, USA: Morgan Kaufmann Publishers Inc.; 1998. p. 296–304. 19. Chim H, Deng X. Efficient phrase-based document similarity for clustering. IEEE Trans Knowl Data Eng.
2008;20(9):1217–29.
20. Duda RO, Hart PE, Stork DG. Pattern classification. Hoboken: John Wiley & Sons; 2012.
21. Kumar BVKV, Hassebrook L. Performance measures for correlation filters. Appl Optics. 1990;29:2997–3006. 22. Tanimoto TT. IBM internal Report; 1957.
23. Jaccard P. Distribution of the alpine flora in the dranses basin and some neighbouring regions. Bull Soc vaudoise Sci Nat. 1901;37:241–72.
24. Dice LR. Measures of the amount of ecologic association between species, ecology. Appl Optics. 1945;26:297–302. 25. Monev V. Introduction to similarity searching in chemistry. MATCH Commun. Math. Comput. Chem. 2004;51:7–38. 26. Morisita M. Measuring of interspecific association and similarity between communities. Series E Biol. 1959;3:65–80. 27. Dice L. Measures of the amount of ecologic association between species. Ecology. 1945;26(3):297–302.
28. Deza M-M, Deza E. Dictionary of distance. Amsterdam: Elsevier; 2006.
29. Sidorov G, Gelbukh A, Gomez-Adorno H, Pinto D. Soft similarity and soft cosine measure:similarity of features in vec-tor space model. Computacion y Sistemas. 2014;18(3):491–504.
30. Dhondt J, Vertommen J, Vertommen PA, Cattrysse D, Duflou JR. Pairwise-adaptive dissimilarity measure for docu-ment clustering. Inf Sci. 2010;180(12):2341–58.
31. Zhu S, Liu L, Wang Y. Information retrieval using hellinger distance and sqrt-cos similarity. In: International Confer-ence on computer sciConfer-ence and education (ICCSE 2012); 2012. p. 14–17.
33. Wellings AJ, Gray I, Fernndez Garca N, Basanta-Val P, Audsley NC. Architecting time-critical big-data systems. IEEE Trans Big Data. 2016;2(4):310–24.
34. Wellings AJ, Audsley NC, Basanta-Val P, Fernndez Garca N. Improving the predictability of distributed stream proces-sors. Commun ACM. 2015;52:22–36.
35. Wang D, Sohangir S, Li T. Update summarization using semi-supervised learning based on hellinger distance. In: Proceedings of the 24th ACM international on conference on information and knowledge management. 2015. p. 1907–10.
36. Han S, Boley D, Gini M, Gross R, Hastings K, Karypis G, Kumar V, Mobasher B, Moore J. Webace: a web agent for document categorization and exploration. In: proceedings of the second international conference on autonomous agents; 1998. p. 408–15.
37. Cardoso-Cachopo A. Improving methods for single-label text categorization. PdD Thesis, Instituto Superior Tecnico, Universidade Tecnica de Lisboa; 2007.
38. Beyer K, Goldstein J, Ramakrishnan R, Shaft U. When Is “Nearest Neighbor” Meaningful?. In: Beeri C, Buneman P. editors. Database Theory—ICDT’99. ICDT 1999. Lecture notes in computer science, vol. 1540. Berlin, Heidelberg: Springer; 1999. p. 217–35.
39. Mitchell TM. Machine Learning. Boston, MA: McGraw-Hill; 1997.
40. Steinwart I, Christmann A. Support vector machine. New York: Springer; 2008.
41. Macqueen J. Some methods forclassification and analysis of multivariate observations. In: Berkeley Symposium on mathematical statistics and probability; 2009. p. 281–97.
42. Shi J, Malik J. Self inducing relational distance and its application to image segmentation. In: proceedings of the 5th European conference on computer vision (ECCV’98); 1998. p. 528–43.
43. Napoleon D, Pavalakodi S. A new method for dimensionality reduction using k-means clustering algorithm for high dimensional data set. Int J Comput Appl. 2011;13(7):41–6.
44. Torgo L. Data mining with R. Boca Raton: CRC Press; 2011.
45. Hastie T, Tibshirani R, Friedman J. The elements of statistical learning. New York: Springer; 2009. 46. Olson DL, Delen D. Advanced data mining techniques. New York: Springer; 2008.
47. Wang D, Li T, Ding C. Weighted feature subset non-negative matrix factorization and its applications to document understanding. In: IEEE international conference on data mining; 2010.
48. Wang D, Zhu S, Li T. Integrating document clustering and multidocument summarization. ACM Trans Knowl Discov Data. 2011;5(3):14.
49. Berenson ML, Levine DM, Goldstein M. Intermediate statistical methods and applications: a computer package approach. New Jersey: Prentice-Hall; 1983.