Open Access
Research
A methodological report from the Malmö Diet and Cancer study:
development and evaluation of altered routines in dietary data
processing
Elisabet Wirfält*
1
, Irene Mattisson
1
, Ulla Johansson
1
, Bo Gullberg
2
,
Peter Wallström
1
and Göran Berglund
1
Address: 1Department of medicine, surgery and orthopaedics, Lund University, University hospital in Malmö, SE-205 02 Malmö, Sweden and 2Department of community medicine, Lund University, University hospital in Malmö, SE-205 02 Malmö, Sweden
Email: Elisabet Wirfält* - [email protected]; Irene Mattisson - [email protected];
Ulla Johansson - [email protected]; Bo Gullberg - [email protected]; Peter Wallström - [email protected]; Göran Berglund - [email protected]
* Corresponding author
Abstract
Background: In the Malmö Diet and Cancer study, information on dietary habits was obtained through a modified diet history method, combining a 7-day menu book for cooked meals and a diet questionnaire for foods with low day-to-day variation. Half way through the baseline data collection, a change of interview routines was implemented in order to reduce interview time.
Methods: Changes concentrated on portion-size estimation and recipe coding of mixed dishes reported in the menu book. All method development and tests were carefully monitored, based on experiential knowledge, and supplemented with empirical data. A post hoc evaluation study using "real world" data compared observed means of selected dietary variables before and after the alteration of routines handling dietary data, controlling for potential confounders.
Results: These tests suggested that simplified coding rules and standard portion-sizes could be used on a limited number of foods, without distortions of the group mean nutrient intakes, or the participants' ranking. The post hoc evaluation suggested that mean intakes of energy-adjusted fat were higher after the change in routines. The impact appeared greater in women than in men.
Conclusions: Future descriptive studies should consider selecting subsets assessed with either method version to avoid distortion of observed mean intakes. The impact in analytical studies may be small, because method version and diet assistant explained less than 1 percent of total variation. The distribution of cases and non-cases across method versions should be monitored.
Background
Diet history methods are interviewer administered quan-titative diet methods which typically use cross-check fre-quency lists to estimate usual food consumption frequencies, and photographic aids, food models or household measuring devices to estimate usual
portion-sizes [1,2]. The assessment methodology is relatively time consuming, and the period of participant accrual will in-evitably be long in large-scale studies [2,3]. Therefore, var-iations in interview routines or in changes of dietary data collection procedures over time, could potentially affect observed nutrient intakes. Studies of "usual diet" methods
Published: 19 November 2002
Nutrition Journal 2002, 1:3
Received: 16 September 2002 Accepted: 19 November 2002
This article is available from: http://www.nutritionj.com/content/1/1/3
have indicated that different portion-size alternatives mainly influence the estimated group mean intakes of en-ergy and nutrients, but have smaller effect on the ability to rank individuals on specific nutrient intakes [4–6]. Differ-ential reports may depend on personal characteristics of study participants like obesity [7–11], socio-economic status [12], education and ethnicity [13], or gender [14]. However, food selection is also known to vary by season [3], and general food consumption trends over long time-periods are observed in most populations [15–17].
In the Malmö Diet and Cancer (MDC) study, a prospec-tive cohort study in the third largest city of Sweden [18], food habit information was obtained through a modified diet history method [12,19,20]. During the six-year base-line examination period, a total of seventeen interviewers conducted the dietary interviews. Several measures were taken to facilitate standardized dietary data collection pro-cedures: a continuous in-service training of interviewers; a computer software for standardized entering and coding of data; an extensive set of coding rules for food items and mixed dishes; and a quality control program of collected data. In the spring of 1993 an unforeseen reduction of grants initiated measures to simplify dietary data collec-tion routines and to make faster interviews possible. The change in routines was preceded by a phase evaluating possible options for simplifying the procedures, and a se-ries of tests to examine the effect of different coding and portion-size alternatives on dietary intakes. Because the total and "real world" effect of the altered routines could not be evaluated prior to change, a separate evaluation project was called for. It is, for instance, plausible that, when implemented in full the altered routines would af-fect dietary interviewers and study-participants, and sub-sequently, observed intakes in unpredicted ways. Observed intakes at different points in time, could also depend on factors like characteristics and lifestyle of study-participants, or on the year and season of data col-lection rather than on the handling of data.
This paper therefore presents two separate studies. Study I describes the method development procedures before routine change. First, the amount of time spent on differ-ent parts of the dietary interview, and the contribution of total nutrient intake from the different components of the diet history method was examined. Secondly, a series of tests was conducted using two samples of the MDC study population to examine the effect of different coding and portion-size estimation alternatives on the ability to esti-mate group mean intakes, and to rank individuals on nu-trient intakes. Study II examines MDC baseline data collected before and after the change in routines, and eval-uates whether the alteration in handling dietary data in-fluenced the observed mean intakes of selected
food-groups and nutrients, independently of lifestyle and char-acteristics of study-participants.
Methods
The Malmö Diet and Cancer study
Population and baseline examinations
The baseline examinations of the MDC study started in March 1991 and ended in October 1996. Eligible partici-pants were men in the age-range 46 to 73 years, and wom-en in the age-range 45 to 73 years, living in the City of Malmö and with Swedish reading and writing skills. When recruitment closed, 28 098 persons had completed all baseline examinations. The data collection included dietary habits, socio-economics, medical history, and life-style habits using questionnaires and interview. Anthro-pometrics, body composition, and blood pressure were collected through direct measurements. Blood samples were collected, frozen, and stored for biochemical analy-sis at a later stage. Participants visited the study centre twice. During the first visit, the study procedures and questionnaires were explained, direct measurements made and blood samples collected. Two weeks later, the questionnaires completed at home were reviewed and the diet history interview conducted.
The modified diet history method
The modified diet history method of the MDC [19] con-sisted of a menu book and a diet history questionnaire. In the menu book, participants recorded cooked meals, cold beverages (i.e., milk, juice, soft drinks, water and alcoholic beverages), drugs, natural remedies, and dietary supple-ments during seven consecutive days. In the diet history questionnaire the general meal pattern and the frequency and portion-size information of foods consumed regular-ly and with low day-to-day variation (i.e., hot beverages, sandwiches, edible fats, breakfast cereals, yoghurt, milk, fruits, cakes, candies and snacks) were recorded. The refer-ence period of the questionnaire was the preceding year. The choice of methodology was guided by the need to as-sess total diet in a middle-aged and older urban popula-tion where the daily eating habits included cooked meals and mixed dishes. The participant at home estimated the usual portion-sizes of foods reported in the questionnaire from a booklet with 48 black and white photographs. A more extensive book of photographs was used during the dietary interview to estimate usual portion-sizes of dishes and foods in the menu book. During the interview, the questionnaire and the menu book were checked, accord-ing to predefined rules, so that reported food consump-tion did not overlap and were in concordance with the overall meal pattern reported by the participant.
intake data by use of the interactive computer software KOSTSVAR (AIVO AB), and the Swedish Food Database PC KOST2-93 of the Swedish National Food Administra-tion. PC KOST2-93 contains approximately 1600 basic foods; additional recipes and food codes were added spe-cifically for the MDC study.
Portion-sizes were estimated with photographic aids dur-ing the interview. Typically, a set of 4 photos (A-D), dis-playing 4 different portion-sizes of the same dish, was shown to the participants. One set of photos was shown for each dish, or food, registered in the menu book. The participants were not limited to the amounts indicated by the photos, but were encouraged to describe their usual portion-sizes as exact as possible. Thus, portion-sizes could be expressed in several ways i. e. "half the size of C", "between B and C", "D plus A" etc. Information on por-tion-sizes was entered into the computer and converted into grams.
When coding foods and mixed dishes recorded in the menu book, the software guided the interviewer through a system of "recipe identifiers". These specifically helped identify preparation methods and ingredients in mixed dishes. A "recipe identifier" indicating the type of dish (e.g., casserole with meat) was first entered. The following menu on the screen listed potential codes, indicating the specific constituents of different casseroles. The interview-ers choose the most appropriate code and made necessary adaptations of the recipe concurrently, depending on the information given by the participant. The MDC method included the option of exchanging a maximum of four in-gredients in standard (default) recipes. The ingredient changes focused on the amount and quality of fat (type of dietary fat, liquid in sauces and casseroles, meat, fish) and vegetables. In addition, the MDC method included the option of creating new individual recipes during the die-tary interview. This procedure was used (by judgement of the dietary interviewer) when standard recipes, with ingre-dient exchanges, did not cover the recipe described by the participant.
Extensive in-service training, the interactive computer software with specific coding rules and a continuous qual-ity control program of collected data ensured standardisa-tion of dietary data collecstandardisa-tion across dietary interviewers. Weekly training sessions and bi-yearly workshops were conducted to discuss and solve problems related to coding and entering of dietary data. In addition, the two head nu-tritionists (I.M. and U.J.) conducted weekly inspections of questionnaires and menu books (randomly selected from each dietary interviewer), and regularly listened in on di-etary interviews. Extreme portion-sizes were identified through a monthly, computerised quality control routine, and were either verified or corrected if erroneous. In
addi-tion, the extreme and median values of total energy, all nutrients, and major food groups were regularly inspect-ed, and erroneous values attended to. Finally, the age and gender specific ratios of total energy intake to basal meta-bolic rate (EI/BMR) was computed [21], using the formu-la for BMR identified by a joint FAO/WHO/UNU expert consultation [22]. Extreme and median values were iden-tified, and the dietary reports of these individuals were checked for errors.
The concurrent validity of the diet assessment method was previously tested against 18 days of weighed food records, collected during one year, as the reference [12]. The vali-dation study included 241 Malmö residents (126 men and 115 women) in the age range 50–69 years. The energy and nutrient correlations were amongst the highest com-pared to those found in validation studies of other "usual" diet instruments, performed in other populations [23– 27].
Study I: Development of new routines to handle
dietary data
Methods
Study I describes the development procedures undertaken during the autumn of 1993 and spring of 1994, prior to implementing the change of routines in dietary data han-dling.
Preparatory phase Interview time
Six dietary interviewers with long interviewing experience recorded the amount of time required for the different parts of the diet history interview (i.e., information given to participants, general meal pattern, menu book, and diet history questionnaire). The time records were kept during one week in the autumn of 1993 and included interviews with all study-participants (n = 64), seen by the six inter-viewers that week.
Nutrient intakes from the different components of the diet history method
nutri-ent-markers of specific food groups (e.g. B12 for meat and eicosapentaenoic acid for fish). The percentage contribu-tion of different food sources in the menu book was cal-culated for the following nutrients: Total fat, saturated fatty acids (SFA), monounsaturated fatty acids (MUFA), polyunsaturated fatty acids (PUFA), linoleic acid (18:2), α-linolenic acid (18:3), eicosapentaenoic acid (EPA), cho-lesterol, β-carotene, tocopherol, selenium, dietary fibre, B12, and folic acid.
Tests of different options for reducing interview time Test-samples
Two samples from the MDC cohort were selected for the testing of interview simplifications. All study participants who joined the study during 1992 (2660 women and 1769 men) and 156 study participants (88 women and 68 men) who joined the study in November and December 1993.
Standard portion-sizes and simplified coding
Dietary data collected from individuals of the larger sam-ple was used in three steps testing the use of standard por-tion-sizes and simplified coding. First, median portion-sizes were defined, separately for men and women; these were used as "standard portion sizes" in the tests. Second-ly, intake data assessed with the original individually esti-mated portion-sizes were compared with intake data using the standard portion-sizes for a limited number of dishes and foods (see appendix 1). Thirdly, intake data as-sessed with the original recipe coding (with ingredient ex-change options) were compared with intake data obtained with recipes in the default format (standard rec-ipes with no exchanges). These tests focused on recrec-ipes that required large time input during coding, and dishes with low nutrient contributions (see appendix 1). Nutri-ent intake estimates of test data were compared with orig-inal data.
The combined effect of simplified coding and standard portion-sizes was finally examined. In the same data set, the individually estimated portion-sizes were converted to standard portion-sizes, and the recipes with exchange op-tions were converted to default recipes. The combined ef-fect was examined by comparing converted data with original data (i.e., data including both individually esti-mated portion-sizes and exchange of ingredients in reci-pes).
Fewer portion-size photos and individual recipes
Individuals of the smaller sample participated in an exper-iment of using fewer portion-size photos. In this test, one set of photos was selected to represent several foods with-in a food group (e.g. photos of one type of boiled vegeta-bles for all types of boiled vegetavegeta-bles). The number of photo sets was reduced from 180 to 14. Participants were
asked to select portion-sizes twice: first with to the origi-nal, complete photo sets, and then using the reduced number photo sets. In addition, data from the smaller sample were used to examine the effect of not using indi-vidual recipes, by re-coding all indiindi-vidual recipes to the "best choice" among the standard recipes in the existing database. The two head nutritionists undertook this re-coding procedure after completion of the dietary inter-views.
Nutrient variables
The nutrients examined when testing the effect of different portion-size and coding alternatives were: Total energy (kcal), total fat (g), linoleic acid, 18:2 (g), α-linolenic ac-id, 18:3 (g), eicosapentaenoic acac-id, EPA (g), tocopherol (g), selenium (µg), β-carotene (mg), ascorbic acid (mg), dietary fibre (g) and B12 (µg).
Statistical tests
Paired t-tests were used to compare mean nutrient intakes between test data and original data. The effect of changed routines on ranking of individuals was examined with two approaches. First, quintiles of energy and nutrient intakes estimated from the original data were cross-classified against quintiles of the test data. Secondly, correlation analysis was conducted comparing data from the original data with the test data. The Pearson product moment cor-relation coefficients were calculated for energy and all ex-amined nutrients. In all tests, all variables were logarithm transformed and nutrient intakes were energy-adjusted ac-cording to the residual method [28]. Tests with the larger sample of standardised portion-sizes and of simplified coding, were gender specific. In addition, these tests first examined the specific effect of each subset of codes (ap-pendix 1), and secondly, the total effects of all subsets. The combined effect of standard portion-sizes and simpli-fied coding was examined with all subsets of codes.
Results and Discussion
Preparatory phase
with meat, fish, or egg contributed most to selenium in-takes, and meat and fish dishes to B12.
Tests of different options for reducing interview time
Because handling of dietary information from the menu book, specifically the use of certain portion-size aids and
coding routines, proved to be the most time-consuming parts of the dietary interview, these were given priority in method development. Although, the overall intake contri-bution of the menu book was smaller compared to the diet questionnaire, a concern was raised for some nutri-ents (from vegetables, meat and fish) of potential
impor-Table 1: Energy and nutrient contributions by major food groupsa, recorded by women (n = 2660) in the menu-book.
Energy Total
fat SFA MUFA PUFA 18:2 18:3 EPA Cholesterol
β-carotene Tocopherol Selenium Dietary
fibre B12 Folic acid
Total
menu-bookb 29.6 34.0 29.7 38.0 36.2 33.6 35.7 65.7 51.6 57.4 34.2 57.8 27.0 47.3 33.1
Potatoes 4.3 1.7 1.3 2.0 2.4 2.0 2.6 <1.0 <1.0 <1.0 2.4 <1.0 5.7 <1.0 3.4 Rice <1.0 <1.0 <1.0 <1.0 <1.0 <1.0 <1.0 <1.0 <1.0 <1.0 <1.0 1.1 1.2 <1.0 <1.0 Pasta <1.0 <1.0 <1.0 <1.0 <1.0 <1.0 <1.0 <1.0 <1.0 <1.0 <1.0 <1.0 <1.0 <1.0 <1.0 Sauce/gravy 1.4 2.8 3.1 2.9 2.0 2.0 2.9 <1.0 1.2 <1.0 2.2 <1.0 <1.0 <1.0 <1.0 Meat 4.4 6.8 6.1 8.6 4.8 4.5 3.1 4.8 10.7 <1.0 2.7 11.8 <1.0 17.7 2.5 Minced meat 1.2 1.8 1.8 2.2 1.2 1.1 <1.0 <1.0 2.9 <1.0 <1.0 2.2 <1.0 1.3 <1.0 Sausage 1.4 2.8 2.5 3.8 1.7 1.6 1.1 <1.0 2.0 <1.0 <1.0 <1.0 <1.0 1.5 <1.0 Fish 1.5 1.8 1.1 1.9 2.9 1.2 1.8 40.5 4.2 <1.0 3.7 15.6 <1.0 10.1 <1.0 Boiled
vegetables <1.0 <1.0 <1.0 <1.0 <1.0 <1.0 1.2 <1.0 <1.0 14.3 <1.0 <1.0 3.1 <1.0 4.4 Salad as side
dish <1.0 <1.0 <1.0 <1.0 1.4 1.6 1.5 <1.0 <1.0 25.4 2.7 <1.0 4.0 <1.0 7.2 Soups <1.0 <1.0 <1.0 <1.0 <1.0 <1.0 <1.0 <1.0 <1.0 4.1 1.0 1.1 1.7 <1.0 1.4 Casseroles 1.8 2.2 2.2 2.6 1.7 1.5 2.9 1.6 2.5 5.7 2.3 3.2 2.6 3.8 3.2 Desserts 1.7 1.7 1.9 1.7 1.4 1.4 1.6 <1.0 1.4 <1.0 2.0 <1.0 1.6 <1.0 <1.0 Dressing <1.0 <1.0 <1.0 <1.0 3.6 4.2 2.9 <1.0 <1.0 <1.0 <1.0 <1.0 <1.0 <1.0 <1.0 Egg dishes <1.0 1.4 1.1 1.7 1.1 1.0 1.1 <1.0 8.7 <1.0 2.2 4.8 <1.0 1.5 <1.0
a Food groups contributing less than one percent of energy and most nutrients but more than 1.5% of at least one key nutrient: Cold sauce: 18:2– 3.6%, 18:3–3.0%; Smoked fish: EPA–5.1%, Selenium-1.7%, B12-1.7%; Boiled shellfish: 20:5–1.6; Salad as main dish: Se-1.9%; Salad with mayonnaise: cholesterol-6.1%; Gratin: Se-3.2%, B12-1.8% b Excluding beverages
Table 2: Energy and nutrient intake contributions by major food groupsa recorded by men (n = 1769) in the menu-book.
Energy Total fat
SFA MUFA PUFA 18:2 18:3 EPA Cholesterol β-carotene Tocopherol Selenium Dietary fibre
B12 Folic acid
Total menu
bookb 30.5 34.2 30.5 38.1 34.5 31.7 35.5 62.9 50.1 68.0 34.5 57.5 29.6 45.2 34.2
Potatoes 5.6 2.4 1.8 2.8 3.1 2.7 3.7 <1.0 <1.0 1.3 3.6 <1.0 8.1 <1.0 5.1 Rice <1.0 <1.0 <1.0 <1.0 <1.0 <1.0 <1.0 <1.0 <1.0 <1.0 <1.0 1.2 1.3 <1.0 <1.0 Pasta <1.0 <1.0 <1.0 <1.0 <1.0 <1.0 <1.0 <1.0 <1.0 <1.0 <1.0 <1.0 <1.0 <1.0 <1.0 Sauce/gravy 1.4 3.0 3.3 3.0 2.1 2.1 3.2 <1.0 1.3 <1.0 2.6 <1.0 <1.0 <1.0 <1.0 Meat 5.2 7.8 7.3 9.7 5.2 4.8 3.6 4.9 13.0 <1.0 3.4 14.3 <1.0 18.8 3.0 Minced meat 1.2 1.8 1.8 2.2 1.1 1.0 <1.0 <1.0 3.2 <1.0 <1.0 2.4 <1.0 1.3 <1.0 Sausage 1.7 3.3 1.8 2.2 1.1 1.0 <1.0 <1.0 2.6 <1.0 <1.0 <1.0 <1.0 1.7 <1.0 Fish 1.5 1.8 1.1 2.0 2.9 1.1 1.9 41.7 4.1 <1.0 3.8 15.4 <1.0 9.4 1.0 Boiled
vege-tables
<1.0 <1.0 <1.0 <1.0 <1.0 <1.0 <1.0 <1.0 <1.0 16.2 <1.0 <1.0 2.5 <1.0 3.6
Salad as side dish
<1.0 <1.0 <1.0 <1.0 1.1 1.3 1.1 <1.0 <1.0 28.6 2.1 <1.0 3.3 <1.0 6.1
Soups <1.0 <1.0 <1.0 <1.0 <1.0 <1.0 <1.0 <1.0 <1.0 5.6 <1.0 1.3 2.2 <1.0 1.5 Casseroles 1.9 2.2 2.1 2.5 1.7 1.5 3.0 1.1 2.7 7.9 2.3 2.9 3.3 3.7 3.9 Complete
dishes
<1.0 <1.0 <1.0 1.0 <1.0 <1.0 <1.0 <1.0 1.2 <1.0 <1.0 1.0 <1.0 <1.0 <1.0
Desserts 1.2 1.2 1.3 1.1 <1.0 <1.0 1.1 <1.0 1.0 <1.0 1.4 <1.0 1.3 <1.0 <1.0 Dressing <1.0 <1.0 <1.0 <1.0 3.0 3.4 2.7 <1.0 <1.0 <1.0 <1.0 <1.0 <1.0 <1.0 <1.0 Egg dishes <1.0 1.2 1.0 1.5 <1.0 <1.0 1.0 <1.0 8.2 <1.0 2.0 4.6 <1.0 <1.0 <1.0
a Food groups contributing less than one percent of energy and most nutrients but more than 1.5% of at least one key nutrient: Smoked fish: EPA–4.1%; Salad as main dish: β
tance in diet-cancer studies [29]. This concern prompted the extensive testing of the potential changes in dietary data handling.
Because the menu book also contributed substantially to the assessment of important foods and nutrients, the pos-sible interview simplifications were limited to two proce-dures: portion-size estimation and coding of foods and dishes assessed through the menu book. The results from tests examining the combined effects are presented.
When examining data from the larger sample and the use of standard sizes compared to individual portion-sizes, the correlation coefficients were very high, in both men and women, table 3. The lowest correlation was ob-served in women for linoleic acid (r = 0.982) and α-lino-lenic acid (r = 0.983). In cross-classification of corresponding quintiles, the exact agreement was above 90 % for β-carotene, vitamin C, fibre, and B12 both in men and women. For energy, α-linolenic acid, tocopherol and selenium the agreement was between 85 and 90 cent. Linoleic acid had the lowest exact agreement, 84 per-cent in women. Crude data had slightly lower agreement in some nutrients, but for most nutrients, the results were the same. Differences in mean intakes of energy and nutri-ents were significant, original data had slightly higher (i.e., <2% for men and <1% for women) levels compared to test data (data not shown).
Also, with the larger sample, simplified coding only mar-ginally affected the ranking ability of observed intakes, ta-ble 3. The correlations were very high (r > 0.990) for energy and all nutrients, except β-carotene, in both gender groups. The exact agreement of corresponding quintiles was well above 90 percent for energy and most nutrients, in both men and women. In women, the exact agreement for β-carotene was 91 percent, and in men 89 percent. Crude data had slightly (1–2%) higher agreement. Differ-ences in mean energy and nutrient intakes were overall ex-tremely small, original data had somewhat higher (<1% for both men and women) intake levels). Differences were not significant for ascorbic acid in women and for fibre in men (data not shown).
The combined effect of standard portion-sizes and simpli-fied coding showed slightly lower correlations and agree-ments compared to standard portion-sizes or simplified coding only. Overall correlations were higher than 0.980, except for linoleic acid in women (r = 0.972). The exact agreement in classification was 85 percent or higher for energy and all nutrients except selenium (83 percent in women, 81 percent in men), linoleic acid, and α-linolenic acid in women (82 and 83 percent), data not shown.
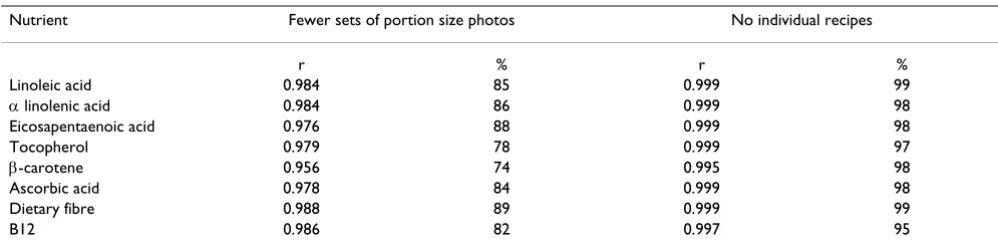
When testing the effect of fewer sets of portion-size pho-tos, in the smaller sample, compared to complete sets of photos, the correlations were high (r > 0.950) for all nu-trients. In cross-classification the exact agreement was be-tween 85 and 90 percent for fibre, eicosapentaenoic acid and α-linolenic acid. For most other nutrients, the agree-ment ranged between 75 and 85 percent, table 4. The low-est agreement (74 percent) was seen in β-carotene. Differences in mean intakes of energy, total fat, selenium and fibre were significant but small (1,5–3,5%), original data having the highest level (data not shown). Differenc-es in mean intakDifferenc-es of linoleic acid, α-linolenic, eicosapen-taenoic acid, tocopherol, β-carotene, ascorbic acid, and B12 were not significant.
When re-coding individual recipes to standard recipes, also with the smaller sample, the observed correlations were extremely high (r > 0.995) for all nutrients, table 4. The exact agreement of corresponding quintiles was 97 percent or more for most nutrients. For vitamin B12 the exact agreement was 95 percent. No significant differences were seen in mean intakes of energy or in any of the exam-ined nutrients (data not shown).
The influences on dietary intakes, ranking especially, of routine changes was small. Using standardised portion-sizes or reduced number of photo sets influenced the ob-served intakes to a larger extent, than using standard reci-pes instead of individual recireci-pes or recireci-pes with fewer ingredient exchanges.
his-tory questionnaire, or to coding of reported beverages in the menu book. There were no changes in the information given to participants on their first visit to the screening centre, nor was the menu book or diet history question-naire changed in layout, number of questions, or in any other way. Taken together the time allocated to each inter-view was reduced from 75 minutes to 45 or 60 minutes, depending on logistics at the screening centre.
Implications
It is not uncommon that large-scale studies modify meth-ods over time. For instance, the well-known Nurses Health Study has expanded its food frequency question-naire (FFQ) several times. A 61-item FFQ was used in 1982, when dietary data collection first was implemented [23]. However, a 121-item and a 134-item FFQ have been
used in later follow up studies [30,31]. As pointed out by Block, a FFQ should be validated in a population with the same age and sex distribution as the study population. If modifications are made, the ideal procedure is to validate the modified method together with the original in a new validation study [32].
All method development and tests described in this paper were carefully monitored, based on experiential knowl-edge, and supplemented with empirical data. The study design was under strict control and the tests illustrate the ideal situation. However, "in the real world" a number of other factors would also influence the effects of the meth-od change. Most of these were not possible to examine be-fore the change of data handling. For instance, the effect of the new coding rules when implemented in total was
Table 3: Correspondence between the original data and test data when using "Standard portion sizes" and "Simplified coding": Pearson correlation coefficients (r), and percent agreement (%) in cross-classification, of energy and nutrient estimates, separately for women (n = 2660) and men (n = 1769).
Energy and nutrients Standard portion-sizes Simplified coding
Women Men Women Men
r % r % r % r %
Energya 0.992 88 0.989 85 0.999 97 0.999 98
Total fatb 0.992 90 0.992 90 0.997 92 0.998 94
Linoleic acidb 0.982 84 0.984 86 0.996 94 0.997 92
α linolenic acidb 0.983 85 0.984 86 0.997 93 0.998 94
Eicosapentaenoic acidb
0.992 90 0.993 92 0.995 95 0.996 96
Tocopherolb 0.990 88 0.990 89 0.997 93 0.997 94
Seleniumb 0.984 85 0.984 86 0.996 93 0.995 94
β-caroteneb 0.998 96 0.997 95 0.988 91 0.981 89
Ascorbic acidb 0.996 94 0.993 93 0.998 96 0.998 95
Dietary fibreb 0.996 94 0.992 93 0.999 97 0.999 97
B12 b 0.995 90 0.996 92 0.991 93 0.996 95
a Unadjusted bEnergy-adjusted (residual method)
Table 4: Correspondence between the original data and test data when using "Fewer sets of portion size photos" and "No individual recipes": Pearson correlation coefficients (r), and percent agreement (%) in cross-classification, of selected nutrientsa (n = 156).
Nutrient Fewer sets of portion size photos No individual recipes
r % r %
Linoleic acid 0.984 85 0.999 99
α linolenic acid 0.984 86 0.999 98
Eicosapentaenoic acid 0.976 88 0.999 98
Tocopherol 0.979 78 0.999 97
β-carotene 0.956 74 0.995 98
Ascorbic acid 0.978 84 0.999 98
Dietary fibre 0.988 89 0.999 99
B12 0.986 82 0.997 95
not examined. It is also possible that the dietary interview-er's decisions on choice of codes were influenced in ways not predicted. In addition, the introduction of new rou-tines was preceded by intensified training sessions, which possibly could influence the dietary interviewers to follow all rules more consistently. Long interviewing experience could have had the opposite effect. In addition, the short-er intshort-erview time could potentially produce unintended influences on the complex interview. Both the partici-pants and the interviewers might for instance experience the situation as more stressful. The interviewers met more participants each day and, although the number of ques-tions asked was reduced, seeing more individuals could be perceived as an added burden. Many participants wanted to talk about details in recipes and food choices. With the reduced interview time and simplified coding procedures, there was neither time nor need for details, which could have been negatively perceived by the participants. In ad-dition, it is possible that the shorter interview had non-in-tended influences on the check-up of diet history questionnaires.
In summary, the tests indicated that a change of dietary data handling routines potentially was possible without major effects on ranking of individuals on dietary intakes. However, the tests could not fully evaluate the impact of the change in dietary data handling. Such an evaluation was only possible after implementing the altered routines in the "real world" setting.
Study II: Comparison of intakes estimated
be-fore and after routine change
Methods
Study II is a post hoc study that uses data from the MDC baseline examinations, and examines observed mean in-takes before and after change in routines.
Study-samples
Study II uses of two samples selected from the MDC co-hort to include individuals joining the study before and after the alteration of interview routines (i.e., the original routines were in use until August 31 1994, and the new
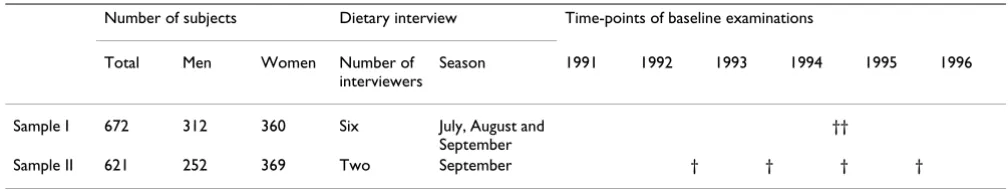
routines started on September 1 1994. Also, see Table 5). A study design with paired comparisons (i.e., data collect-ed with both methods in the same individuals) was not possible. One sample included 672 individuals who joined the study in July and August 1994 (i.e., just before the alteration) and in September 1994 (i.e., right after the alteration). The other sample, selected to avoid seasonal influences, consisted of 621 individuals who joined the study in the month of September during four consecutive years (i.e., 1992 and 1993 before the alteration, 1994 and 1995 after the alteration).
Variables Method version
A dichotomous method variable was constructed in each of the two data sets. Individuals that joined the study be-fore September 1 1994 were categorised as "One", and those that joined in September 1994 or later as "Two".
Dietary interviewer
The two samples were selected with regard to interview month and year, but without specifying any particular di-etary interviewer. As a result, study-participants were not uniformly distributed across the six dietary interviewers and the two method versions of sample I. However, par-ticipants belonging to sample II were interviewed by two dietary interviewers only (i.e., those that interviewed a sufficient number of participants for all four study peri-ods), and were evenly distributed across both dietary in-terviewers and method versions.
Food groups, energy and nutrients
The method development and tests before alteration of routines indicated that the menu book contributed about 30 percent of the intake information for most nutrients, but for some nutrients, more than 50% of the information came from the menu book. Therefore, this study selected eight food groups to represent foods assessed mainly through the menu book (i.e., vegetables, meat, fish and milk), or the diet history questionnaire (i.e., fruits, bread, dietary fats and cheese). Energy and nutrient variables were also selected so that both those with smaller and
Table 5: Samples selected for Study II in order to compare observed intakes before and after alteration of dietary data collection routines.
Number of subjects Dietary interview Time-points of baseline examinations
Total Men Women Number of interviewers
Season 1991 1992 1993 1994 1995 1996
Sample I 672 312 360 Six July, August and September
††
larger contributions from the menu book would be repre-sented, that is total energy (kcal), total fat (g), dietary fibre (g), polyunsaturated fatty acids, PUFA (g), β-carotene (mg), B12 (µg), selenium (µg), and eicosapentaenoic ac-id, EPA (g).
Socio-economic, demographic and lifestyle information was in the MDC collected through a self-administrated questionnaire. The influence of age, gender, and socio-economic status were in this study examined as covariates and cofactors in the final multivariate analysis.
Leisure time physical activity was assessed by a list of ac-tivities in the questionnaire (18 items), modified from of the Minnesota Leisure Time Physical Activity Instrument [33]. Participants were asked to report how many minutes per week on average, and for each of the four seasons, they spend on a specific activity. A physical activity score was obtained by multiplying the number of minutes for each activity with an activity-specific factor, and four category variable was defined by the participants' quartile ranking.
This study used Body Mass Index (BMI) and Waist-Hip Ratio (WHR), computed from direct measurements, as in-dicators of obesity. Leisure time physical activity, BMI and WHR were included as covariates in the final multivariate analysis.
Statistical analysis
The statistical package SPSS was used in all analytical pro-cedures [34]. All continuous variables were
log-trans-formed before analysis to normalise distributions. Intakes of selected food groups, energy, and nutrients were com-pared between the first and second method versions using the general factorial analysis of variance including two-way interactions. The relations between intakes and meth-od versions were first examined in a gender specific fully factorial design, including dietary interviewer as a cofac-tor. Secondly, gender specific models using main effects designs were constructed, including dietary interviewer-method interaction terms if significant. Finally, nutrient intakes were compared between method version while si-multaneously controlling for energy intake, dietary inter-viewer, socio-economic status, age, obesity indicators (BMI and WHR), and leisure time physical activity. In or-der to account for the fact that dietary interviewer repre-sents a stochastic (random) effect, the model was also formulated as a mixed general factorial model [35]. How-ever, the analysis indicated that the stochastic effects as-sumption of dietary interviewers was not valid (the estimated variance components were negative), and there-fore only the fixed model analysis is reported.
Results
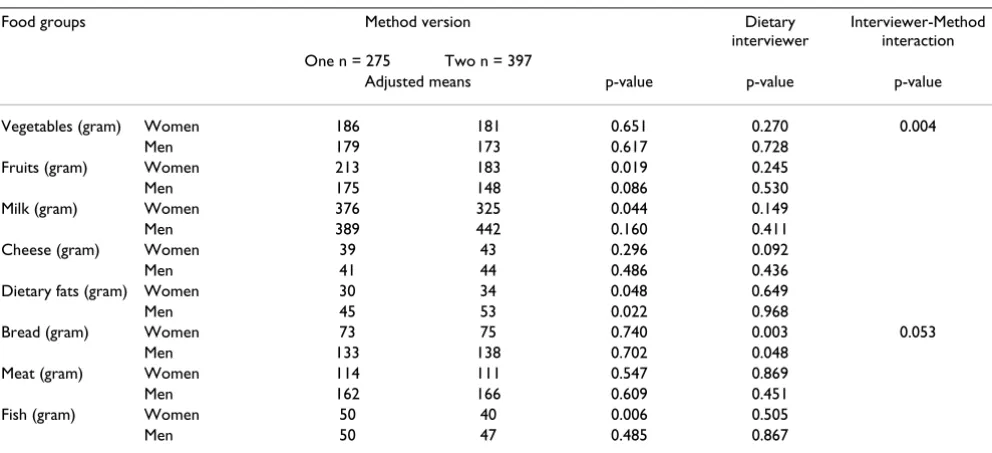
The short term effects of change in data collection rou-tines involving six dietary interviewers are illustrated by comparison of intakes using sample I. As indicated in Ta-ble 6 women underestimated fish, fruits and milk with the second method version compared to the first, but both men and women overestimated dietary fats. In women, a dietary interviewer-method interaction was seen for vege-tables.
Table 6: Comparison of mean food group intakes before and after change in dietary data handling routines, sample I (n = 672)a.
Food groups Method version Dietary
interviewer
Interviewer-Method interaction One n = 275 Two n = 397
Adjusted means p-value p-value p-value
Vegetables (gram) Women 186 181 0.651 0.270 0.004
Men 179 173 0.617 0.728
Fruits (gram) Women 213 183 0.019 0.245
Men 175 148 0.086 0.530
Milk (gram) Women 376 325 0.044 0.149
Men 389 442 0.160 0.411
Cheese (gram) Women 39 43 0.296 0.092
Men 41 44 0.486 0.436
Dietary fats (gram) Women 30 34 0.048 0.649
Men 45 53 0.022 0.968
Bread (gram) Women 73 75 0.740 0.003 0.053
Men 133 138 0.702 0.048
Meat (gram) Women 114 111 0.547 0.869
Men 162 166 0.609 0.451
Fish (gram) Women 50 40 0.006 0.505
Men 50 47 0.485 0.867
In women, unadjusted energy and nutrient intakes were mostly underestimated with the second method version compared to the first, except for polyunsaturated fatty ac-ids and β-carotene. In men, only energy, selenium, and fi-bre were underestimated with the second method version. Significant dietary interviewer-method interactions were seen for β-carotene and B12 in women, and for energy, fi-bre, and selenium in men (data not shown).
When additional variables were added to the models (Ta-ble 7) energy intakes remained significantly lower for both gender groups. However, energy-adjusted fat intakes were higher with the second method version. Intake dif-ferences remained significant with adjustments for ener-gy, fat, selenium, and B12 in women, and for enerener-gy, fat, and fibre in men. The only dietary interviewer-method in-teraction that remained significant was that for differences in β-carotene in women.
Similar comparisons using sample II, which illustrate the long term effects of altered routines involving only two di-etary interviewers, indicate that fruit intakes were underes-timated in women with version two, but dietary fats were overestimated (Table 8). No food-group differences be-tween method versions were seen in men, but significant dietary interviewer-method interactions were observed for cheese, dietary fats, and bread.
When examining unadjusted intakes in women, eicosap-entaenoic acid, fibre, selenium, and B12 were underesti-mated with the second version, but no differences were seen in energy and other nutrients. In men, energy and B12 were significantly underestimated, but β-carotene was overestimated with the second version compared to the first. Significant dietary interviewer-method interac-tions were observed in women for eicosapentaenoic acid, and in men for energy, fat and PUFA.
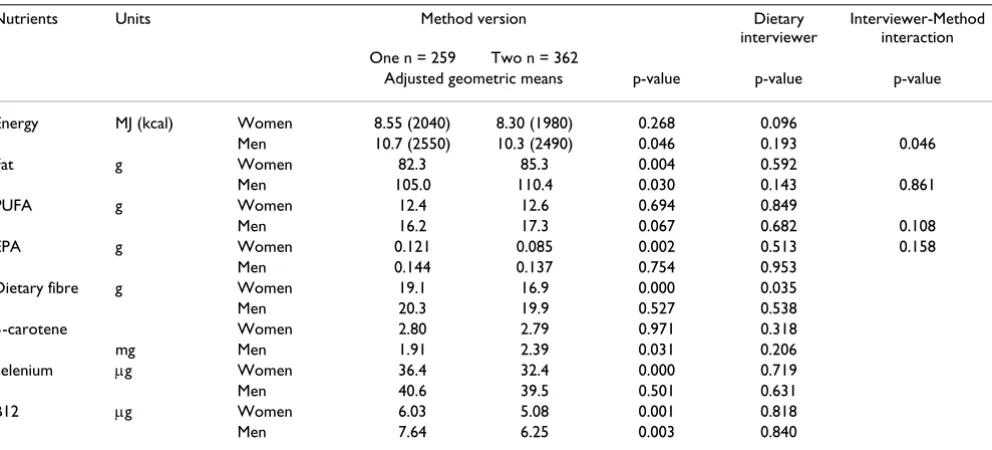
When including additional variables in the models (Table 9), most differences remained significant. All dietary in-terviewer-method interactions disappeared, except for en-ergy in men. Enen-ergy-adjusted fat was overestimated in both gender groups.
Thus, differences in energy-adjusted total fat estimates were consistent in both data sets. After altered interview routines energy-adjusted fat intakes were overestimated. Additional adjustment did not change these relationships, but the dietary interviewer effects and interactions were re-moved (Table 7 and 9). In addition, estimates of poly-un-saturated fatty acids and eicosapentaenoic acid showed some consistency in both data sets. With energy adjusted data there were no differences in poly-unsaturated fatty acid intakes in either data set. Intakes of eicosapentaenoic acid were significantly underestimated for women in both data sets without energy adjustment, but only in sample II when adjusting for energy.
Table 7: Adjusted comparisons of energya and nutrientb intakes before and after change in dietary data handling routines, sample I (n
= 672).
Nutrients Units Method version Dietary
nterviewer
Interviewer-Method interaction One n = 275 Two n = 397
Adjusted geometric means p-value p-value p-value
Energy MJ (kcal) Women 8.79 (2100) 7.92 (1890) 0.000 0.092
Men 11.0 (2620) 10.3 (2460) 0.045 0.216 0.189
Fat g Women 79.8 83.2 0.021 0.229
Men 103.0 110.2 0.001 0.933
PUFA g Women 12.3 12.5 0.625 0.196
Men 16.3 17.3 0.078 0.993
EPA g Women 0.119 0.091 0.064 0.291
Men 0.130 0.122 0.607 0.666
Dietary fiber g Women 17.4 17.2 0.690 0.082
Men 20.6 19.0 0.022 0.607 0.131
β-carotene Women 2.48 2.61 0.572 0.601 0.033
mg Men 2.25 2.05 0.341 0.611
Selenium µg Women 37.0 32.5 0.000 0.693
Men 41.9 39.0 0.076 0.867 0.320
B12 µg Women 6.08 5.32 0.038 0.349 0.108
Men 6.64 6.53 0.784 0.178
Total variation
Although the relations with fat appear consistent, dietary interviewer and method version explained a very small proportion of the total variation in fat intake. The R-squared was 0.023 for women in sample I, and 0.004 for
men, when the model included method version and die-tary interviewer only. With additional adjustment (i.e., energy, obesity indicators, age, socio-economic status), the R-squared was 0.777 in women and 0.812 in men. The corresponding figures for sample II are 0.005 for women
Table 8: Comparison of mean food group intakes before and after change in dietary data handling routines, sample II (n = 621)a.
Food groups Method version Dietary
interviewer
Interviewer-Method interaction One n = 259 Two n = 362
Adjusted means p-value p-value p-value
Vegetables (gram) Women 191 182 0.422 0.164
Men 178 178 0.989 0.069
Fruits (gram) Women 227 196 0.031 0.563
Men 167 163 0.758 0.652
Milk (gram) Women 348 335 0.577 0.532
Men 390 406 0.658 0.080
Cheese (gram) Women 39 44 0.217 0.201
Men 42 38 0.463 0.402 0.010
Dietary fats (gram) Women 32 37 0.029 0.240
Men 47 49 0.587 0.865 0.029
Bread (gram) Women 78 76 0.642 0.692
Men 124 129 0.681 0.123 0.035
Meat (gram) Women 111 116 0.337 0.500
Men 164 164 0.982 0.160
Fish (gram) Women 42 39 0.361 0.583
Men 45 51 0.222 0.628
a adjusted for dietary interviewer and interviewer-method interaction
Table 9: Adjusted comparisons of energya and nutrient b intakes before and after change in dietary data handling routines, sample II (n
= 621).
Nutrients Units Method version Dietary
interviewer
Interviewer-Method interaction One n = 259 Two n = 362
Adjusted geometric means p-value p-value p-value
Energy MJ (kcal) Women 8.55 (2040) 8.30 (1980) 0.268 0.096
Men 10.7 (2550) 10.3 (2490) 0.046 0.193 0.046
Fat g Women 82.3 85.3 0.004 0.592
Men 105.0 110.4 0.030 0.143 0.861
PUFA g Women 12.4 12.6 0.694 0.849
Men 16.2 17.3 0.067 0.682 0.108
EPA g Women 0.121 0.085 0.002 0.513 0.158
Men 0.144 0.137 0.754 0.953
Dietary fibre g Women 19.1 16.9 0.000 0.035
Men 20.3 19.9 0.527 0.538
β-carotene Women 2.80 2.79 0.971 0.318
mg Men 1.91 2.39 0.031 0.206
Selenium µg Women 36.4 32.4 0.000 0.719
Men 40.6 39.5 0.501 0.631
B12 µg Women 6.03 5.08 0.001 0.818
Men 7.64 6.25 0.003 0.840
and 0.033 for men (when the model also included the di-etary interviewer-method version interaction term). With additional adjustment, the R-squared was 0.804 for wom-en in sample II and 0.773 for mwom-en. Whwom-en the multivariate relation between fat intake and adjusting variables was ex-amined, excluding method version and dietary interview-er, the R-squared was in sample I 0.773 for women and 0.806 for men. In sample II, the corresponding numbers were 0.801 for women and 0.769 for men. Thus dietary interviewer, method version and dietary interviewer-method interactions explain less than one percent of the total variation in fat intake.
In summary, after alteration of interview routines intakes of energy and several of the examined nutrients were low-er, but energy-adjusted intakes of total fat appear overesti-mated. However, method version and dietary interviewer explained a very small proportion of the total variation of fat intake. The altered routines also appeared to affect in-take estimates more in women than in men. For instance, fruits were consistently underestimated and dietary fats overestimated in women. Dietary interviewer-method in-teractions, contributed significantly to observed differenc-es between method versions in several food groups and unadjusted nutrient intakes, but most of these did not re-main significant in multivariate analysis. It should be not-ed that, due to the multitude of comparisons, some of the observed differences between method versions might be due to type I errors.
Discussion
Study II does not compare two dietary assessment meth-odologies, but evaluates whether two different approach-es in handling of dietary data collected with the same MDC dietary history method produce similar mean intake estimates. The MDC study used a detailed dietary history method to enhance precision of dietary intake estimates. The high concurrent validity of the MDC diet history method has previously been documented [3,36]. Other studies, which have opted for the less costly food frequen-cy questionnaire method appear to show weak or incon-sistent results [37], and have attracted strong criticism [28,38]. Different types of methodologies differ greatly in details of food information and precision. A common threat to all nutrition epidemiological studies is random non-differential misclassification, because it commonly results in attenuated diet-disease relations. The source of such misclassification is often measurement "errors" in the dietary assessment process [38–42]. Systematic mis-classification between population sub-groups is a serious problem in descriptive studies when mean nutrient in-takes of specific population groups are estimated in order to evaluate the health status of the population. For in-stance, mean nutrient intakes are commonly compared with recommended daily intakes of specific nutrients.
Re-gardless of choice of assessment methodology, it is essen-tial for nutrition epidemiologists and public health nutritionists to understand the specific features of the di-etary assessment process so that these can be accounted for in analysis and interpretation of results. For instance, diet history methods may not be robust to changes in the interviewer [2]. Also, the ability of individuals to estimate portion-sizes and common consumption frequencies in usual diet methods may depend on the specific assess-ment aid [22,43,44], the interview technique [45,46], or the organisation of the food list [47]. Studies also suggest that usual diet reports may be affected by diverse factors like season of data collection [48], ethnicity and educa-tion [13], degree of obesity [7,49], socio-economic status [12], and the perception of societal norms [50,51].
Impact of method change
The altered routines of dietary data handling were only implemented for foods estimated with the menu book. No changes were made to the routines of the diet history questionnaire, or to coding of reported beverages in the menu book. The implemented changes in coding and por-tion size estimapor-tion were selected so that assessment of vegetables, of major selenium sources, of total fat and pol-yunsaturated fatty acids would not be compromised. There was a concern that foods (like vegetables, meat and fish) and nutrients (like β-carotene, selenium and EPA) with hypothesized importance for cancer development would be most affected. The different results observed in this study for women and men, the elevated estimates of energy-adjusted fat, and the dietary interviewer-method interactions (i.e., bread, cheese and dietary fats in men) were not expected. The findings may indicate that the in-dividual portion sizes in version one produced estimates with higher precision in women, and that lower precision was obtained with the standardized portion-sizes of ver-sion two. In men, the two method verver-sions may not have produced such differences in precision. This observation is supported by findings from another methodological study within the MDC, which concluded that women were better compared to men at estimating the amount of fat on bread when using photographic aids [14]. Research-ers have observed that women are likely to respond differ-ently to dietary assessment than men, although it is hard to fully conceptualise what it is about gender that cause these differences [2]. Studies imply that gender differences may be population specific [13], and depend on personal characteristics [51].
conclusions about healthfulness of diet could be made, if method versions are not randomly distributed across in-take levels and population sub-groups. Descriptive studies should consider selecting samples assessed with either method version to avoid distorted intakes. Depending on the specific research question adjustment for year and sea-son of dietary interview, and dietary interviewer, should also be considered.
Some seasonal influences on observed intakes are expect-ed in the MDC study. The menu book requests "current diet" information from seven consecutive days, while the questionnaire asked participants about their "usual diets" during the past year. Current diet methods (like diet records and 24-hour recalls) reflect dietary intakes on sin-gular days, and are influenced by seasonal variation in food selection [3,52]. However, usual diet reports also tend to be influenced by the season of data collection [48]. This study controlled for season of data collection in the design, i.e., selecting individuals examined in the month of September during four consecutive years re-moved the influence of season. However, seasonal differ-ences could be expected when comparing participants examined in the summer or early autumn with those ex-amined during winter or early spring. Future studies there-fore may need to consider seasonal adjustment in analysis.
The elevated fat estimates in relation to total energy with the second method was an unexpected finding. It is plau-sible that when the interview time was reduced compara-tively more attention was given by dietary interviewers to fat providing foods, which resulted in an overestimation of fat relative to other macronutrients. This is illustrated by the overestimation of dietary fats and underestimation of fruits with version two. Both food groups are important energy contributors in this population. These observa-tions could have implicaobserva-tions for future studies of the re-lation between dietary fat and disease. Due to the latency period of chronic disease, it is likely that many cases will be assessed with the first version of the dietary assessment method during the early follow-up period. A greater pro-portion of non-cases would then erroneously be assigned to higher energy-adjusted fat intakes. If this were to hap-pen in a study examining the relation between dietary fat and disease, the interpretation would be that dietary fat protects against disease even if there was no "true" rela-tion. It should, however, be noted that method version ex-plained a very limited proportion of the overall variation in fat intakes. Because method version, dietary interviewer and dietary interviewer-method version interactions ac-counted for less than one percent of the total variation, the impact of method change may be small in analytical studies. However, the distribution of cases and non-cases across methods version should be monitored in future
an-alytical studies, and its impact on outcomes evaluated fur-ther.
Limitations
This study could only compare group mean intakes in groups of individuals participating in the MDC baseline examinations either before or after the change in method-ology. The two method versions were not administrated in parallel and therefore it was not possible to compare means or ranking of estimates in the same individuals (i.e., paired comparisons). This approach probably exag-gerated observed differences between method versions. It may be the major reason why the results are discrepant from those of Study I. The development work either used paired comparisons in the same individuals or dealt with recoded data. Other studies of usual diet methods have, however, found that portion size estimation have greater influence on estimated group means than on the ranking ability [4–6]. It is therefore plausible that the apparent un-derestimation of the second version compared to the first does not affect the ranking ability to the same degree. Since studies of diet and disease are examining the differ-ence in risk between extreme exposure groups [3], the in-fluence from the two method versions on ranking of nutrient intakes would be of major interest, but the design of this study did not allow for such examinations.
Another limitation is the non-random distribution of in-dividuals and dietary interviewers across comparison groups. The multivariate analysis used both fixed and mixed models, but the results presented are those from the fixed model analysis. The overall effect of dietary inter-viewer appeared to be very small and the assumption of stochastic (random) effects of dietary interviewers was not valid. It can be argued that this study underestimated the overall dietary interviewer effects, because only a few die-tary interviewers conducted interviews in the data sets se-lected for analysis. However, small differences across dietary interviewers are also an indication that the exten-sive efforts to standardise interview and coding had the in-tended effect. Regardless, dietary interviewer, and dietary interviewer-method interactions, contributed significant-ly to differences between method versions for food groups, and for energy and several unadjusted nutrient in-takes. Most of these effects seemed to disappear either with energy-adjustment, or with additional variables in-cluded in the models. Therefore, the influence of dietary interviewers appears to depend on personal characteristic of study-participants.
Overall conclusions
die-tary data (when examined under carefully controlled situ-ations) appear possible without substantial impact on the ranking ability or mean nutrient intake levels. However, as has been discussed, Study I could not assess the total impact of altered routines. Study II, which used "real world" data collected during the baseline examinations, examined mean dietary estimates before and after the al-teration of routines. The latter study suggests that future descriptive studies using the MDC data should preferably select subsets of the population assessed with either meth-od version to avoid distortion of observed intakes. De-pending on the specific research question, adjustment in analysis for year and season of data collection, and dietary interviewer may need to be considered. However, the im-pact of altered interview routines on the outcome of ana-lytical studies probably is small. Although, the impact of dietary data collection procedures on risk estimates of dis-ease in the MDC study is not yet evaluated, Study II sug-gests that method version and dietary interviewer explained a very small proportion of total variation. Meth-od version differences between cases and non-cases need, however, to be monitored.
List of abbreviations
MDC Malmö Diet and Cancer
EI/BMR Ratio of Energy Intake to Basal Metabolic Rate
BMR Basal Metabolic Rate
FAO/WHO/UNU Food and Agricultural Organization/ World Health Organization/United Nations University
SFA saturated fatty acids
MUFA monounsaturated fatty acids
PUFA polyunsaturated fatty acids
18:2 linoleic acid
18:3 linolenic acids
EPA eicosapentaenoic acid
kcal kilocalories
g grams
ug micrograms
mg milligrams
SD Standard Deviation
FFQ Food Frequency Questionnaire
BMI Body Mass Index
WHR Waist Hip Ratio
Competing interests
Competing interests: none declared.
Authors' contributions
Elisabet Wirfält, who is the main author and initiator of this paper, designed and implemented the analyses of Study II; Irene Mattisson and Ulla Johansson who were re-sponsible for the dietary data collection of the Malmö Diet and Cancer study, designed and implemented the di-etary method development described in Study I; Bo Gull-berg provided analytical support and statistical advice; Peter Wallström provided constructive advice; Göran Ber-glund is the principal investigator of the Malmö Diet and Cancer Study.
Appendix 1. List of dishes/foods included in
dif-ferent test
Standard portion-sizes
The effect of standard portion size was first analysed sep-arately for each of the four groups, and then the effect of all groups was estimated.
Group 1: Pickled vegetables, boiled legumes, salads as main dish, shellfish, smoked fish, black-pudding/black sausage, fried potato dishes, egg dishes, porridge, pasta sauce, fast food, cakes, dressing, condiments, smoked meat, gratin/pudding, soufflé, pizza.
Group 2: Corn on the cob, tomato (preserved), artichoke, garlic, avocado, tomato, sweet pepper, onion/leek, dill/ parsley/chive, salads with mayonnaise (as side dish), fried vegetables, pickled herring, bacon, spareribs, pork bone, chicken, liver, pigs trotters, snails, cold sauces, stewed macaroni.
Group 3:Desserts
Group 4: Rice, pasta, mashed potatoes, French fries, fried potatoes, mashed turnips.
Simplified coding
The effect of simplified coding was first analysed separate-ly for each of the six groups, and then the effect of all groups was estimated.
potato dishes, porridge, pasta sauce, pie, pate/mousse, crepes, pirogues, pizza, miscellaneous small dishes.
Group 2: Desserts, puddings, gratins, complete dishes, sal-ad as main dish.
Group 3: Sauces
Group 4: Soups
Group 5: Casseroles
Group 6: Minced meat dishes (if not already tested in group 1–5)
Acknowledgements
The authors wish to acknowledge the funding support received from the Swedish Cancer Society, the Swedish Medical Research Council, the Euro-pean Commission, and the City of Malmö.
References
1. Dwyer JT Assessment of dietary intake.In: odern nutrition in health and disease(Edited by: Shils ME, Olson JA, Shike M) Philadelphia, Lea & Febiger 1994, 842-860
2. Margetts BM and Nelson M Design Concepts in Nutritional Epi-demiology.Oxford New York Tokyo, Oxford University Press Oxford Medical Publications 1997,
3. Willett W Nutritional Epidemiology.Monographs in Epidemiology and BiostatisticsNew York Oxford, Oxford University Press 1998, 30: 101-147
4. Flegal KM and Larkin FA Partitioning Macronutrient Intake Es-timates from a Food Frequency Questionnaire.Am J Epidemiol
1990, 131:1046-1058
5. Flegal KM, Larkin FA, Metzner HL, Thompson FE and Guire KE Counting Calories: Partitioning Energy Intake Estimates from a Food Frequency Questionnaire.Am J Epidemiol 1988, 128:749-760
6. Hunter DJ, Sampson L, Stampfer MJ, Colditz GA, Rosner B and Wil-lett WC Variability in portion sizes of commonly consumed foods among a population of women in the United States.Am J Epidemiol 1988, 127:1240-1249
7. Braam LA, Ocké MC, Bueno-de-Mesquita HB and Seidell JC Deter-minants of obesity-related underreporting of energy intake.
Am J Epidemiol 1998, 147:1081-1086
8. Lafay L, Basdevant A, Charles M, Vray M, Balkau B, Borys JM, Eschwège E and Romon M Determinants and nature of dietary underreporting in a free-living population:the Fleurbaix Laventie Ville Santé (FLVS) study.Int J Obes Relat Metab Disord
1997, 21:567-573
9. Willett WC and Stampfer MJ Total energy intake: Implications for epidemiologic analysis.Am J Epidemiol 1986, 124:17-27 10. Pryer JA, Vrijheid M, Nichols R, Kiggins M and Elliott P Who are the
"Low Energy Reporters" in the Dietary and Nutritional Sur-vey of British Adults?Int J Epidemiol 1997, 26:146-154
11. Klesges RC, Eck LH and Ray JW Who underreports dietary in-take in a dietary recall? Evidence from the second National Health and Nutrition Examination Survey.J Consult Clin Psychol
1995, 63:438-444
12. Stallone DD, Brunner EJ and Bingham S Dietary Assessment in Whitehall II: The influence of reporting bias on apparent so-cioeconomic variation in nutrient intakes.Eur J Clin Nutr 1997, 51:1-11
13. Liu K, Slattery M, Jacobs D, Cutter D, Mcdonald A, Van Horn L, Hilner J, Caan B, Bragg C and Dyer A A study of the reliability and comparability of the CARDIA dietary history.Ethn Dis 1994, 4:15-27
14. Wirfält AKE, Pettersson U, Andrén C and Mattisson I Fat on bread: An evaluation of photographic aids in portionsize estima-tion.Eur J Clin Nutr 1998, 52(Supplement 2):S30
15. Helsing E Trends in fat consumption in Europe and their influ-ence on the Mediterranean diet.Eur J Clin Nutr 1993, 47:S4-S12 16. Senauer B, Asp E and Kinsey J Food trends and the changing
con-sumer.St. Paul MN, Eagan Press 1993,
17. Kromhout D, de Lezenne-Coulander C, Obermann de Boer GL, van Kampen Donker M, Goddijn E and Bloemberg BP Changes in food and nutrient intake in middle-aged men from 1960 to 1985 (the Zutphen Study).Am J Clin Nutr 1990, 51:123-129
18. Mullenbach V, Kushi LH, Jacobson C, Gomez-Martin O, Prineas RJ, Roth-Yousey L and Sinaiko A Comparison of 3-day food record and 24-hour recall by telephone for dietary evaluation in ad-olescencents.J Am Dietet Assoc 1992, 92:743-745
19. Fanelli MT and Stevenhagen KJ Consistency of energy and nutri-ent intakes of older adults: 24-hour recall vs. 1-day food record.J Am Dietet Assoc 1986, 86:665-667
20. Goldberg GR, Black AE, Jebb SA, Cole TJ, Murgatroyd PR, Coward WA and Prentice A Critical evaluation of energy intake data using fundamental principles of energy physiology: 1. Deriva-tion of cut-off limits to identify under-recording.Eur J Clin Nutr
1991, 45:569-581
21. Mertz W, Tsui JC, Judd JT, Reiser S, Hallfrisch J, Morris ER, Steele P and Lashley E What are people really eating? The relation be-tween energy intake derived from estimated diet records and intake determined to maintain body weight.Am J Clin Nutr
1991, 54:291-295
22. Wolk A, Bergström R, Adami H-O, Ohlander E-M, Bruce Å, Holm-berg L and Bergkvist L Self-administered food frequency ques-tionnaire:the effect of different designs on food and nutrient intake estimates.Int J Epidemiol 1994, 23:570-576
23. Mahalko JR, Johnson L-AK, Gallagher SK and Milne DB Comparison of dietary histories and seven-day food records in a nutrition-al assessment of older adults.Am J Clin Nutr 1985, 42:542-553 24. Madden JP, Goodman SJ and Guthrie HA Validity of the 24-hour
recall. Analysis of data obtained from elderly subjects.J Am Dietet Assoc 1976, 68:143-147
25. Carter RL, Sharbaugh CO and Stapell CA Reliability and validity of the 24-hour recall.J Am Dietet Assoc 1981, 79:542-547 26. Gersovitz M, Madden JP and Smiciklas-Wright H Validity of the
24-hr. dietary recall and seven-day record of group compari-sons.J Am Dietet Assoc 1978, 73:48-55
27. Fries E, Green P and Bowen DJ What did I eat yesterday? Deter-minants of accuracy in 24-hour food memories.App Cogn Psy-chol 1995, 9:143-155
28. Sempos CT Invited Commentary: some limitations of semi-quantitative food frequency questionnaires. Am J Epidemiol
1992, 135:1127-1132
29. WCRF/AICR and Potter JD Food, Nutrition and the Prevention of Cancer:a Global Perspective.Washington DC, World Cancer Re-search Fund/American Insitute for Cancer ReRe-search 1997,
30. Mullen BJ, Krantzler NJ, Grivetti LE, Schutz HG and Meiselman HL Validity of a food frequency questionnaire for the determina-tion of individual food intake.Am J Clin Nutr 1984, 39:136-143 31. Gibson RS Sources of error and variability in dietary
assess-ment methods: A review.J Can Dietet Assoc 1987, 48:150-155 32. Livingstone MB Assessment of food intakes: are we measuring
what people eat?Br J Biomed Sci 1995, 52:58-67
33. Taylor HL, Jacobs DR Jr, Schucker B, Knudsen J, Leon AS and Deback-er G A questionnaire for the assessment of leisure time phys-ical activities.J Chronic Dis 1978, 31:741-755
34. Norusis MJ SPSS for Windows Professional StatisticsRelease 6.0. Chicago IL, SPSS Inc 1993,
35. Montgomery DC Design and analysis of experimentsNew York, John Wiley & Sons 1991,
36. Riboli E, Elmståhl S, Saracci R, Gullberg B and Lindgärde F The Malmö Food Study: Validity of Two Dietary Assessment Methods for Measuring Nutrient Intake.Int J Epidemiol 1997, 26:S161-S173
37. Boyd NF, Martin M, Noffel GA, Lockwood GA and Trichler DL A meta-analysis of studies of dietary fat and breast cancer risk.
Br J Cancer 1993, 68:627-636
38. Prentice RL Measurement Error and Results From analytic Epidemiology: Dietary Fat and Breast Cancer.J Natl Cancer Inst
1996, 88:1738-1747
Publish with BioMed Central and every scientist can read your work free of charge "BioMed Central will be the most significant development for disseminating the results of biomedical researc h in our lifetime."
Sir Paul Nurse, Cancer Research UK
Your research papers will be:
available free of charge to the entire biomedical community
peer reviewed and published immediately upon acceptance
cited in PubMed and archived on PubMed Central
yours — you keep the copyright
Submit your manuscript here:
http://www.biomedcentral.com/info/publishing_adv.asp
BioMedcentral
40. Liu K, Stamler J, Dyer A, McKeever J and McKeever P Statistical Methods to Assess and Minimize the Role of Intra-Individual Variability in Obscuring the Relationship Between Dietary Lipids and Serum Cholesterol.J Chronic Dis 1978, 31:399-418 41. Beaton GH, Burema J and Ritenbaugh C Errors in the
interpreta-tion of dietary assessments. Am J Clin Nutr 1997, 65(sup-pl):1100S-1107S
42. Freedman LS Challenges for statistical approaches to dietary assessment.Eur J Clin Nutr 1998, 52:S6
43. Nelson M, Atkinson M and Darbyshire S Food photography II: Use of food photographs for estimating portion size and the nu-trient content of meals.Br J Nutr 1996, 76:31-49
44. Schwartz N, Bless H, Bohner G and Harlacher U Response scales as frames of reference:the impact of frequency range on di-agnostic judgements.Appl Cogn Psychol 1991, 5:37-49
45. Fischer RP and Quigley KL Applying Cognitive Theory in Public Health Investigations: Enhancing Food Recall with the Cog-nitive Interview.In Questions about questions. Inquiries into the cogni-tive basis of surveys (Edited by: Tanur JM) New York, Russel Sage Foundation 1992, 154-169
46. Ervin RB and Smiciklas-Wright H Using encoding and retrieval strategies to improve 24-hour dietary recalls among older adults.J Am Diet Assoc 1998, 98:989-994
47. Boutron MC, Faivre J, Milan C, Lorcerie B and Esteve J A compari-son of two diet history questionnaires that measure usual food intake.Nutr Cancer 1989, 12:83-91
48. Subar AF, Frey CM, Harlan LC and Kahle L Differences in Report-ed Food Frequency by Season of Quetionnaire Administra-tion: The 1987 National Health Interview Survey.Epidemiology
1994, 5:226-233
49. Johansson L, Solvoll K, Björneboe G-EA and Drevon CA Under-and overreporting of energy intake related to weight status and lifestyle in a nationwide sample.Am J Clin Nutr 1998, 68:266-274 50. Kromhout D and Bloemberg BPM Methods in nutritional epide-miology.In Coronary Heart Disease Epidemiology From Aetiology to Pub-lic HealthOxford New York Toronto Melbourne, Oxford University Press
1992, 140-151
51. Hebert JR, Yunsheng M, Clemow L, Ockene IS, Saperia G, Stanek EJ III, Merriman P and Ockene J Gender differences in social desir-ability and social approval bias in dietary self-report.Am J Ep-idemiol 1997, 146:1046-1055