R E S E A R C H
Open Access
High-performing farms exploit reproductive
potential of high and low prolific sows
better than low-performing farms
Satomi Tani
1, Carlos Piñeiro
2and Yuzo Koketsu
1*Abstract
Background:Our objective was to examine the impact of farm effects and sow potential on various aspects of sow performance. We examined the interaction between sow prolificacy groups categorized at parity 1 and farm productivity groups for reproductive performance across parities, and lifetime performance. Data included 419,290 service records of 85,096 sows, on 98 Spanish farms, from first-service as gilts to removal, that were served between 2008 and 2013. Farms were categorized into three productivity groups based on the upper and lower 25th
percentiles of the farm means of annualized lifetime piglets weaned per sow over the 6 years: high-performing (HP), intermediate-performing (IP), and low-performing (LP) farms. Also, parity 1 sows were categorized into three groups based on the upper and lower 10th percentiles of piglets born alive (PBA) as follows: 15 piglets or more (H-prolific), 8 to 14 piglets, and 7 piglets or fewer (L-prolific). The farm groups represent farm effects, whereas the sow groups represent sow potential. Linear mixed effects models were performed with factorial arrangements and repeated measures.
Results:Mean parity at removal (4.8 ± 0.01) was not associated with three farm productivity groups (P= 0.43). However, HP farms had 7.7% higher farrowing rates than LP farms (P< 0.05). As a result, H-prolific and L-prolific sows on HP farms had 29.7 and 30.7 fewer non-productive days during lifetime than the respective sows on LP farms (P< 0.05). Furthermore, the H-prolific and L-prolific sows on HP farms had 4.9 and 6.2 more annualized piglets weaned than respective H-prolific and L-prolific sows on LP farms (P< 0.05), which was achieved by giving birth to 0.8–1.0 and 1.4–1.7 more PBA per litter, respectively, than on HP farms during parities 2–6 (P< 0.05). During the first parity, HP farms had 18.8% H-prolific sows compared to 6.2% on LP farms.
Conclusion:Farm effects substantially affected lifetime performance of sows. Higher lifetime productivity of sows on HP farms was achieved by higher farrowing rate, fewer non-productive days, more PBA and more piglets weaned per sow, regardless of prolific category of the sows.
Keywords:Farm effect, High-performing farms, High prolific sows, Lifetime performance, Sow potential
Background
Prolificacy performance, such as the number of pig-lets born alive (PBA), appears to differ between indi-vidual sows due to the extent of genetic improvement and farm management [1]. Studies in Japan, Europe, and the U.S.A. have shown that the most prolific sows, categorized by PBA at parity 1, produce 0.5–1.8 more PBA from parities 2 to 6 and 1.4–26.0 more
lifetime PBA than other sows [2–4]. However, repro-ductive performance varies between individual sows on a farm, and it is important to maximize the life-time reproductive performance of all sows in order to decrease production costs and economic wastefulness on the farms [5]. Also, a study of high-performing (HP) farms in the U.S.A., categorized by herd repro-ductive productivity, showed that they had 9.0% higher farrowing rates, and 0.6 more PBA than ordin-ary farms [6]. The high productivity of HP farms is attributable to better replacement gilt development [7], better breeding management [8], more advanced * Correspondence:[email protected]
1School of Agriculture, Meiji University, Higashi-mita 1-1-1, Tama-ku,
Kawasaki, Kanagawa 214-8571, Japan
Full list of author information is available at the end of the article
technologies [9, 10] and better piglet care during lac-tation [11, 12]. These studies have shown that HP farms appear to exploit sows’ reproductive potential better than ordinary farms. Therefore, we have hy-pothesized that high prolific (H-prolific) and low pro-lific (L-propro-lific) sows on HP farms perform differently from equivalent sows on intermediate-performing (IP) or low-performing (LP) farms. It is useful for veteri-narians and producers to know a quantified associ-ation between sows’ potential and farm effects for reproductive performance across parities and lifetime performance of sows. Therefore, the objective of the present study was to examine the interaction between sow prolificacy groups and farm productivity groups for reproductive performance in consecutive parities, and lifetime performance of H-prolific and L-prolific sows. The farm groups represent farm effects, whereas the sow groups represent sow potential.
Methods
Studied farms and data selection
A consultancy firm (PigCHAMP pro Europa S.L. Segovia, Spain) has annually requested all client pro-ducers to mail their data files since 1998. In 2013, 98 Spanish farms allowed their farm data to be used for research purposes. Our study database included ap-proximately 0.5% of all Spanish pig breeding farms and approximately 4% of all gilts and sows. Spain is one of the major pig producing countries in Europe, with 19,630 breeding farms and 2,568,450 breeding pigs, in December of 2013, accounting for 20% of breeding pigs in the 28 EU countries [13].
The mean (± SEM) size of the studied farms was 699 ± 64.3 sows with a range between 81 and 3222 sows. The study herds increased in size by 14.2% over the 6 years when data were collected. These 98 farms use mechanical or natural ventilation systems in their farrowing, breeding and gestation barns. The lactation and gestation diets were formulated using cereals (barley, wheat and corn) and soybean meal. Also, all the farms use artificial insemination, with double or triple inseminations of sows during an estrous period. Replacement gilts on the 98 farms are either
pur-chased from breeding companies or are
home-produced through their internal multiplication programs. These farms’ data were also used for an-other study to examine risk factors associated with severe repeat-breeder sows [14].
Study design, data collection and exclusion criteria The present study was designed as a retrospective co-hort study coordinating by-parity service records and
subsequent reproductive data in sows, from
first-service of gilts to their removal. The data
included 554,755 service records of sows served on the 98 farms from January 2008 to June 2013. Data from the PigCHAMP recording system were collected for 99,533 sows entered into the farms between 2008 and 2010. When the data were collected, 4842 (4.8%) of the sows had not yet been removed from the farms, so these records were excluded. Also, lifetime records were excluded if they met any of the follow-ing criteria (99th percentile): lifetime non-productive days of 290 days or more (949 sows); lifetime PBA of 130 piglets or more (857 sows), 104 or more lifetime piglets weaned (914 sows), and gilt records of removal at parity 0 (6875 gilts). Additional exclusions were made for no records of gilt age at first-mating (3477 gilts) or records with either less than 160 days (1435 gilts) or more than 400 days (1300 gilts; [15]) when age at first service was analyzed. Parity records of sows in parity 7 or higher were omitted for by-parity reproductive performance analyses (18,264 records), but were included in analysis of lifetime performance. Thus, the studied data for datasets 1 and 2 contained 419,290 first-served records of 85,096 sows on the 98 farms.
Datasets 1 and 2 were created for analyses of by-parity reproductive performance and lifetime performance, re-spectively. In Dataset 1, service records were regarded as missing records if they met any of the following criteria; more than 26 PBA (1 record), more than 26 piglets weaned (50 records), more than 35 days of weaning-to-first-mating interval (3420 records), and re-service inter-val of either less than 11 days or more than 150 days (401 records).
Categories and definitions
Farms were categorized into three groups based on the upper and lower 25th percentiles of the farm means of annualized lifetime piglets weaned per sow: HP farms (> 24.7 piglets), IP farms (24.7 to 21.2 pig-lets), and LP farms (< 21.2 piglets). Also, sows were categorized into three groups based on the upper and lower 10th percentiles of PBA at parity 1: H-prolific (15 piglets or more), I-prolific (8 to 14 piglets), and L-prolific (7 piglets or fewer) sows.
Statistical analysis
All statistical analyses were conducted using SAS version 9.3 (SAS Institute Inc., Cary, NC, U.S.A.). A chi-square test was conducted using SAS software to compare the relative frequencies (%) of sow groups in the different farm productivity groups. Two statistical models were created: Model 1 was applied to Dataset 1 with a 3 × 3 × 6 factorial arrangement design with repeated measures. The analysis was conducted using the three sow groups, three farm groups, six parity groups, and entry years as fixed effects for reproductive performance. Model 1 also examined possible 2- or 3-way interactions. Also, Model 2 was applied to Dataset 2 with a 3 × 3 factorial arrangement, with fixed effects being the three sow groups, three farm groups and entry years. Model 2 also examined possible 2-way interactions.
For continuous outcomes, linear mixed effects models were used to account for the clustering of sows within a farm (MIXED, random statement) or the correlation between repeated measures in the same sow within a farm (MIXED, repeated statement). For binary outcomes, a generalized mixed effects lo-gistic regression model was used with a logit link function in individual parity records (for whether or not a sow farrowed, 1 or 0: farrowing rate). This model was used to account for the clustering of sows within a farm (GLIMMIX, random statement), and the correlation between repeated measures in the same female pig within a farm (GLIMMIX, random_-residual_statement). Additionally, if the 3-way interac-tions between the sow, farm and parity groups were found significant, then we also separately examined 2-way interactions between the farm groups and par-ity groups for either H-prolific or L-prolific sows. Pairwise multiple comparisons were performed by using the Tukey-Kramer test. All significance levels were set at P< 0.05. Also, a random farm effect was included in all the models.
Intraclass correlation coefficients
The intraclass correlation coefficient (ICC) was calcu-lated by the following equations to assess the variance in the reproductive performance that could be explained by the farms, and also the variance in reproductive per-formance across parities that could be explained by the sow effect [17],
ICCðindividual records within the same farm but
different sowsÞfor continuous outcomes
¼σ2
v= σ2vþσ2ε
;
ICC individual parity records within the same sowð Þ
for continuous outcomes
¼ σ2
vþσ2u
= σ2
vþσ2uþσ2ε
;
ICCðindividual records within the same farm but
different sowsÞfor binary outcomes
¼σ2
v= σ2vþπ2=3
;
ICC individual parity records within the same sowð Þ
for binary outcomes
¼ σ2
vþσ2u
= σ2
vþσ2uþπ2=3
;
in which σ2
v is the between-farm variance, σ2u is the
between-sow variance, and σ2
ε or π2/3 is the assumed
variance at the individual record level.
Results
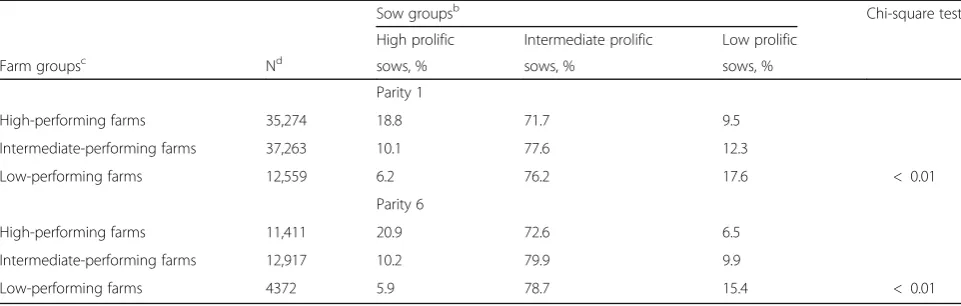
Descriptive statistics of lifetime performance and by-parity reproductive performance of sows are shown in Table 1. The proportions of H-, I- and L-prolific sows at parities 1 and 6 differed between the three farm groups (P< 0.05; Table2). In parity 1, HP farms had 18.8% H-prolific sows and 9.5% L-prolific sows, whereas LP farms had 6.2% H-prolific sows and 17.6% L-prolific sows. Also, in parity 6 there were 20.9% H-prolific sows and 6.5% L-prolific sows on HP farms, compared with 5.9 and 15.4%, respectively on LP farms.
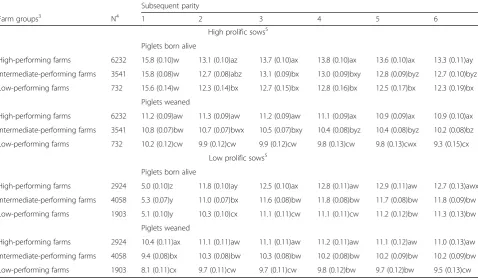
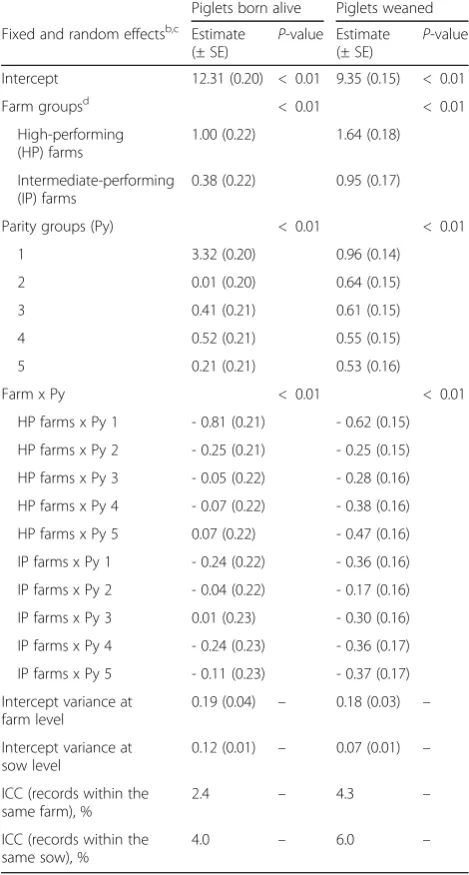
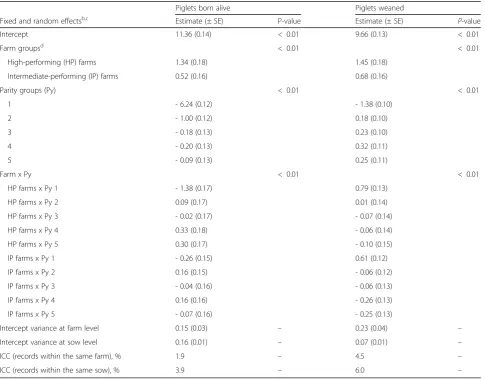
There were three significant main effects, namely sow groups, farm groups and parity groups with 2-way and 3-way interactions between the groups for both PBA and the number of piglets weaned (P< 0.01). Also, there were 2-way interactions between the farm groups and parity groups for PBA and the number of piglets weaned for both H-prolific and L-prolific sows in both dataset models (P< 0.01;Appendixes AandB).
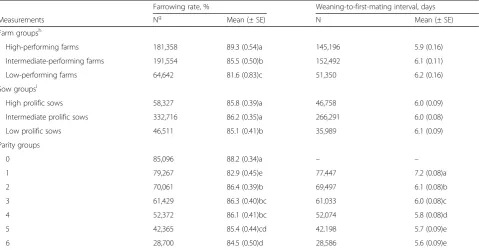
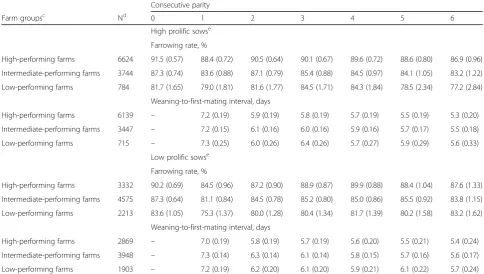
There were three significant main effects for farrow-ing rate, namely sow groups, farm groups and parity groups, namely sow groups, farm groups and parity groups, as well as a 2-way interaction between sow groups and parity groups (P< 0.01; Appendix C). For weaning-to-first-mating interval, there was an associ-ation with parity (P< 0.05), but not with either sow groups or farm groups (P≥0.45). Additionally, there were no 2- or 3-way interactions between these three factors for weaning-to-first-mating interval (P≥0.05). Appendix D shows the mean values of reproductive
performance in consecutive parities of the H-prolific and L-prolific sows in the three farm productivity groups. With regard to the ICC, the random herd and sow effects explained 1.9–6.0% of the total vari-ance for reproductive performvari-ance.
Table 4 shows comparisons between the three fac-tors for farrowing rates and weaning-to-first-mating interval. There were no differences between any of the sow groups or between any of the farm groups for weaning-to-first-mating interval. Regarding farrow-ing rate, HP farms had 7.7% higher farrowfarrow-ing rates
Table 1Reproductive data for sows on 98 farms
Range
N Mean ± SEM Minimum Maximum
Lifetime performance measurements
Number of parity at removal 85,096 4.8 ± 0.01 1 11
Gilt age at first-mating, days olda 78,884 251.3 ± 0.15 160 400
Lifetime number of piglets born alive 85,096 57.3 ± 0.11 0 129
Lifetime number of piglets weaned 85,096 49.9 ± 0.09 0 103
Annualized lifetime piglets weaned per sow 85,096 23.9 ± 0.02 0 74c
Lifetime non-productive days 85,096 84.8 ± 0.17 0 289
Parity performance measurements
Parity 419,290 2.4 ± 0.01 0 6
Number of piglets born aliveb 352,457 12.0 ± 0.01 0 26
Number of piglets weanedb 352,408 10.5 ± 0.01 0 26
Lactation length, daysb 348,032 23.5 ± 0.01 14 41
Weaning-to-first-mating interval, daysb 349,038 5.9 ± 0.01 0 35
Re-service interval, days 37,617 37.5 ± 0.14 11 150
a
The remaining records (85,096-N) were regarded as missing records
b
The remaining records (419,290-N) were regarded as missing records
c
This is a value based on the maximum number of piglets weaned by a sow in parity 1, adjusted to an annualized equivalent (some sows were culled at parity 1, meaning that there are no subsequent data for parity 2 or higher)
Table 2By-parity relative frequencies (%) of farm groups in three sow groups categorized by piglets born alive in parity 1a
Sow groupsb Chi-square test
High prolific Intermediate prolific Low prolific
Farm groupsc Nd sows, % sows, % sows, %
Parity 1
High-performing farms 35,274 18.8 71.7 9.5
Intermediate-performing farms 37,263 10.1 77.6 12.3
Low-performing farms 12,559 6.2 76.2 17.6 < 0.01
Parity 6
High-performing farms 11,411 20.9 72.6 6.5
Intermediate-performing farms 12,917 10.2 79.9 9.9
Low-performing farms 4372 5.9 78.7 15.4 < 0.01
a
Frequencies within a row add up to 100%
b
Groups based on the upper and lower 10th percentiles of piglets born alive in parity 1: High (15 piglets or more); Intermediate (8 to 14 piglets) and Low (7 piglets or fewer) prolific sows
c
Categorized by farm means of the upper and lower 25th percentiles of annualized lifetime piglets weaned per sow over 6 years: High- (> 24.7 pigs); Intermediate- (24.7 to 21.2 piglets) and Low- (< 21.2 piglets) performing farms
d
than LP farms, whereas H-prolific sows had 0.7% higher farrowing rates than L-prolific sows (P< 0.05). Additionally, Table 5 shows comparisons of farrowing rates between the parity groups for different sow groups. In parities 1 and 2, farrowing rates were 2.7– 3.5% higher in H-prolific sows than in L-prolific sows in all the farm groups, but there were no differences between the sow groups for farrowing rates in parities 3 and 6 (P≥0.05).
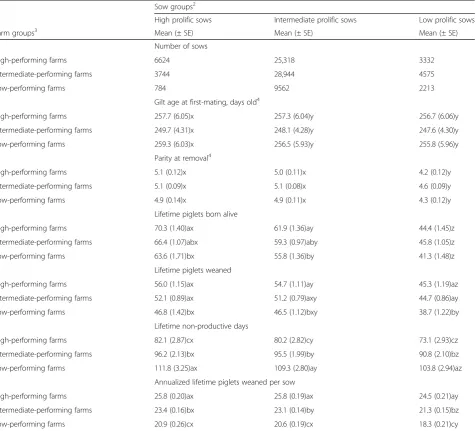
Table 6 shows comparisons of lifetime performance between the three sow groups and three farm groups. There were 2-way interactions between the sow groups and farm groups for lifetime PBA, lifetime piglets weaned and annualized lifetime piglets weaned (P< 0.05). Across the farm groups, H-prolific sows had 20.6–25.9 more lifetime PBA (45–58% more) than L-prolific sows, whereas across the sow groups HP farms had 6.1–6.7 more lifetime PBA (7–11% more) than LP farms (P< 0.05). In contrast, the dif-ferences between HP farms and LP farms for annual-ized lifetime piglets weaned was greater than the differences between H-prolific sows and L-prolific
sows. In detail, across sow groups HP farms had 4.9– 6.2 more annualized lifetime piglets weaned (23–34% more) than LP farms. Meanwhile, across farm groups H-prolific sows had 1.3–2.6 more annualized lifetime piglets weaned (5–14% more) than L-prolific sows. The largest difference was between L-prolific sows on HP farms and LP farms. Additionally, across the sow groups, HP farms had 29.7–30.7 fewer lifetime non-productive days (27–30% fewer) than LP farms, whereas across the farm groups H-prolific sows had 5.4–9.0 more lifetime non-productive days (6–12% more) than L-prolific sows.
There were significant main effects of sow groups on age at first service and the number of parity at removal (P< 0.05), but no effect of farm groups (P= 0.35 for age at first service; P= 0.44 for parity at removal). Further-more, there were no 2-way interactions for age at first service, the number of parity at removal or lifetime non-productive days (P≥0.05). For example, there were no differences between farm groups for age at first ser-vice or number of parity at culling, but H-prolific sows had 1.0–3.5 days greater age at first service and 0.5–0.9
Table 3Comparisons of reproductive performance of sows during the first parity compared with the subsequent five parities in high, intermediate and low-performing farms of either high prolific or low prolific sows1, 2
Subsequent parity
Farm groups3 N4 1 2 3 4 5 6
High prolific sows5
Piglets born alive
High-performing farms 6232 15.8 (0.10)w 13.1 (0.10)az 13.7 (0.10)ax 13.8 (0.10)ax 13.6 (0.10)ax 13.3 (0.11)ay
Intermediate-performing farms 3541 15.8 (0.08)w 12.7 (0.08)abz 13.1 (0.09)bx 13.0 (0.09)bxy 12.8 (0.09)byz 12.7 (0.10)byz
Low-performing farms 732 15.6 (0.14)w 12.3 (0.14)bx 12.7 (0.15)bx 12.8 (0.16)bx 12.5 (0.17)bx 12.3 (0.19)bx
Piglets weaned
High-performing farms 6232 11.2 (0.09)aw 11.3 (0.09)aw 11.2 (0.09)aw 11.1 (0.09)ax 10.9 (0.09)ax 10.9 (0.10)ax
Intermediate-performing farms 3541 10.8 (0.07)bw 10.7 (0.07)bwx 10.5 (0.07)bxy 10.4 (0.08)byz 10.4 (0.08)byz 10.2 (0.08)bz
Low-performing farms 732 10.2 (0.12)cw 9.9 (0.12)cw 9.9 (0.12)cw 9.8 (0.13)cw 9.8 (0.13)cwx 9.3 (0.15)cx
Low prolific sows5
Piglets born alive
High-performing farms 2924 5.0 (0.10)z 11.8 (0.10)ay 12.5 (0.10)ax 12.8 (0.11)aw 12.9 (0.11)aw 12.7 (0.13)awx
Intermediate-performing farms 4058 5.3 (0.07)y 11.0 (0.07)bx 11.6 (0.08)bw 11.8 (0.08)bw 11.7 (0.08)bw 11.8 (0.09)bw
Low-performing farms 1903 5.1 (0.10)y 10.3 (0.10)cx 11.1 (0.11)cw 11.1 (0.11)cw 11.2 (0.12)bw 11.3 (0.13)bw
Piglets weaned
High-performing farms 2924 10.4 (0.11)ax 11.1 (0.11)aw 11.1 (0.11)aw 11.2 (0.11)aw 11.1 (0.12)aw 11.0 (0.13)aw
Intermediate-performing farms 4058 9.4 (0.08)bx 10.3 (0.08)bw 10.3 (0.08)bw 10.2 (0.08)bw 10.2 (0.09)bw 10.2 (0.09)bw
Low-performing farms 1903 8.1 (0.11)cx 9.7 (0.11)cw 9.7 (0.11)cw 9.8 (0.12)bw 9.7 (0.12)bw 9.5 (0.13)cw a-c
Different superscripts within a column represent significant differences in means (P≤0.03)
w-z
Different superscripts within a row represent significant differences in means (P≤0.03)
1
Means and SE were estimated by mixed models
2
There were no differences between the farm groups in any parity for weaning-to-first-mating interval and farrowing rate (P≥0.05)
3
Categorized by farm means of the upper and lower 25th percentiles of annualized lifetime piglets weaned per sow over 6 years: high- (> 24.7 piglets); intermediate- (24.7 to 21.2 piglets) and low- (< 21.2 piglets) performing farms
4
N represents the initial number of sows
5
higher number of parity at removal than L-prolific sows across the farm groups.
Discussion
Our study showed that different farm effects could alter sows’ reproductive potential across parities and lifetime performance of sows. Also, our study indicated that farm effects were greater than sow potential on farrowing rates, non-productive sow days and annualized lifetime piglets weaned, but that sow potential had a greater ef-fect than farm efef-fects on lifetime PBA. Additionally, the 6–15% more PBA across sow groups after parity 1 on HP farms than on LP farms indicates that PBA was not
only affected by sow potential, but also by farm effects. In particular, L-prolific sows on HP farms had 12% or more PBA and piglets weaned than L-prolific sows on LP farms, suggesting that HP farms are better than LP farms at exploiting the potential of L-prolific sows.
In addition, our study showed that farrowing rates were 7.7% higher on HP farms than on LP farms, but that farrowing rates were only 0.7% higher in H-prolific sows than in L-prolific sows. This result clearly shows that farm effects had at least 10 times greater impact on farrowing rates than sows’potential. These farm effects probably include better insemination timing, more ad-vanced technologies [9, 10], better care in the breeding
Table 4Comparisons between factors for farrowing rates and for weaning-to-first-mating intervalsf
Farrowing rate, % Weaning-to-first-mating interval, days
Measurements Ng Mean (± SE) N Mean (± SE)
Farm groupsh
High-performing farms 181,358 89.3 (0.54)a 145,196 5.9 (0.16)
Intermediate-performing farms 191,554 85.5 (0.50)b 152,492 6.1 (0.11)
Low-performing farms 64,642 81.6 (0.83)c 51,350 6.2 (0.16)
Sow groupsi
High prolific sows 58,327 85.8 (0.39)a 46,758 6.0 (0.09)
Intermediate prolific sows 332,716 86.2 (0.35)a 266,291 6.0 (0.08)
Low prolific sows 46,511 85.1 (0.41)b 35,989 6.1 (0.09)
Parity groups
0 85,096 88.2 (0.34)a – –
1 79,267 82.9 (0.45)e 77,447 7.2 (0.08)a
2 70,061 86.4 (0.39)b 69,497 6.1 (0.08)b
3 61,429 86.3 (0.40)bc 61,033 6.0 (0.08)c
4 52,372 86.1 (0.41)bc 52,074 5.8 (0.08)d
5 42,365 85.4 (0.44)cd 42,198 5.7 (0.09)e
6 28,700 84.5 (0.50)d 28,586 5.6 (0.09)e
a-e
Different superscripts within a column represent significant differences in means (P≤0.01)
f
Means and SE were estimated by mixed models
g
N represents the number of parity record
h
Categorized by farm means of the upper and lower 25th percentiles of annualized lifetime piglets weaned per sow over 6 years: High- (> 24.7 piglets); Intermediate- (24.7 to 21.2 piglets) and Low- (< 21.2 piglets) performing farms
i
Groups based on the upper and lower 10th percentiles of pigs born alive in parity 1: High (15 piglets or more); Intermediate (8 to 14 piglets) and Low (7 piglets or fewer) prolific sows
Table 5Comparisons of farrowing rates (%) between the three sow groups in subsequent parities1
Subsequent parity
0 1 2 3 4 5 6
Sow groups2 N3 Mean (± SE), %
High prolific sows 11,152 87.9 (0.45)bv 84.3 (0.54)ay 87.3 (0.49)avw 86.7 (0.52)vwx 86.0 (0.57)wxy 84.8 (0.63)xy 83.3 (0.75)y
Intermediate prolific sows 63,824 89.2 (0.31)av 83.5 (0.43)az 87.0 (0.36)aw 86.6 (0.37)wx 86.2 (0.39)x 85.7 (0.41)xy 84.9 (0.45)y
Low prolific sows 10,120 87.4 (0.46)bv 80.8 (0.62)bx 84.6 (0.56)bw 85.6 (0.57)vw 86.1 (0.59)vw 85.6 (0.66)vw 85.3 (0.78)vw
a, b
Different superscripts within a column represent significant differences in means (P< 0.01)
v-z
Different superscripts within a row represent significant differences in means (P< 0.01)
1
Means and SE were estimated by mixed models
2
Groups based on the upper and lower 10th percentiles of piglets born alive in parity 1: High (15 piglets or more); Intermediate (8 to 14 piglets); Low (7 piglets or fewer) prolific sows
3
phase [18] and a stricter culling policy [19] on HP farms than on LP farms.
The approximately 27–30% fewer lifetime non-product-ive days across sow groups on the HP farms than on the LP farms indicates that HP farms could decrease non-productive days not just by having sows with better potential, but also by farm effects. High productive farms have shorter re-service intervals than low productive farms [14] that can be achieved through better breeding and
culling practices. Additionally, in parities 1 and 6 in our study HP farms had more H-prolific sows and fewer L-prolific sows than LP farms. The result suggests that the HP farms probably had better feeding, better breeding practices, better care for sows at high risk of low productiv-ity and stricter culling guidelines [20, 21] than the LP farms.
Our study also showed a notable decrease in PBA after parity 1 in H-prolific sows, whereas PBA increased after
Table 6Comparisons of reproductive performance between three farm productivity groups and between three sow groups categorized by piglets born alive in parity 11
Sow groups2
High prolific sows Intermediate prolific sows Low prolific sows
Farm groups3 Mean (± SE) Mean (± SE) Mean (± SE)
Number of sows
High-performing farms 6624 25,318 3332
Intermediate-performing farms 3744 28,944 4575
Low-performing farms 784 9562 2213
Gilt age at first-mating, days old4
High-performing farms 257.7 (6.05)x 257.3 (6.04)y 256.7 (6.06)y
Intermediate-performing farms 249.7 (4.31)x 248.1 (4.28)y 247.6 (4.30)y
Low-performing farms 259.3 (6.03)x 256.5 (5.93)y 255.8 (5.96)y
Parity at removal4
High-performing farms 5.1 (0.12)x 5.0 (0.11)x 4.2 (0.12)y
Intermediate-performing farms 5.1 (0.09)x 5.1 (0.08)x 4.6 (0.09)y
Low-performing farms 4.9 (0.14)x 4.9 (0.11)x 4.3 (0.12)y
Lifetime piglets born alive
High-performing farms 70.3 (1.40)ax 61.9 (1.36)ay 44.4 (1.45)z
Intermediate-performing farms 66.4 (1.07)abx 59.3 (0.97)aby 45.8 (1.05)z
Low-performing farms 63.6 (1.71)bx 55.8 (1.36)by 41.3 (1.48)z
Lifetime piglets weaned
High-performing farms 56.0 (1.15)ax 54.7 (1.11)ay 45.3 (1.19)az
Intermediate-performing farms 52.1 (0.89)ax 51.2 (0.79)axy 44.7 (0.86)ay
Low-performing farms 46.8 (1.42)bx 46.5 (1.12)bxy 38.7 (1.22)by
Lifetime non-productive days
High-performing farms 82.1 (2.87)cx 80.2 (2.82)cy 73.1 (2.93)cz
Intermediate-performing farms 96.2 (2.13)bx 95.5 (1.99)by 90.8 (2.10)bz
Low-performing farms 111.8 (3.25)ax 109.3 (2.80)ay 103.8 (2.94)az
Annualized lifetime piglets weaned per sow
High-performing farms 25.8 (0.20)ax 25.8 (0.19)ax 24.5 (0.21)ay
Intermediate-performing farms 23.4 (0.16)bx 23.1 (0.14)by 21.3 (0.15)bz
Low-performing farms 20.9 (0.26)cx 20.6 (0.19)cx 18.3 (0.21)cy
a-c
Different superscripts within a column represent significant differences in means (P< 0.01)
x-z
Different superscripts within a row represent significant differences in means (P < 0.01)
1
Means and SE were estimated by mixed models
2
Groups based on the upper and lower 10th percentiles of piglets born alive in parity 1: High (15 piglets or more); Intermediate (8 to 14 piglets) and Low (7 piglets or fewer) prolific sows
3
Categorized by farm means of the upper and lower 25th percentiles of annualized lifetime piglets weaned per sow over 6 years: High- (> 24.7 piglets); Intermediate- (24.7 to 21.2 piglets) and Low- (< 21.2 piglets) performing farms
4
parity 1 in L-prolific sows. There is a hypothetical cascade from follicle development and embryo survival to preg-nancy maintenance in sows [22]. Therefore, while H-prolific gilts may have had more potential than L-prolific gilts, for example, more ova, higher embryo sur-vival and higher progesterone concentrations to maintain pregnancy, their ovarian function from ovaries to preg-nancy decreased. One possible reason for this decrease in H-prolific sows is that their ovaries and uterus endomet-rium may not have had enough time to recover from con-tinuous ovulations and farrowing. A decreased farrowing-to-mating interval decreases the total number of piglets born [23] and PBA at subsequent parity. Mean-while, low prolific gilts may be associated with having lit-ter of origin problems, such as low birth weight [24]. Therefore, our study suggests that differences in farm ef-fects can affect patterns of reproductive performance in both H-prolific and L-prolific sows. Such differences in farm effects will include differences in gilt development, such as diet and boar exposure [25], facilities and workers’ stockmanship [26].
The lack of any association between either the sow groups or farm groups and weaning-to-first-mating in-tervals in our present study is similar to the findings in a previous study in Japan [3]. This lack of association may be due to the fact, that weaning-to-first-mating interval is highly related to gonadotropin secretion of sows, which in turn is affected by lactation management in-cluding feed intake [15,27]. Also, the three farm groups had similar policy for ages at first-mating of approxi-mately 250 days, and there was no association between the farm groups and age at-first mating.
Finally, there are some limitations that should be noted when interpreting the results of this observational study using herd data. Health status, nutritional pro-grams and genotype were not taken into account in the analyses. Also, our data contained lifetime records from herd-entry to removal, so our data were not all current. However, even with such limitations, this research pro-vides valuable information for pig producers and veteri-narians about the impact of sow potential and farm effects on lifetime reproductive performance of sows.
Conclusions
Farm effects substantially affected reproductive perform-ance across parities and lifetime performperform-ance of sows. Using sows with similar potential at parity 1, HP farms exploited lifetime productivity of sows better than on LP farms, especially L-prolific sows. The higher lifetime prod-uctivity of sows on HP farms than on LP farms was due to 8% higher farrowing rate, 27–30% fewer non-productive days and 7–11% more PBA during lifetime. Also, in parity 6 there were 15% or more H-prolific sows on HP farm than on LP farms.
Appendix A
Table 7For high prolific sowsa, estimates of fixed factors and random effect variance included in the final linear mixed effects models for number of piglets born alive and for piglets weaned
Piglets born alive Piglets weaned
Fixed and random effectsb,c Estimate
(± SE) P
-value Estimate
(± SE) P
-value
Intercept 12.31 (0.20) < 0.01 9.35 (0.15) < 0.01
Farm groupsd < 0.01 < 0.01
High-performing (HP) farms
1.00 (0.22) 1.64 (0.18)
Intermediate-performing (IP) farms
0.38 (0.22) 0.95 (0.17)
Parity groups (Py) < 0.01 < 0.01
1 3.32 (0.20) 0.96 (0.14)
2 0.01 (0.20) 0.64 (0.15)
3 0.41 (0.21) 0.61 (0.15)
4 0.52 (0.21) 0.55 (0.15)
5 0.21 (0.21) 0.53 (0.16)
Farm x Py < 0.01 < 0.01
HP farms x Py 1 - 0.81 (0.21) - 0.62 (0.15)
HP farms x Py 2 - 0.25 (0.21) - 0.25 (0.15)
HP farms x Py 3 - 0.05 (0.22) - 0.28 (0.16)
HP farms x Py 4 - 0.07 (0.22) - 0.38 (0.16)
HP farms x Py 5 0.07 (0.22) - 0.47 (0.16)
IP farms x Py 1 - 0.24 (0.22) - 0.36 (0.16)
IP farms x Py 2 - 0.04 (0.22) - 0.17 (0.16)
IP farms x Py 3 0.01 (0.23) - 0.30 (0.16)
IP farms x Py 4 - 0.24 (0.23) - 0.36 (0.17)
IP farms x Py 5 - 0.11 (0.23) - 0.37 (0.17)
Intercept variance at farm level
0.19 (0.04) – 0.18 (0.03) –
Intercept variance at sow level
0.12 (0.01) – 0.07 (0.01) –
ICC (records within the same farm), %
2.4 – 4.3 –
ICC (records within the same sow), %
4.0 – 6.0 –
a
High prolific sows are sows farrowed 15 or more piglets born alive at parity 1 (based on the upper 10th percentile of piglets born alive in parity 1)
b
SE: standard error; ICC: intraclass correlation coefficient
c
Reference categories were the LP farms and parity 6 sows
d
Categorized by farm means of the upper and lower 25th percentiles of annualized lifetime piglets weaned per sow: High- (> 24.7 piglets);
Appendix B
Table 8For low prolific sowsa, estimates of fixed factors and random effect variance included in the final linear mixed effects models for number of piglets born alive and for piglets weaned
Piglets born alive Piglets weaned
Fixed and random effectsb,c Estimate (± SE) P-value Estimate (± SE)
P-value
Intercept 11.36 (0.14) < 0.01 9.66 (0.13) < 0.01
Farm groupsd < 0.01 < 0.01
High-performing (HP) farms 1.34 (0.18) 1.45 (0.18)
Intermediate-performing (IP) farms 0.52 (0.16) 0.68 (0.16)
Parity groups (Py) < 0.01 < 0.01
1 - 6.24 (0.12) - 1.38 (0.10)
2 - 1.00 (0.12) 0.18 (0.10)
3 - 0.18 (0.13) 0.23 (0.10)
4 - 0.20 (0.13) 0.32 (0.11)
5 - 0.09 (0.13) 0.25 (0.11)
Farm x Py < 0.01 < 0.01
HP farms x Py 1 - 1.38 (0.17) 0.79 (0.13)
HP farms x Py 2 0.09 (0.17) 0.01 (0.14)
HP farms x Py 3 - 0.02 (0.17) - 0.07 (0.14)
HP farms x Py 4 0.33 (0.18) - 0.06 (0.14)
HP farms x Py 5 0.30 (0.17) - 0.10 (0.15)
IP farms x Py 1 - 0.26 (0.15) 0.61 (0.12)
IP farms x Py 2 0.16 (0.15) - 0.06 (0.12)
IP farms x Py 3 - 0.04 (0.16) - 0.06 (0.13)
IP farms x Py 4 0.16 (0.16) - 0.26 (0.13)
IP farms x Py 5 - 0.07 (0.16) - 0.25 (0.13)
Intercept variance at farm level 0.15 (0.03) – 0.23 (0.04) –
Intercept variance at sow level 0.16 (0.01) – 0.07 (0.01) –
ICC (records within the same farm), % 1.9 – 4.5 –
ICC (records within the same sow), % 3.9 – 6.0 –
a
Low prolific sows are sows farrowed 7 or fewer piglets born alive at parity 1 (based on the lower 10th percentile of piglets born alive in parity 1)
bSE
standard error,ICCintraclass correlation coefficient
c
Reference categories were Low-performing farms and parity 6 sows
d
Appendix C
Table 9Estimates of fixed factors and random effect variance included in the final modelsafor farrowing rate and for weaning-to-first-mating interval of served females
Farrowing rate Weaning-to-first-mating interval
Fixed and random effectsb,c Estimate (± SE) P-value Estimate (± SE)
P-value
Intercept 1.45 (0.08) < 0.01 5.67 (0.16) < 0.01
Farm groupsd < 0.01 0.45
High-performing farms 0.63 (0.08) - 0.28 (0.22)
Intermediate-performing farms 0.28 (0.07) - 0.10 (0.19)
Parity groups (Py) < 0.01 < 0.01
0 0.18 (0.06) –
1 - 0.32 (0.06) 1.65 (0.03)
2 - 0.05 (0.06) 0.50 (0.03)
3 0.03 (0.07) 0.37 (0.03)
4 0.07 (0.07) 0.21 (0.03)
5 0.03 (0.07) 0.09 (0.03)
Sow groupse < 0.01 0.58
High-prolific sows - 0.15 (0.07) - 0.03 (0.04)
Intermediate-prolific sows - 0.03 (0.06) - 0.03 (0.02)
Py x Sow groups < 0.01 –
Py 0 x High-prolific sows 0.20 (0.08) –
Py 0 x I-prolific sows 0.20 (0.07) –
Py 1 x High-prolific sows 0.39 (0.08) –
Py 1 x Intermediate-prolific sows 0.21 (0.07) –
Py 2 x High-prolific sows 0.37 (0.09) –
Py 2 x Intermediate-prolific sows 0.23 (0.07) –
Py 3 x High-prolific sows 0.24 (0.09) –
Py 3 x Intermediate-prolific sows 0.11 (0.07) –
Py 4 x High-prolific sows 0.14 (0.09) –
Py 4 x Intermediate-prolific sows 0.04 (0.07) –
Py 5 x High-prolific sows 0.09 (0.09) –
Py 5 x Intermediate-prolific sows 0.04 (0.08) –
Intercept variance at farm level 0.07 (0.01) – 0.59 (0.09) –
Intercept variance at sow level 0.03 (0.01) – 0.07 (0.01) –
ICC (records within the same farm), % 2.2 – 2.9 –
ICC (records within the same sow), % 3.2 – 3.2 –
a
Logistic regression model and linear mixed effects model were used respectively for farrowing rate and weaning-to-first-mating interval
b
SE: standard error; ICC: intraclass correlation coefficient
c
Reference categories were the Low-performing farms, parity 6 sows and Low-prolific sows
d
Categorized by farm means of the upper and lower 25th percentiles of annualized lifetime piglets weaned per sow: High- (> 24.7 piglets); Intermediate- (24.7 to 21.2 piglets) and Low- (< 21.2 piglets) performing farms
e
Abbreviations
HP:High-performing; H-prolific: High prolific; ICC: Intraclass correlation coefficient; IP: Intermediate-performing; I-prolific: Intermediate prolific; LP: Low-performing; L-prolific: Low prolific; PBA: Piglets born alive
Acknowledgements
The authors gratefully thank the swine producers for their cooperation in providing their valuable data for use in this study. We also thank Dr. I. McTaggart for his critical review of this manuscript.
Funding
This work was supported by the Graduate School GP-2017 from Meiji University.
Availability of data and materials
The dataset analyzed during the current study is not publicly available
because producers’privacy could be compromised.
Authors’contributions
ST and YK were responsible for the study design. CP was responsible for data acquisition and participated in the study design. ST carried out the statistical analysis and drafted the manuscript. All authors read and approved the final manuscript.
Ethics approval and consent to participate Not applicable.
Consent for publication Not applicable.
Competing interests
The authors declare that they have no competing interests.
Publisher’s Note
Springer Nature remains neutral with regard to jurisdictional claims in published maps and institutional affiliations.
Author details
1
School of Agriculture, Meiji University, Higashi-mita 1-1-1, Tama-ku, Kawasaki, Kanagawa 214-8571, Japan.2PigCHAMP pro Europa S.L., c/Santa
Catalina 10, 40003 Segovia, Spain.
Received: 12 December 2017 Accepted: 14 June 2018
References
1. Knauer MT, Cassady JP, Newcom DW, See MT. Gilt development traits
associated with genetic line, diet and fertility. Livest Sci. 2012;148:159–67. 2. Iida R, Koketsu Y. Number of pigs born alive in parity 1 sows associated
with lifetime performance and removal hazard in high- or low-performing herds in Japan. Prev Vet Med. 2015;121:108–14.
3. Iida R, Piñeiro C, Koketsu Y. High lifetime and reproductive performance of sows on southern European Union commercial farms can be predicted by high numbers of pigs born alive in parity one. J Anim Sci. 2015;93:2501–8.
Appendix D
Table 10Mean values of reproductive performance between the three farm productivity groups of either high prolific or low prolific sows in consecutive paritiesa,b
Consecutive parity
Farm groupsc Nd 0 1 2 3 4 5 6
High prolific sowse
Farrowing rate, %
High-performing farms 6624 91.5 (0.57) 88.4 (0.72) 90.5 (0.64) 90.1 (0.67) 89.6 (0.72) 88.6 (0.80) 86.9 (0.96)
Intermediate-performing farms 3744 87.3 (0.74) 83.6 (0.88) 87.1 (0.79) 85.4 (0.88) 84.5 (0.97) 84.1 (1.05) 83.2 (1.22)
Low-performing farms 784 81.7 (1.65) 79.0 (1.81) 81.6 (1.77) 84.5 (1.71) 84.3 (1.84) 78.5 (2.34) 77.2 (2.84)
Weaning-to-first-mating interval, days
High-performing farms 6139 – 7.2 (0.19) 5.9 (0.19) 5.8 (0.19) 5.7 (0.19) 5.5 (0.19) 5.3 (0.20)
Intermediate-performing farms 3447 – 7.2 (0.15) 6.1 (0.16) 6.0 (0.16) 5.9 (0.16) 5.7 (0.17) 5.5 (0.18)
Low-performing farms 715 – 7.3 (0.25) 6.0 (0.26) 6.4 (0.26) 5.7 (0.27) 5.9 (0.29) 5.6 (0.33)
Low prolific sowse
Farrowing rate, %
High-performing farms 3332 90.2 (0.69) 84.5 (0.96) 87.2 (0.90) 88.9 (0.87) 89.9 (0.88) 88.4 (1.04) 87.6 (1.33)
Intermediate-performing farms 4575 87.3 (0.64) 81.1 (0.84) 84.5 (0.78) 85.2 (0.80) 85.0 (0.86) 85.5 (0.92) 83.8 (1.15)
Low-performing farms 2213 83.6 (1.05) 75.3 (1.37) 80.0 (1.28) 80.4 (1.34) 81.7 (1.39) 80.2 (1.58) 83.2 (1.62)
Weaning-to-first-mating interval, days
High-performing farms 2869 – 7.0 (0.19) 5.8 (0.19) 5.7 (0.19) 5.6 (0.20) 5.5 (0.21) 5.4 (0.24)
Intermediate-performing farms 3948 – 7.3 (0.14) 6.3 (0.14) 6.1 (0.14) 5.8 (0.15) 5.7 (0.16) 5.6 (0.17)
Low-performing farms 1903 – 7.2 (0.19) 6.2 (0.20) 6.1 (0.20) 5.9 (0.21) 6.1 (0.22) 5.7 (0.24)
a
Means and SE were estimated by mixed models
b
Significant differences (e.g. a, b) were not shown in this Table, because there were no 3-way interactions between sow groups, farm groups and parity groups for both farrowing rate and the weaning-to-first-mating interval (P≥0.05)
c
Sow groups based on the upper and lower 10th percentiles of piglets born alive in parity 1: High- (15 piglets or more)- and Low- (7 piglets or fewer) prolific sows
d
N represents the initial number of sows
e
4. Gruhot TR, Díaz JAC, Baas TJ, Stalder KJ. Using first and second parity number born alive information to estimate later reproductive performance in sows. Livest Sci. 2017;196:22–7.
5. Stalder K, D’Allaire S, Drolet R, Abell C. Longevity in breeding animals. In: Zimmerman JJ, Karriker LA, Ramirez A, Schwartz KJ, Stevenson GW, editors. Deseases of swine. 10th ed. Chichester: Wiley; 2012. p. 50–9.
6. Koketsu Y. Productivity characteristics of high-performing swine farms. J Am Vet Med Assc. 2000;215:376–9.
7. Patterson JL, Beltranena E, Foxcroft GR. The effect of gilt age at first estrus and breeding on third estrus on sow body weight changes and long-term reproductive performance. J Anim Sci. 2010;88:2500–13.
8. Amaral Filha WS, Bernardi ML, Wentz I, Bortolozzo FP. Growth rate and age at boar exposure as factors influencing gilt puberty. Livest Sci. 2009;120 (1–2):51–7.
9. Kraeling RR, Webel SK. Current strategies for reproductive management of gilts and sows in North America. J Anim Sci Biotechnol. 2015;6:3.
10. Knox RV. Impact of swine reproductive technologies on pig and global food production. Adv Exp Med Biol. 2014;752:131–60.
11. Kirkden RD, Broom DM, Andersen IL. Piglet mortality: management solutions. J Anim Sci. 2013;91:3361–89.
12. Declerck I, Dewulf J, Sarrazin S, Maes D. Long-term effects of colostrum intake in piglet mortality and performance. J Anim Sci. 2016;94:1633–43. 13. European commission. Pig: number of farms and heads by agricultural size
of farm (UAA) and size of pig herd, 2016.http://ec.europa.eu/eurostat/web/ products-datasets/-/ef_lspigaa. Accessed 30 Aug 2017.
14. Tani S, Piñeiro C, Koketsu Y. Characteristics and risk factors for severe repeat-breeder female pigs and their lifetime performance in commercial breeding herds. Porcine Health Manage. 2017;3:12.
15. Hoving L, Soede N, Graat E, Feitsma H, Kemp B. Reproductive performance of second parity sows: relations with subsequent reproduction. Livest Sci. 2011;140:124–30.
16. Sasaki Y, Koketsu Y. Reproductive profile and lifetime efficiency of female pigs by culling reason in high-performing commercial breeding herds. J Swine Health Prod. 2011;19:284–91.
17. Dohoo IR, Martin SW, Stryhn H. Veterinary epidemiologic research. 2nd ed. Charlottetown, Prince Edwards Island, Canada: VER Inc.; 2009.
18. Steverink D, Soede N, Groenland G, Van Schie F, Noordhuizen J, Kemp B. Duration of estrus in relation to reproduction results in pigs on commercial farms. J Anim Sci. 1999;77(4):801–9.
19. Sasaki Y, Koketsu Y. Culling intervals and culling risks in four stages of the reproductive life of first service and reserviced female pigs in commercial herds. Theriogenology. 2010;73:587–94.
20. Williams NH, Patterson J, Foxcroft G. Non-negotiables of gilt development. Adv Pork Prod. 2005;16:281–9.
21. Sasaki Y, Koketsu Y. Mortality, death interval, survivals, and herd factors for death in gilts and sows in commercial breeding herds. J Anim Sci. 2008;86: 3159–65.
22. Bertoldo MJ, Holyoake PK, Evans G, Grupen CG. Seasonal variation in the ovarian function of sows. Reprod Fertil Dev. 2012;24:822–34.
23. Koketsu Y, Dial GD. Interactions between the associations of parity, lactation length, and weaning-to-conception interval with subsequent litter size in swine herds using early weaning. Prev. Vet. Med. 1998;37:113–20. 24. Vallet JL, Calderón-Díaz JA, Stalder KJ, Phillips C, Cushman RA, Miles JR,
Rempel LA, Rohrer GA, Lents CA, Freking BA, Nonneman DJ. Litter-of-origin trait effects on gilt development. J Anim Sci. 2016;94:96–105.
25. Knauer MT, Hostetler CE. US swine industry productivity analysis, 2005 to 2010. J Swine Health Prod. 2013;21:248–52.
26. Verdon M, Hansen CF, Rault JL, Jongman E, Hansen LU, Plush K, Hemsworth
PH. Effects of group housing on sow welfare: a review. J Anim Sci. 2015;93: 1999–2017.