A R T I C L E
DOI 10.1007/s12651-016-0213-1
What do people do at work?
A profile of U.S. jobs from the survey of workplace Skills, Technology, and Management
Practices (STAMP)
Michael J. Handel1
Accepted: 3 August 2016 / Published online: 4 October 2016
© The Author(s) 2016. This article is available at SpringerLink with Open Access.
Abstract This paper describes the survey of Skills, Tech-nology, and Management Practices (STAMP), which em-phasizes the use of behaviourally specific questions in or-der to improve the quality of job measures. Such measures yield better understanding of the absolute levels of job de-mands compared to items or scales with arbitrary units that lack definite meaning outside the framework of a partic-ular survey. STAMP measures reveal most workers use relatively simple levels of math on their jobs, but there is a bifurcation of jobs in terms of the complexity of read-ing and especially writread-ing that is required. Aside from managerial and professional occupations, the absolute level of academic skills required on most jobs does not appear to be very high. Likewise, computer use is widespread but most people use computers for fairly mundane office duties rather than more complex tasks; few workers use any kind of automated production equipment on their jobs. Well-developed employee involvement practices, such as self-directed teams, cover about one-fifth to one-quarter of the workforce. Very few workers report being affected by outsourcing and the numbers affected by technological dis-placement are almost imperceptible.
Was machen Menschen bei der Arbeit?
Ein Profil US-amerikanischer Arbeitsplätze aus der Unter-suchung von Kompetenzen, Technologie und Management-praktiken am Arbeitsplatz (Skills, Technology, and Man-agement Practices – STAMP)
Michael J. Handel [email protected]
1 Department of Sociology and Anthropology, Northeastern
University, 960B Renaissance Park, Boston, MA 02115, USA
Zusammenfassung Die vorliegende Abhandlung be-schreibt die Untersuchung von Kompetenzen, Technolo-gie und Managementpraktiken (Skills, Technology, and Management Practices – STAMP), die die Nutzung ver-haltensspezifischer Fragen als ein Mittel unterstreicht, um die Qualität von Arbeitsplatzmaßnahmen zu verbessern. Solche Maßnahmen führen zu einem besseren Verständnis der absoluten Arbeitsanforderungen im Vergleich zu Skalen mit willkürlichen Einheiten, die außerhalb einer speziellen Studie keine eindeutige Bedeutung haben. STAMP-Maß-nahmen zeigen, dass die meisten Angestellten einfache Mathematik für ihre Arbeit nutzen. Zugleich gibt es zwei Gruppen von Arbeitsplätzen im Hinblick auf die Komplexi-tät der erforderlichen Kompetenzen im Bereich Lesen und insbesondere Schreiben. Abgesehen von Managementpo-sitionen und Fachkräften erscheint das absolute Niveau an theoretischen Kenntnissen, das für die meisten Arbeitsplät-ze erforderlich ist, nicht sonderlich hoch. Ebenso ist die Nutzung von Computern weit verbreitet, wobei die meis-ten Menschen Computer für eher schlichte Büroarbeimeis-ten verwenden als für komplexere Aufgaben; nur wenige Ar-beitnehmer nutzen Formen automatisierter Betriebsmittel bei ihrer Arbeit. Fortgeschrittene Methoden zur Mitarbei-terbeteiligung wie eigenständige Teams betreffen rund ein Fünftel bis ein Viertel der Erwerbstätigen. Sehr wenige Arbeitnehmer berichten, dass sie direkt von Outsourcing betroffen sind und die Anzahl derer, die ihren Arbeitsplatz verlieren, weil ihre Aufgaben von neuen Technologien übernommen werden, ist verschwindend gering.
1 Introduction
interested in understanding levels and trends in job skill re-quirements, and their relationships to technology and work organization. The nature of job skill requirements is central to a number of broader research topics in the United States and elsewhere, notably ...
● the growth of wage inequality since the late 1970s, which some have ascribed to a technologically-induced skills shortage (Katz and Murphy 1992; Danziger and Gottschalk1995; Autor, Katz, and Krueger 1998; Morris and Western 1999; Fernandez 2001; Bresnahan et al.
2002).
● persistently disappointing earnings and employment prospects of less-skilled workers (Holzer1996).
● persistent racial inequality and high poverty levels, and concern over the movement of persons from welfare to rewarding work (Wilson 1996; Moss and Tilly 2001; Holzer and Stoll2001).
● potential for remediation of inequality through improved education, smoother transitions from school to work, and diffusion of employee involvement or “high perfor-mance” workplace practices (Murnane and Levy1996; Rosenbaum and Binder 1997; U.S. National Commis-sion on Excellence in Education1983; Smith1997; Ap-pelbaum, Bailey, Berg, and Kalleberg 2000; Osterman
2000).
● concern over the possibility of various forms of job degradation (routinization, effort intensification, out-sourcing, precarity, lower real wages and benefits) resulting from the adoption of “lean and mean” or-ganizational reforms (Harrison and Bluestone 1998; Harrison 1994; Graham 1993; Green 2006; Handel
2005a).
All of this research rested on theories, findings, or as-sumptions regarding the nature, level, and trend of job skill requirements. However, a longstanding problem was that most of these studies used either rough proxy measures of job skill demands available in nationally representative data sets (broad occupation group, personal education, average education within occupations), occupation-level job mea-sures from individual cross-sections (e. g., DOT or O*NET scores)1, or, more rarely, case-level measures created for
unique surveys administered to restricted samples (Holzer
1996; Fernandez 2001). Other research used open-ended and relatively unstandardized interview methods for qual-itative cases studies (e. g., Rosenbaum and Binder1997), while reports of high-level commissions resting on a thin base of impressionistic evidence and speculative assump-tions have long been a staple of the policy discourse provid-ing indirect impetus for the academic research (e. g., U.S.
1 DOT= Dictionary of Occupational Titles,O*NET= Occupational
Information Network.
Department of Labor. Secretary’s Commission on Achiev-ing Necessary Skills1991). No systematic portrait of U.S. jobs had been produced since the final Quality of Employ-ment Survey in 1977 (Quinn and Staines1978).
In addition, survey questions on job skill requirements and other characteristics tended to use overly general word-ing and subjective scales (e. g., ratword-ing scales, vague quanti-fiers), which are less interpretable than more behaviourally specific measures and subject to significant measurement error (Handel 2000, 2008). In many ways O*NET main-tains some of these limitations (see Handel, this issue).2
Likewise, almost no survey, including O*NET, has equally strong coverage of (1)job skill requirements, (2)technology use, and (3) employee involvement (EI) practices despite their presumed importance and interrelationships. Conse-quently, researchers have only a cloudy sense of the levels and kinds of job skill requirements, rates of change, the di-mensions along which job skills are changing, and the inter-relationships between skills, technology, and EI. If current concerns are to be addressed with any degree of specificity, measures of job requirements need to be more precise, con-crete, and comparable to person characteristics covering all three of the key content areas, so that researchers and users of research have some notion of the absolute levels of job demands, rather than just a score on a rating scale that has no clear meaning outside the framework of a particular survey.
With these goals in mind, the survey of Skills, Technol-ogy, and Management Practices (STAMP) was developed to collect direct information on job skill requirements, tech-nology use, employee involvement practices, and other job characteristics that have been subjects of broad interest for many years.
In particular, STAMP was designed to address the fol-lowing questions:
1. What is the distribution of jobs by level of skills, com-puter use3, and participation in employee involvement
practices? In other words, what is the skill profile of the American job structure?
2. What are the functional and causal relationships between skill requirements, computer use, and employee involve-ment?
3. What are the effects of skill requirements, computer use, and EI on wages, working conditions, and other job
char-2 For example, O*NET’s measures of math, reading, and writing used
at work are rating scales that do not correspond clearly to different objective levels of complexity or easily understood categories of edu-cational achievement. Other important job characteristics are beyond O*NET’s scope altogether, such as promotion opportunities, downsiz-ing/outsourcing, workload, work pace, stress, and pay and benefits.
3 For ease of exposition, “computer use” is sometimes used as a
acteristics (e. g., work intensity, promotions, layoffs, out-sourcing, unionization, job satisfaction)?
4. What are the trends in ...
1. skill requirements, technology, and EI practices? 2. their functional and causal interrelationships? 3. their relationships to the other outcomes noted in (3)
above?
One of the most active research programs on job skill requirements using individual-level data that pre-dates STAMP is based on the UK Skills and Employment Sur-veys (see Felstead et al. 2007and Green et al. 2016). The past decade has seen a significant increase in awareness regarding the critical importance of measuring job char-acteristics effectively for research, which has stimulated studies using the German Qualification and Career Surveys (see Spitz-Oener 2006 and Rohrbach-Schmidt and Tie-mann2016). This movement has culminated in the recent multi-country Survey of Adult Skills, coordinated by the OECD (OECD2012), whose section on job requirements draws from both the UK Skills and Employment Surveys and STAMP. The World Bank’s multi-country Skills To-ward Employment and Productivity (STEP) survey relies even more heavily on STAMP (see Handel et al.2016).
This paper is an overview of STAMP results that provide a systematic profile of the American job structure that can serve as a basis for discussions of the skill requirements of American jobs. The goal is primarily descriptive, with tentative implications for other issues noted as they arise. The next section describes the STAMP approach to improv-ing upon existimprov-ing measurers of job content. The followimprov-ing section describes the sample and potential implications for estimates of job requirements in the U.S. The remaining sections presents results on skill requirements, technology use, employee involvement, and other management prac-tices, respectively. A final section concludes.
2 Development of the STAMP survey
STAMP sought to improve upon existing survey approaches in a number of ways. To avoid the thinness of some recent surveys, STAMP focused on achieving high content valid-ity by covering as much ground with as much detail as possible in all three of the core domains (skills, technology, EI). Items were constructed to measure a wide range of lev-els within different constructs to maximize variability and precision and to avoid problems with coarse scales, highly skewed response distributions, and floor and ceiling effects. STAMP also adopted a measurement strategy that can be called explicit scaling (Handel2008,2016). In contrast to previous approaches, survey questions and response options were made as concrete, factual, and specific as possible to minimize error variance due to subjective and inconsistent
interpretations of their meanings across respondents. Ques-tions were phrased in terms of facts, events, and behaviours rather than attitudes, judgments and evaluations, wherever possible. The survey uses response scales with cardinal or other absolute meanings and avoids vague quantifiers and numerical rating scales wherever possible. These kinds of responses are more interpretable than five-point rating scales or factor-analytic scales. Ideally, job requirements are measured on the same scale as person abilities, such as education levels or weight of loads lifted on the job, which permits direct comparisons of jobs and workers. Of course, not all items can achieve this level of concreteness while remaining generally valid for the diverse jobs found in a modern economy, but items that are behaviourally ex-plicit and response options with absolute meanings are the ideals that guided the survey construction. The Appendix contains text of key questions. Rating scales are not com-pletely absent from STAMP, but the goal is to minimize their use in favor of questions and response scales that have objective meanings.
STAMP items were developed from a wide literature search across various disciplines (sociology, industrial re-lations, labour economics, education, psychology, human resource management), my own experience working with existing surveys (Handel 2000, 2006), recent research on survey methodology, and a pilot version of the survey ad-ministered by graduate students in face-to-face interviews with over one hundred workers in diverse occupations in a medium-sized urban area. Late-stage versions of the in-strument were circulated to other researchers, most with extensive experience conducting work-related surveys, and their comments were incorporated into the final survey.4
Separate analyses indicate that the validity and reliabil-ity of the STAMP measures is generally high (Handel2008,
2016). Multiple items intended to measure the same con-struct usually scale strongly with one another using multiple tests of construct validity (Cronbach’s α, nonlinear prin-cipal components analyses, confirmatory factor analysis). Some items form Guttman-style hierarchies of intensity, in which people responding positively to higher-level items (e. g., use calculus) have a high probability of responding positively to all lower-level items (e. g., perform multipli-cation/division). This kind of scale is considered to meet stricter standards of unidimensionality in measuring latent traits than more common form of scales using a number of parallel measures. The scales also correlate strongly with
4 I would like to thank in particular Mary Ellen Colten and Carol
various other measures like required education level and wages, indicating generally strong criterion validity.
One potential limitation of the STAMP approach is that it is based on self-reports of job incumbents, which may be upwardly biased compared to trained job analysts’ judg-ments. Employees may inflate self-reports due to self-pre-sentation motives and restricted frames of reference. When a worker rates their job’s level of autonomy, for example, they are more likely to be making comparisons to jobs rel-atively close to their own, rather than considering where their job falls relative to the entire spectrum of jobs in the economy. Indeed, research finds incumbents generally give their jobs more positive ratings than job analysts or other external observers, such as supervisors, though the two sets of ratings are usually, though not always, correlated and the differences between incumbents and observers are not always large.5
However, analyst and supervisor ratings also have po-tential problems, such as less intimate knowledge of jobs than the job-holders themselves, and biases such as halo ef-fects or stereotyping.6In practice, job analysts themselves
usually derive much of their data from interviews with in-cumbents, though they combine this information with their own and others’ observations and judgment, as well.
Hopefully, the concreteness of STAMP questions and re-sponse options reduces any upward bias of incumbent self-reports compared to existing survey practices. Neverthe-less, it is likely that any self-report item contains some degree of upward bias, which will artificially elevate esti-mates of average job skill requirements. If individuals with more skills or holding higher positions are also more likely to give self-enhancing responses to measures of job char-acteristics, then the strength of relationships may also be inflated due to common method variance.
3 Sample
STAMP is a two-wave refreshed panel that used random-digit dial telephone methods to interview employed wage and salary workers in the United States age eighteen and over. The first wave was conducted between October 2004 and January 2006 (n = 2304). Eligible individuals were selected randomly within households and interviewed with
5 For examples, see Cook et al. (1981, pp. 173 ff.); Kohn and Schooler
(1983, p. 67); Lopata et al. (1985, pp. 404 ff.); Glick et al. (1986, p. 449); Gerhart (1987); Harvey (1991, p. 112); Cully et al. (1999, p. 54); Peterson et al. (1999, pp. 67, 241, 292); Manson et al. (2000, p. 16); Leckie et al. (2001, pp. 49 ff.); Green and James (2003).
6 For examples, see Cain and Treiman (1981, pp. 269 ff.); Steinberg
(1990); Spenner (1983, p. 831); Attewell (1990, p. 429); Peterson et al. (2001, p. 484); Darrah (1994, pp. 73 ff.); Cully et al. (1999, pp. 120, 148, 276 ff.); Spector and Fox (2003, p. 419); Green and James (2003).
respect to their own jobs, i. e., no proxy reporting. Between September 2007 and December 2009 respondents from the first wave were reinterviewed, along with a new, represen-tative sub-sample to permit trend analyses as well as fixed effects models for a three-year panel. In the first wave, com-plete interviews were conducted with 66 % of those deemed eligible after screening. The survey contained about 166 unique items related to job characteristics, as well as oth-ers related to poth-ersonal characteristics; the average interview length was approximately 28 min. All respondents received post-stratification weights to make the sample consistent with contemporaneous data from the U.S. Current Popula-tion Survey and all tabulaPopula-tions below are weighted.
To ensure jobs at all skill levels were represented in the survey in proportion to their numbers in the workforce, a Spanish-language version of the survey was administered to workers who were more comfortable taking the survey in Spanish. Nevertheless, it is highly likely that the sample under-represents a large group of low-skill workers eligi-ble for the survey, undocumented Spanish-speaking immi-grants, who would be expected to be reluctant to answer job-related questions posed by a stranger over the tele-phone. Additionally, workers who speak neither English nor Spanish well enough to be interviewed were outside the survey’s universe for practical reasons. Only 105 of the households contacted in the first wave were deemed in-eligible for language reasons, but many members of this population may lack telephones altogether.
These omissions may have some effect on the results. The large increase in unskilled immigration to the United States in recent years itself somewhat contradicts the widespread notion of skills shortage. Insofar as low-skilled immigrants are under-represented in the sample, results are somewhat biased upward in favour of the conventional wis-dom in its estimates of job requirements such as cognitive skills, technology use, and employee involvement. This upward bias is potentially progressive over future waves if the low-skilled immigrant share of the workforce grows significantly over time.
By contrast, any upward biases resulting from incum-bents’ self-reports will likely difference out in analyses of time trends. There is also little reason to suppose à pri-ori that any variations in self-enhancing biases across skill groups will grow over time.
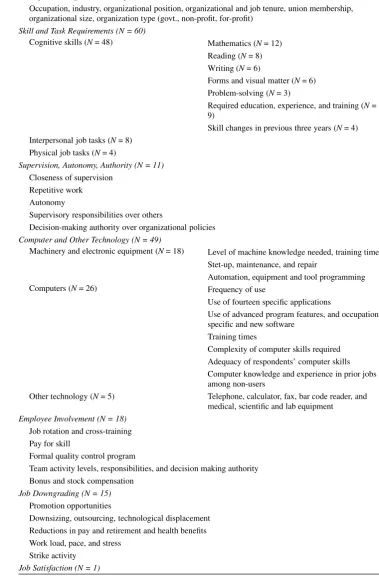
Table 1 STAMP survey
con-tent (N= number of items) Basic job and organizational information (N = 12)
Occupation, industry, organizational position, organizational and job tenure, union membership, organizational size, organization type (govt., non-profit, for-profit)
Skill and Task Requirements (N = 60)
Cognitive skills (N= 48) Mathematics (N= 12) Reading (N= 8) Writing (N= 6)
Forms and visual matter (N= 6) Problem-solving (N= 3)
Required education, experience, and training (N= 9)
Skill changes in previous three years (N= 4) Interpersonal job tasks (N= 8)
Physical job tasks (N= 4)
Supervision, Autonomy, Authority (N = 11)
Closeness of supervision Repetitive work Autonomy
Supervisory responsibilities over others
Decision-making authority over organizational policies
Computer and Other Technology (N = 49)
Machinery and electronic equipment (N= 18) Level of machine knowledge needed, training time Stet-up, maintenance, and repair
Automation, equipment and tool programming
Computers (N= 26) Frequency of use
Use of fourteen specific applications
Use of advanced program features, and occupation-specific and new software
Training times
Complexity of computer skills required Adequacy of respondents’ computer skills Computer knowledge and experience in prior jobs among non-users
Other technology (N= 5) Telephone, calculator, fax, bar code reader, and medical, scientific and lab equipment
Employee Involvement (N = 18)
Job rotation and cross-training Pay for skill
Formal quality control program
Team activity levels, responsibilities, and decision making authority Bonus and stock compensation
Job Downgrading (N = 15)
Promotion opportunities
Downsizing, outsourcing, technological displacement Reductions in pay and retirement and health benefits Work load, pace, and stress
Strike activity
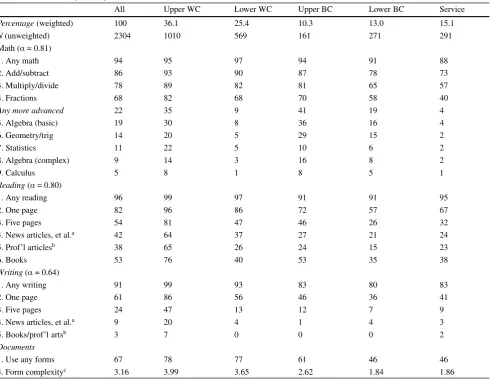
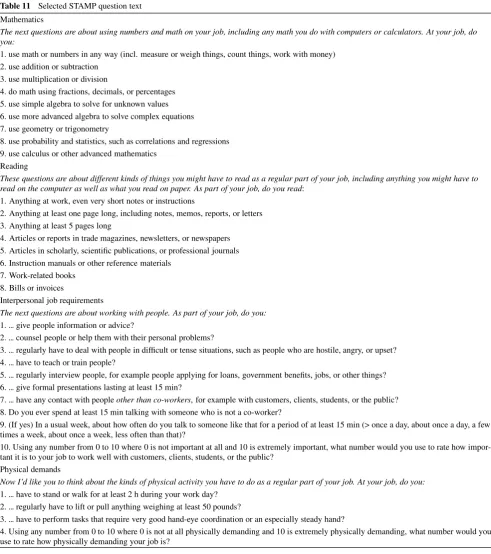
Table 2 Math, reading, writing, and document use
All Upper WC Lower WC Upper BC Lower BC Service
Percentage(weighted) 100 36.1 25.4 10.3 13.0 15.1
N(unweighted) 2304 1010 569 161 271 291
Math (α= 0.81)
1. Any math 94 95 97 94 91 88
2. Add/subtract 86 93 90 87 78 73
3. Multiply/divide 78 89 82 81 65 57
4. Fractions 68 82 68 70 58 40
Any more advanced 22 35 9 41 19 4
5. Algebra (basic) 19 30 8 36 16 4
6. Geometry/trig 14 20 5 29 15 2
7. Statistics 11 22 5 10 6 2
8. Algebra (complex) 9 14 3 16 8 2
9. Calculus 5 8 1 8 5 1
Reading(α= 0.80)
1. Any reading 96 99 97 91 91 95
2. One page 82 96 86 72 57 67
3. Five pages 54 81 47 46 26 32
4. News articles, et al.a 42 64 37 27 21 24
5. Prof’l articlesb 38 65 26 24 15 23
6. Books 53 76 40 53 35 38
Writing(α= 0.64)
1. Any writing 91 99 93 83 80 83
2. One page 61 86 56 46 36 41
3. Five pages 24 47 13 12 7 9
4. News articles, et al.a 9 20 4 1 4 3
5. Books/prof’l artsb 3 7 0 0 0 2
Documents
1. Use any forms 67 78 77 61 46 46
4. Form complexityc 3.16 3.99 3.65 2.62 1.84 1.86
Note: All figures are percentages unless noted
aCategory includes articles or reports for magazines, newspapers, or newsletters bCategory includes articles for scholarly, scientific, or professional journals
cMean values on a rating scale ranging from 0 = no form use, 1 = extremely simple, 11 = extremely complicated
4 Job skill requirements
Table1presents a summary of the content of the STAMP survey. The survey uses a relatively conventional catego-rization of work tasks into cognitive, interpersonal, and physical tasks, following the DOT’s data, people, and thingsschema.
Given their centrality to current debates, cognitive skills receive particular attention. The survey uses measures of general human capital that are likely to be meaningful to workers in diverse jobs, such as the levels of math, reading, writing, problem-solving, and the overall level of formal education required for their jobs. Specific human capital is measured using required years of previous experience in related jobs, length of training time for current job, and recent firm-provided training. Other items measure certain skills of low to moderate generality related to the use of
computers, heavy equipment, and other technologies. More occupationally-specific items, which are common in applied job analysis, would not be meaningful to most people in a general workforce survey.
The survey also covers other general dimensions fre-quently considered related to both cognitive skill and work organization, such as autonomy, closeness of supervision, authority, and managerial responsibilities (cf. Spenner
1983; Kohn and Schooler 1983; Peterson et al. 1999, pp. 251 f.), as well as employee involvement and various aspects of job downgrading.
● Upper WC = upper white collar (management, profes-sional, technical occupations).
● Lower WC = lower white collar (clerical, sales).
● Upper BC = upper blue collar (craft and repair workers, e. g., construction trades, mechanics).
● Lower BC = lower blue collar (factory workers, truck drivers, etc.).
● Service = e. g., food service workers, home health care aides, child care, janitors, police and fire fighters.
4.1 Academic skills: math, reading, and writing
Academic skills are at the centre of debates over whether the United States suffers from a general skills shortage. Labour economists studying inequality mostly infer rising skill requirements from wage trends. Some social scientists proclaim the rise of an information society led by a new class of knowledge workers, while concerns that American schools are failing to prepare students for this new world of work are rife and have motivated a “back to basics” emphasis on traditional literacy and math skills. Yet hard data and direct measures to test or substantiate these views are scarce.
Just what are the general academic skills that Americans use on their jobs?
Table 2 shows the percentages of workers performing math, reading, and writing tasks on their jobs at various levels. Reading across the rows the percentages gener-ally decline, with some exceptions, because the occupa-tion groups form a rough skill hierarchy. Reading down the columns the percentages generally decline because the STAMP items were constructed to represent a hierarchy of complexity moving from simple to difficult. Figures for Cronbach’sαgive some indication of the consistency with which the items measure a common latent trait.
Mathematics Almost everyone uses some basic math skills on their job. But once one moves beyond simple tasks like counting, addition/subtraction, and multiplica-tion/division, the proportions begin to drop. Only about two-thirds use fractions, decimals, and percentages, and there is an even clearer break beyond this point. Only 22 % of all workers use more sophisticated mathematics on their jobs, and this most commonly means simple algebra. Relatively few people use more complicated math on the job, even the sort normally taught in high school.
Reading across the rows in Table2, there is a significant occupational gradient in the use of math that corresponds generally to intuition. One prominent exception is the large proportions of skilled blue collar workers who report using various kinds of math on their jobs, generally comparable to managers and professionals. Both groups use geometry,
trigonometry, inferential statistics, and complex algebra at rates varying from about 15 to 30 %. For other workers, the percentages performing these tasks are generally in the low single digits.
Only about 5 % of all workers use calculus, which is the only level of math in the list that is clearly college level, at least in the American context. If inferential statistics and advanced algebra were included in that category, us-age rates are closer to 10 % for the workforce overall and approximately 15–20 % for workers in the more math-in-tensive occupational groups. These are measures of job demands. It is useful to recall one measure of thesupplyof skills, which is that approximately 50 % of Americans have some level of college attainment and would be expected to have some or all of these skills, or easy access to obtaining them in the course of their student careers.
Overall, it seems that rather basic levels of math, corre-sponding to two years of ordinary high school instruction, are sufficient for most jobs.
Reading Most people are far more likely to report they read than use math as part of their jobs. Almost everyone does some reading on the job, but the numbers begin to drop noticeably for most occupational groups even when the question is reading continuous text that is one page long. Other than managers and professionals, only about 25–45 % of workers read text that is at least five pages long as a regular part of their jobs. For the upper white-collar workers, this figure is over 80 %. A large majority of the latter also reads articles in newspapers and trade magazines, articles in professional journals, and books as a regular part of their job. In general, only one-quarter to one-third of workers in other occupations read material at that level of complexity. Overall, approximately 40–50 % report reading what may be relatively complex material, but the numbers vary significantly by occupation group.
The percentages reporting reading professional journals and books are larger than expected. Devising unambiguous questions for complexity of reading material is more dif-ficult than for math and the item for professional journals may include over-reporting relative to what an external ob-server might consider a professional journal, but this cannot be confirmed without more intensive study. In addition, in the first wave of STAMP it was anticipated that so few peo-ple would read books as a regular part of their jobs that the question asked whether respondents ever read work-related books, which probably led to over-reporting as well. The second wave collected additional information on the num-ber of books usually read to distinguish light from heavy readers.
the longest document is no more than a single page. At the upper end, 40–50 % of jobs appear to require reading books and professional articles, which are relatively com-plex literacy tasks.
Writing Not surprisingly, far fewer people write than read complex text on their jobs, but the specific numbers are revealing. While almost everyone does some limited form of writing at work, the percentages drop dramatically when it comes to writing text that is even a single page long. A large majority of managers and professionals write text at least a page long (80 %), but only about 35–55 % of other workers do so. Another break point comes at writing text that is at least five pages long. Nearly half of managers and professionals write documents that are at least five pages long, but only about 10 % of other workers do so.7 Far
fewer workers regardless of occupation group write text such as articles of various kinds or books.
While effective communication skills are undoubtedly useful in most jobs, overall, it appears that the vast majority of U.S. jobs require non-college levels of writing skills.
Documents It is well-known in literacy research that workplace reading materials often differ from those found in academic environments (Sticht 1975; Mosenthal and Kirsch1998). For example, many jobs involve the use of invoices, forms, and contracts, rather than running narrative text, like reports, articles, and books. For this reason the predecessors of the OECD’s Survey of Adult Skills, such as the National Adult Literacy Survey (NALS) in the U.S. and the International Adult Literacy Survey (IALS), treated document literacy as a separate dimension, distinct from prose and quantitative literacy. As Table2indicates, over two-thirds of all U.S. wage and salary workers use forms as a regular part of their jobs.
However, most people consider the forms they use to be relatively simple. Workers were asked to rate the complex-ity of the forms they used on a scale of zero to ten, with the examples of a time sheet and a long legal contract anchor-ing the lowest and highest ends of the scale. For Table2, responses were incremented one unit to permit a zero value for the one-third of respondents who used no forms on their jobs. The average form complexity rating on this
eleven-7 Note that the questions refer to the length of texts, not the total
amount of writing performed on the job. It is quite possible that over the course of a week or more a worker might write many notes that are several lines long that together add up to a page or even five page’s worth of text. However, the questions were worded to exclude this possibility because these kinds of texts are assumed to be less complex than documents with 1 or 5 pages of running text, and repetitive per-formance of simple writing should not be confused with more complex writing demands.
point scale was 3.16, or 2.87 if the scale were renormalized to ten points.
Accounting for the use of forms does provide more com-plete coverage of the literacy tasks people perform on their jobs and may capture important distinctions among workers whose jobs involve very low levels of more formal reading and writing. However, for most people, it does not appear that forms constitute a very demanding kind of literacy task on their jobs. Indeed, further research in recent years in-dicated that document literacy did not constitute a robust, distinct factor, and fewer items for this form of literacy were used for the Survey of Adult Skills and combined with results on prose items for a general literacy scale score (OECD2012).
Summary General academic skills are a major focus of concern over skill shortages, the rise of an information-centred economy, and the performance of the educational system. However, the absolute levels of such skills that are required on most jobs do not appear to be very high, with the possible exception of reading, particularly for jobs other than managerial and professional occupations.
Qualifying this portrait somewhat, it must be noted that higher levels of reading, writing, and math may be a neces-sary foundation for acquiring more occupationally-specific knowledge, which could not be captured by STAMP. Read-ing tasks, in particular, are critical for the initial acquisition of job-specific skills and for continuing participation in for-mal training off the job. Workers may need more advanced skills than they use on their jobs in order to gain the knowl-edge and skills necessary to perform their jobs. If this is the case, workers may need higher academic skills than can be inferred from these figures alone because they are a re-serve capacity that is used mostly off the job itself. This is likely to be true particularly in the case of reading, which is necessary to understand written training material for all occupations, whereas latent writing and math capacities are much less likely to be activated during training.
Broadening the focus, it is also true that a solid general education helps widen the range of occupational choices open to students who have not settled on a career even if some of the skills and knowledge is never used in their work lives and atrophies across the life course.
Table 3 Distributions of Ed-ucational Attainment and Re-quired Education, and Rates of Mismatch
Aggregate distribution Attained Required Attained – Required
<High school 9.0 7.6 1.4
High school 25.9 42.6 –16.7
High school + vocational 5.7 6.3 –0.6
<Bachelors 29.1 16.5 12.6
Bachelors 20.0 20.8 –0.8
Graduate 10.3 6.3 4.0
Individual matches All 30ÄAgeÄ59
Under-educated 13.2 14.1
Matched 55.3 57.4
Over-educated 31.5 28.6
Note: All figures are percentages
spending and savings (Gerardi et al.2010). Clearly, educa-tion has important effects on personal life outside work, as well as on participation in the broader society (Pascarella and Terenzini2005). Nor does the STAMP portrait of work today foreclose the possibility that if jobs were more en-riched in terms of general literacy skills in the future there might be gains to productivity.
Nevertheless, looking at work as it is performed now in the United States in the context of recent debates over edu-cation, the knowledge economy, and workforce skills, it is the relatively modest level of basic literacy and numeracy skills exercised as a regular part of most jobs that is no-table. The current U.S. standard of living results from jobs performed as portrayed above.
4.2 Problem solving
In addition to literacy and numeracy skills, which can be specified relatively easily, another key job requirement is general cognitive skills. Whether they should be consid-ered an academic skill is arguable. Clearly, general cogni-tive skills are developed partly through schooling, as well as general maturation, but mostly they are a by-product of subject-specific learning and not a distinct focus of orga-nized instruction. Indeed, these kinds of general reasoning or “thinking” skills are difficult to define with much con-creteness in both academic and job contexts because of their very generality, despite the ubiquity of calls to build more “critical thinking skills” into academic curricula and em-ployers’ expressed desires for better problem-solving skills from their workers. General thinking skills are important because they are implicated in almost every work situation, but they are difficult to pin down in a short compass because they include so many diverse situations and behaviours.
To measure the general thinking skills required on the job, STAMP asked respondents the frequency with which they had to solve easy problems, defined as requiring little time and assistance from others, and hard problems, defined
as those requiring a great deal of work to solve (1 = never, 2 = rarely, 3 = sometimes, 4 = often).
While nearly two-thirds said they had to solve easy prob-lems often, only 22 % often confronted hard probprob-lems on their jobs and another 45 % sometimes had to do so. One-third of U.S. workers said they rarely or never had to solve hard problems on their jobs. The frequency of hard prob-lems did not vary greatly by broad occupation, but was moderately to highly correlated with the level of formal education required by jobs (0.45). While further analyses in conjunction with the other cognitive skill measures will pursue this topic in greater depth, these figures give some indication that the U.S. job structure retains a large segment of jobs that are relatively undemanding in terms of general cognitive requirements, as well as school skills.
4.3 Required education
The level of education required to perform a job, as distinct from the job-holder’s personal educational attainment, is a final measure of general human capital requirements in STAMP.
Required education and the other cognitive skill mea-sures are mutually complementary, as each provides infor-mation absent in the other. The questions on reading, writ-ing, math, and problem solving tasks cover much of the general literacy and cognitive skills domain but they are not exhaustive, whereas required education is an omnibus measure that captures all education-related cognitive skills but lacks specificity. The literacy tasks elaborate the ways in which education is used on the job and potentially help explain why education has such large effects on wages and occupational attainment, while required education fills the gaps that remain in those batteries.
inter-personal and communication skills, and other kinds of cul-tural capital that are either produced or signalled by a given education level, quite apart from any cognitive skills not included in the STAMP literacy and problem solving mea-sures.
Nevertheless, a measure of job required education is dispensable because of the prominence of claims that in-equality growth in recent decades reflects an imbalance or mismatch between the demand for and supply of skills de-livered through education.8 Required education also
cor-relates consistently more strongly with workplace literacy tasks, problem solving, and wages than does personal ed-ucation, indicating it is a better measure of cognitive skill requirements than personal education even if it might also pick up some of the non-cognitive correlates of education that are rewarded in the labour market (Handel2008).9
One way to address the skill shortage claim is by com-paring the distributions of required and attained education. The picture is more complicated than the traditional skills shortage message suggests. The top panel of Table3shows that despite much talk of the disappearance of low-skill jobs, slightly more than half of all jobs require a high school education or less, while 27 % require a four-year college degree or more. The third column shows that in aggregate terms there is a significant surplus of jobs requir-ing only a high school education relative to the number of workers with that level of education. There is also a sur-plus of workers with some college education relative to the number of jobs requiring that level of education. The shares of workers and jobs at the BA level are in balance in aggregate terms, though not at the individual level (see below). Finally, while there is much discussion of the need for a highly educated workforce, 10 % of workers reports having more than a four-year degree but only 6 % reports that their job requires that much education.
This last point is significant because the expectation is that if there is any bias in responses it is in the direction of self-enhancement; few people are motivated to report holding jobs below their level of education. One possible explanation for these results is that respondents themselves recognize some kind of credentialism exists on their job. An advanced degree may be required for job entry or pro-motion but not for performing the work itself, which may be the case for some kinds of masters degrees. There may also be mismatches between supply and demand that force people to work outside the field in which they studied or to remain under-utilized within it. However, neither of these
8 These debates and available evidence are reviewed in Handel (2003b,
2005b).
9 In general, correlations between cognitive job tasks and required
ed-ucation are 0.10 higher than the corresponding correlations between those tasks and workers’ personal education.
explanations nor the basic result itself is consistent with the dominant skills shortage thesis, which would not predict an over-supply of highly educated workers.
The bottom panel of Table 3 calculates rates of (mis) match at the individual level and reveals even higher rates of over-education. Approximately 30 % of the work force is over-educated in the sense that they hold jobs requiring less education than they have attained. One might expect that young workers still searching for career jobs and some older workers nearing retirement or semi-retired might hold jobs below their abilities as a temporary, life-cycle circum-stance. In fact, the proportion that is over-educated re-mains little changed when the sample is restricted to work-ers aged 30–59. Although a longitudinal pwork-erspective might show significant outflows from overeducation within indi-vidual careers, these would presumably be offset by inflows into overeducation to produce the cross-sectional results for prime-aged workers observed here.
The greatest source of mismatch are those with some college education, nearly half of whom work in jobs re-quiring only high school (42 %) or less than high school (5 %) (not shown). This group accounts for 44 % of the over-educated. Among those with a four-year college de-gree, nearly a third hold jobs with lower educational re-quirements. Among those with some graduate education, about one-half work in jobs that they report requires less education (not shown).
It should be noted that what appears to be over-educa-tion may represent rough matching that is masked by the coarseness of the education categories. Both persons and jobs within a given education category are heterogeneous. Workers who appear mismatched may be at the lower end of the skill distribution within their education group or work-ing outside of their field of study, and their jobs may be at the upper end of the skill distribution for the (lower) level of education in which the jobs are classified. In this case, the degree of actual skill mismatch may be much smaller than appears, though it should be noted that this is not the explanation for observed mismatch in developing countries participating in the World Bank’s STEP survey (Handel et al.2016).
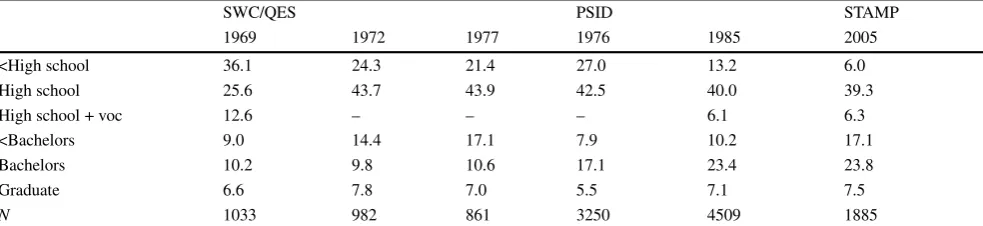
Table 4 Trends in education required by job 1969–2005 (percentage)
SWC/QES PSID STAMP
1969 1972 1977 1976 1985 2005
<High school 36.1 24.3 21.4 27.0 13.2 6.0
High school 25.6 43.7 43.9 42.5 40.0 39.3
High school + voc 12.6 – – – 6.1 6.3
<Bachelors 9.0 14.4 17.1 7.9 10.2 17.1
Bachelors 10.2 9.8 10.6 17.1 23.4 23.8
Graduate 6.6 7.8 7.0 5.5 7.1 7.5
N 1033 982 861 3250 4509 1885
Note: Samples are restricted to workers over 25 working at least 20 h per week for comparability. All figures are percentages calculated using sampling weights, excluding final row
Sources: Author’s tabulations from Survey of Working Conditions (1969), Quality of Employment Surveys (1972, 1977), and Panel Study of Income Dynamics (1976, 1985), Survey of Skills, Technology, and Management Practices (2005)
Some additional insight into the skill profile of U.S. jobs can be gained by comparing the current distribution of job educational requirements to historical figures. To my knowledge, there are only five previous national surveys of the U.S. workforce with comparable data: the three waves of the Quality of Employment Survey (QES) (1969, 1972, 1977) and two waves of the Panel Study of Income Dy-namics (PSID) (1976, 1985). Splicing these series together and adding STAMP results gives some rough indication of the pattern of change over 35 years. Although efforts were made to make the samples as consistent as possible and the QES and PSID were both conducted by the same survey re-search centre, there are always hazards in trying to combine data sets in this way, as will be apparent.
Table4shows a sharp decline in the share of jobs requir-ing less than a high school degree between 1969 and 1985, and a further decline between 1985 and 2005. The pro-portion of jobs requiring a high school education declined modestly between the 1970s and 1985, and has remained essentially constant since then. Taking the three non-col-lege categories together as a group, it appears that they declined from 74.3 % in 1969 to 59.3 % in 1985, an an-nual rate of –0.94 percentage points, and declined further to 51.6 % in 2005, as the annual rate of decline decelerated to –0.39 percentage points.
Conclusions regarding trends in jobs requiring some college are clouded by inconsistencies between the QES and PSID. The share of jobs requiring a four-year col-lege degree increased in the 1970s and early 1980s, and has remained essentially constant since then. Combin-ing these two groups also suggests a deceleration in the annual growth of jobs requiring college education: 0.90 (1969–1985) vs. 0.37 (1985–2005). Even more striking, the share of jobs requiring post-graduate work has re-mained roughly constant for the entire period 1969–2005. Although comparing samples across surveys requires cau-tion, there is little support for the idea that skill upgrading has proceeded at an especially rapid pace in recent years.
4.4 Specific human capital – experience, learning times, and training
The final area of cognitive skills demands is job-specific, in contrast to the measures of general cognitive requirements described above. By its very nature, job-specific demands are difficult to measure on a common scale in a general labour force survey. They are measured partly by the 6.3 % of workers who said the education required for their job in-cluded vocational education (Table4). In addition, STAMP measured specific human capital outside of education as required years of prior experience in related jobs, learning time on the current job, and employer-provided training in the prior three years. Although increasing returns to ex-perience was one dimension of rising wage inequality in the U.S., and greater firm-provided training might be one expected aspect of rising job skill requirements, in practice neither has figured prominently in recent research. Indeed, one study using one of the few consistent time series data on training in the U.S. found it did not contribute to ris-ing inequality (Constantine and Neumark 1996). In the STAMP paradigm, these measures capture the diversity of innumerable specific job requirements in comparable terms as scalars using time spent as the common unit.
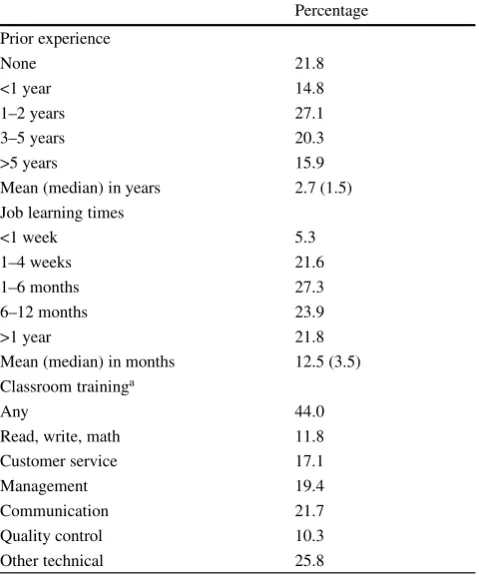
Table 5 shows that the median length of required prior experience in related jobs is 1.5 years (mean = 2.7 years) and the median time required to learn one’s job is 3.5 months (mean = 12.5 months). These figures do not appear very large on their face, but evaluating their magnitudes is difficult in the absence of historical data or some other reference point. In theory, prior experience and on-the-job learning may substitute for general human cap-ital requirements, but the correlations between educational requirements and both required prior experience (0.35) and (ln) learning times (0.41) indicate they are more often complements than substitutes in practice.
previ-Table 5 Specific human capital – required prior experience in related jobs, job learning times, and formal training provided by employers
Percentage Prior experience
None 21.8
<1 year 14.8
1–2 years 27.1
3–5 years 20.3
>5 years 15.9
Mean (median) in years 2.7 (1.5) Job learning times
<1 week 5.3
1–4 weeks 21.6
1–6 months 27.3
6–12 months 23.9
>1 year 21.8
Mean (median) in months 12.5 (3.5) Classroom traininga
Any 44.0
Read, write, math 11.8
Customer service 17.1
Management 19.4
Communication 21.7
Quality control 10.3
Other technical 25.8
aFormal classroom training paid or provided by employers in the
previous three years
ous three years. Consistent with previous research, training tended to be associated with jobs that already required more education (r = 0.31) and longer learning times (r = 0.25), but is more weakly associated with related job experience requirements (r = 0.12), perhaps because they are some-times functional substitutes. As might be expected, more occupationally-specific kinds of training, such as customer service and quality training, were not associated with ed-ucational requirements. It is not clear that there are truly comparable data from earlier periods to perform trend anal-yses, but these figures provide a benchmark for any future work. One notable finding is that despite all of the discus-sion of the emphasis on quality control, this was the least common form of employer-provided training, undertaken by only 10 % of the workforce in the previous three years.
4.5 Interpersonal and physical job demands
Interpersonal demands The shift from a manufacturing to a service economy, as well as the increased use of teams, has focused attention on the interpersonal demands of work (e. g. Reich1991). However, some research suggests that interpersonal skills are not rewarded in the labour market in the form of higher wages (Glomb et al. 2004),
rais-ing the possibility that they are marginal to current debates on inequality trends. This may also reflect difficulties in measuring levels of interpersonal skill demands, not least because the domain is very heterogeneous and poorly de-fined (Handel 2008). Pretests for STAMP also confirmed suspicions that this domain is subject to substantial yea-saying bias among respondents; people are prone to affirm the importance of “people skills” regardless of differences in the content of their jobs.
Indeed, Table6indicates that relatively high proportions of workers responded positively to several items. The most notable exception is the question on whether respondents gave formal presentations lasting at least 15 minutes as a regular part of their jobs. Nearly 60 % of managers and professionals give presentations, but only 10–20 % of work-ers in the other occupational groups do so. As would be expected, blue-collar workers are also much less likely to have contact with the public than other groups.
Physical demands Recent discussions regarding the labour market prospects of less educated workers argue that cognitive and interpersonal job requirements are gen-erally high, as also argued by a longstanding theme in the sociology of post-industrialism. A concomitant argument is that physical job demands are relatively low given the declining share of blue-collar manufacturing jobs and the increasing use of advanced technology within remaining manual jobs (Bell1973; Zuboff1988; Reich1991).
Table 6 confirms expectations that blue-collar jobs re-quire more standing, heavy lifting, eye-hand coordination, and overall physical demands than white-collar jobs, but service jobs are not far behind on many measures. Al-though there is little comparable historical data on phys-ical demands, these tasks are concentrated in occupations and industries that have been declining over time, which is consistent with post-industrial and related theories of job trends.
4.6 Conclusion
Table 6 Interpersonal and physical job demands
All Upper WC Low WC Upper BC Low BC Service
Interpersonal (α= 0.72)
Give information 92 98 94 86 85 81
Counsel people 37 50 28 28 26 38
Deal w/tense situations 60 65 60 51 49 65
Teach or train people 75 86 69 75 67 67
Interview people 18 30 16 7 6 9
Presentations >15 min 32 57 20 17 11 17
Public contacta 3.04 3.69 3.45 1. 94 1.60 2.79
Importance levelb 7.40 8.79 8.31 5.01 4.21 6.88
Physical (α= 0.79)
Stand≥2 h 67 52 58 90 80 90
Lift/pull≥50 lbs 36 19 27 73 60 48
Good coordination 57 43 42 89 78 75
Physical demandsc 4.59 3.46 3.67 6.67 5.98 6.23
Note: Figures are percentages responding positively (1 = yes) unless noted
aFrequency of contact with people other than co-workers, such as customers, clients, students, or the public lasting 15 min or more (0 = none, 1 =
<1 per week, 2 = 1 per week, 3 = few times per week, 4 = 1 per day, 5 = >1 per day)
bSelf-rated importance of working well with customers, clients, students, or the public on respondent’s job (0–11) cSelf-rated physical demands of job (0 = not all physically demanding, 10 = extremely physically demanding)
not seen since the late 1960s and the absorption of large numbers of former welfare recipients and unskilled immi-grants during and after this period. There appears to be plenty of less skilled jobs remaining in the U.S. economy, and a significant number still require substantial physical labour. Only further monitoring of future trends will de-termine whether this situation persists and the rate of any change from current levels.
5 Technology use
5.1 Computers
No development has received more attention in the labour economics literature on inequality growth than the spread of computer use at work. The dominant explanation for inequality growth among labour economists across the de-veloped world is that exogenous, skill-biased technologi-cal change combined with an inadequate supply response caused the growth in demand for human capital to outpace the growth in supply, raising the returns to education.
The exact causal argument relating computers to skills and wages remains somewhat unsettled but several path-ways have been proposed and investigated. The wage pre-mium for computer use has been seen as evidence that computer hardware and software are complex and require a significant training investment, for which users are com-pensated in the labour market (Krueger 1993; Borghans and ter Weel2004; Dickerson and Green2004; Dolton and Makepeace2004). Others argue that computers may not be
complex or difficult to learn in themselves, but may require more of the general cognitive skills discussed above and additional skills entailed by complementary employee in-volvement practices (Levy and Murnane1996; Autor et al.
2002; Bresnahan et al. 2002; Shaw 2002, Spitz-Oener
2006). Technology may also alter the occupational com-position of the workforce without altering the task content of jobs themselves, as in the automation and elimination of manual jobs.
Employee involvement and technological displacement are discussed in subsequent sections, while the effects of computers on literacy and other cognitive skills is a com-plex modelling issue to be addressed in a subsequent pa-per.10 The aim here is simply to measure the incidence of
various kinds of computer-related tasks and the likely lev-els of complexity involved in using this software in the narrow sense, i. e., the cognitive complexity of computer technology itself.
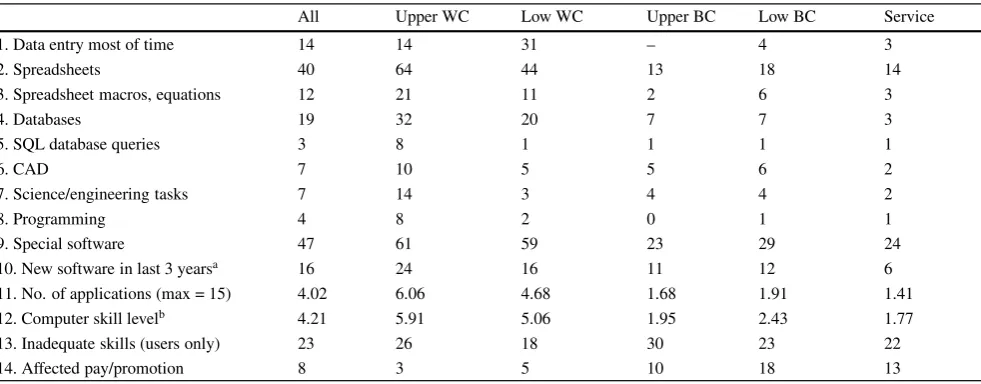
STAMP asked twenty-seven questions related to com-puter use, particular applications, functions, and levels of task complexity, as well as self-reported user competence in using computers. About 70 % of STAMP respondents reported using a computer at work at least a few times per week. Table7presents a selection of further results, most of which are calculated over the total sample (users and non-users). An unexpectedly large proportion of clerical and sales workers report spending most of their time doing data entry or filling out forms (31 %), which is suggestive
10 For earlier discussions of these issues, see Handel (2003a, 2004,
Table 7 Computer use
All Upper WC Low WC Upper BC Low BC Service
1. Data entry most of time 14 14 31 – 4 3
2. Spreadsheets 40 64 44 13 18 14
3. Spreadsheet macros, equations 12 21 11 2 6 3
4. Databases 19 32 20 7 7 3
5. SQL database queries 3 8 1 1 1 1
6. CAD 7 10 5 5 6 2
7. Science/engineering tasks 7 14 3 4 4 2
8. Programming 4 8 2 0 1 1
9. Special software 47 61 59 23 29 24
10. New software in last 3 yearsa 16 24 16 11 12 6
11. No. of applications (max = 15) 4.02 6.06 4.68 1.68 1.91 1.41
12. Computer skill levelb 4.21 5.91 5.06 1.95 2.43 1.77
13. Inadequate skills (users only) 23 26 18 30 23 22
14. Affected pay/promotion 8 3 5 10 18 13
Note: All statistics are percentages except lines 11 and 12. All calculation use full sample except lines 13 and 14
SQLstructured query language,CADcomputer-aided design
aRespondents were asked whether in the last three years they had to learn any new computer programs or functions that took more than a week to
learn
bSelf-rated complexity of computer skills used on job (0 = no computer use, 1 = very basic, 11 = very complex)
of deskilling, but this is very atypical for the workforce as a whole. A large proportion of all workers use spread-sheets (40 %), but a much smaller group uses more complex functions like macros and equations (12 %); presumably, spreadsheets are used simply as electronic ledgers by most workers. Similarly, while nearly 20 % use databases, only 3 % program or write queries using the computer language SQL. Between 5 and 10 % of the workforce uses com-puters for CAD, high-level quantitative analysis (scientific or engineering calculations, simulations, statistics), or pro-gramming using a computer language such as C++, Java, Perl, and Visual Basic. In general, these tabulations suggest most people use computers for fairly mundane office duties rather than very complex tasks.
At a more summary level, the average number of plications used on the job is four out of the fifteen ap-plications queried, which includes a catchall question on whether the respondent uses a customized or special pro-gram found mostly in their specific line of work. Not sur-prisingly, given that computers are most effective at pro-cessing information and assisting white-collar work, man-agers/professionals and clerical/sales workers use more ap-plications (5–6) than blue-collar and service occupations (<2). Both groups of white collar workers are also more likely to use software applications specific to their line of work (~60 %) compared to the other occupational groups (~25 %).
It has become a truism that in the information age noth-ing is constant except change and workers are engaged in continuous learning in the workplace. However, there are no real estimates of the rate of technological change as it
af-fects skill requirements. In fact, relatively few people have had to spend more than one week learning new software within the previous three years (16 %), though again, there is a slight occupational gradient, as somewhat more up-per white collar workers (24 %) exup-perienced new software introductions in this timeframe.
About one-quarter of computer users report that they do not have all the computer skills needed to do their job well. However, a relatively small proportion of the total workforce (users and non-users), eight percent, report that lack of computer skills has affected their chances of getting a job, promotion, or pay raise, though the figure is some-what larger for lower blue-collar workers. Individuals seem quite willing to report that their computer skills could use improvement, but these particular shortfalls do not seem to be serious hindrances for most people’s career advance-ment. This is roughly consistent with employers’ reports of the level of computer skill deficits they observe, but lack of comparability among data sources prevents great certainty (Teixeira 1998, p. 3). These results are not supportive of the view that a shortage of computer-specific human capital is a prime candidate for explaining widening wage inequal-ity, but this conclusion must be considered tentative in the absence of more detailed analyses.
5.2 Non-computer technology
Table 8 Mechanical and other technology
All Upper WC Low WC Upper BC Low BC Service
Machine technology
1. Heavy Machinery 20 7 11 65 46 12
2. Maintenance 10 3 1 41 21 10
3. Repair 8 3 1 35 16 7
4. Machine set-up 12 4 4 41 29 8
5. Use machine tools 4 1 1 12 14 2
6.Use NC/CNC 2 – – 3 9 –
7.Program NC/CNC 1 – – – 6 –
8. Operate robots 1 – 1 2 3 –
9. Program robots – – – 1 1 –
10. PLCs 2 1 – 6 4 –
11 CPC 4 3 2 14 12 –
12.Program CPC 1 1 – 4 3 –
13. Automated equipment 5 2 2 9 19 1
14. Assembly line 2 – 1 5 12 –
15. New machinery in 3 yrs 10 4 4 32 23 6
16.Learning time >1 week 4 1 2 13 12 1
17. Mechanical Skill Levela 2.50 1.73 1.38 5.97 4.55 2.12
18. Electronics Skill (1 = yes) 13 12 8 33 15 9
Note: All figures are percentages except line 17. Blank cells have rounded values less than 1 %
NCnumerically-controlled machine tool (1 = yes),CNCcomputer numerically-controlled machine tool (1 = yes),PLCprogrammable logic controllers (1 = yes),CPCcomputer process control (1 = yes)
aMechanical skills: 0 = very basic, 10 = very complex
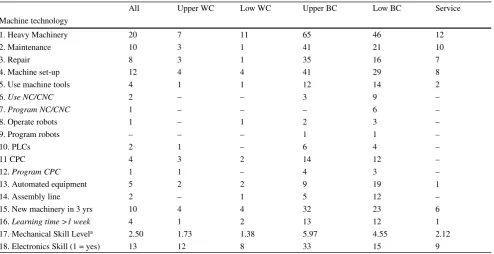
widespread deskilling, on the one hand, and skill upgrading as the result of employee involvement practices and incor-poration of programmable microelectronics, on the other. STAMP’s questions on the use of heavy machines and in-dustrial equipment tried to capture the different faces of work with non-computer machinery: traditional craft skills (e. g., machine set-up, maintenance, repair), newer high-technology skills (e. g., programmable automation technol-ogy), and deskilled tasks (e. g., machine tending, assembly line work).
Table 8 shows that only 20 % of the work force uses heavy machines and industrial equipment, not surprisingly concentrated among blue-collar workers. How many of these jobs require craft skills, restrict employees to the most deadening kind of deskilled labour, or bring produc-tion work into the informaproduc-tion age?
Despite claims that employee involvement has led to sig-nificant sharing of traditional craft tasks with less skilled blue-collar workers, activities such as routine maintenance, repair, and machine set-up (Table8, rows 2–4), remain sig-nificantly more common among skilled blue-collar workers. Likewise, despite the great attention given to machining as a traditional craft and various kinds of modern automa-tion (rows 5–13), few workers in any broad occupaautoma-tional group use machine tools or any kind of automated produc-tion equipment on their jobs. It is not necessarily surprising that few production workers use or interface with automated
equipment, as the elimination of labour is one goal of au-tomation. Nevertheless, it is important to recognize that most remaining production jobs do not have a high-tech character because they are in contexts in which the intro-duction of computerized processes has made fewer inroads. By the same token, despite the historic attention given to assembly line work, only 12 % of less skilled blue-collar workers report working under those conditions (row 14). In general, the task content of jobs involving machinery and heavy equipment conform to neither the extreme deskilling nor the optimistic upgrading scenarios.
About a third of skilled blue-collar workers and a quarter of less skilled blue-collar workers started using new equip-ment or machinery in the previous three years (row 15) and about 12–13 % had to spend more than a week learning the new technology (row 16). Despite all the talk about the speed of change in the information economy compared to the industrial economy, this rate of learning for new machinery and equipment is comparable to that for new software introductions among lower white-collar workers (Table7, row 10). Only upper white-collar workers experi-ence somewhat higher rates of new technology learning.
sig-Table 9 Employee involvement practices
All Upper WC Low WC Upper BC Low BC Service
1. Job rotation 53 43 64 48 60 57
2. Pay for skill 10 6 11 8 16 16
3. TQM/QC 20 22 21 17 19 15
4. Team membera 26 27 21 28 25 26
Team functions:(α= 0.69)
5. Job assignmenta 20 22 17 26 17 22
6. Task schedulinga 18 21 14 19 15 19
7. Worker schedulinga 9 7 8 14 10 13
8. Changing methodsa 18 20 15 22 19 16
9. New equipmenta 18 19 14 25 18 17
10. Selecting leadera 8 10 5 13 8 4
11. Qualitya 17 19 13 19 18 13
12. Cost, productivitya 11 12 11 14 12 9
13. Cross-communicatea 20 22 17 21 19 17
14. Performance reviewa 11 11 9 17 10 13
15. # of team functionsa 1.41 1.49 1.21 1.81 1.44 1.26
16. # of team functionsb 5.77 5.63 5.79 6.56 5.75 5.51
Note: All figures are percentages except lines 15 and 16. Unless noted, all statistics based on full sample.TQMTotal Quality Management,
QCquality circle
Cronbach’sαfor team items calculated on sub-sample of team members only. Team functions (items 5–16) were dichotomized for this table such that 0 = no involvement and 1 = team either suggests or decides on its own
aEmployees in self-reported management positions were ineligible for this item and coded as zero for calculations bStatistics based on sub-sample belonging to teams
nificantly higher in blue-collar than white-collar occupa-tions. In addition, less than 15 % of the overall workforce requires a good knowledge of electronics, but the figure is significantly higher for skilled blue-collar workers (33 %). Further research is needed to understand the depth of this knowledge. Overall, microelectronic hardware seems not to have affected skill requirements for most jobs, with the possible exception of skilled blue-collar jobs.
5.3 Employee involvement practices
A number of researchers have argued that the spread of in-formation technology and more rapidly changing markets have resulted in downward delegation of decision making responsibilities formerly belonging to supervisors and staff in order to shorten decision times and improve quality (Pi-ore and Sabel1984; Zuboff 1988; Osterman 2000; Bres-nahan et al. 2002). These organizational changes known as employee involvement (EI) practices are the third ma-jor pillar of recent debates regarding the changing nature of work because they are assumed to raise cognitive and interpersonal skill requirements (for a review of their wage effects, see Handel and Levine2004).
Concretely, EI is generally conceived to involve practices like job rotation and cross-training on different jobs to in-crease task variety and flexibility, pay linked to incremental skills acquisition, and participation in quality improvement
initiatives involving analytic techniques and group prob-lem-solving. In its most advanced form, work is organized around self-directed teams that take on numerous supervi-sory and staff functions.
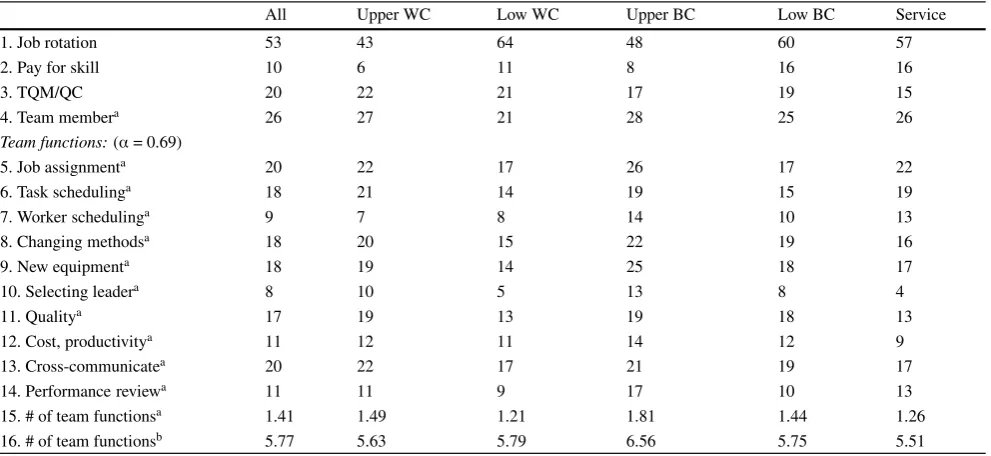
Table 9 shows that slightly over half of the workforce engages in some kind of job rotation or cross-training, also known as multi-skilling.11 The magnitude of learning
in-volved is difficult to evaluate, as it is possible many work-ers are required to know multiple simple jobs, but it does suggest most jobs require functional flexibility. However, explicit pay-for-skill programs that represent the fullest ex-pression of cross-training practices are relatively uncom-mon (10 %). Likewise, only 20 % of the workforce is engaged in a formal quality control program and about one-quarter of all workers belongs to a self-directed work team, suggesting limited penetration of EI principles even after several decades of discussion and advocacy among researchers and management figures (Appelbaum and Batt
1994). The average team performs a little less than six of the ten functions measured in the STAMP survey, but this drops to less than 1.5 tasks if averaged over the entire work-force. Not surprisingly, teams were less likely to perform
11 Cross-training is a familiar term in human resource management