O R I G I N A L A R T I C L E
Open Access
Who bears the cost of the business cycle?
Labor-market institutions and volatility of the
youth unemployment rate
Daiji Kawaguchi
1*and Tetsushi Murao
2* Correspondence: kawaguchi@econ.hit-u.ac.jp 1Research Institute of Economy Trade and Industry, Tokyo Center for Economics Research, Institute for the Study of Labor (IZA),
Hitotsubashi University, Tokyo, Japan
Full list of author information is available at the end of the article
Abstract
The way age-specific unemployment rates fluctuate over the business cycle differs significantly across countries. This paper examines the effect of labor-market institutions on the fluctuations of age-specific unemployment rates based on panel data of 18 OECD countries between 1971 and 2008. Empirical results suggest that the cost of the business cycle disproportionately falls on youths in countries with stricter employment protection. This implies that a higher adjustment cost of an existing workforce induces the employment adjustment of new entrants into the labor market.
JEL codes:E24, J80
Keywords:Unemployment, Labor market institutions, Business cycle, OECD
1. Introduction
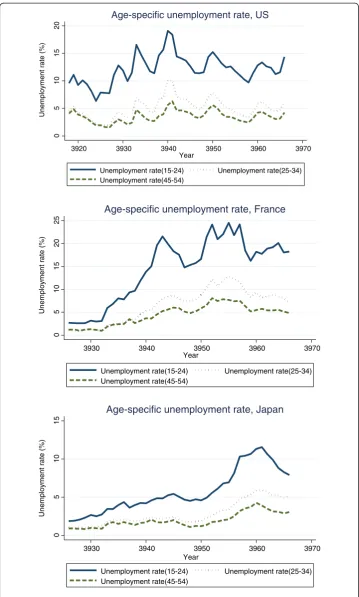
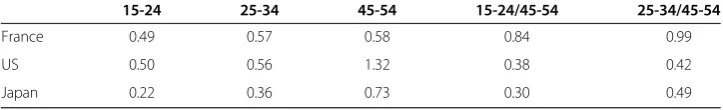
Although the unemployment rate fluctuates in line with the business cycle, the fluc-tuation of age-specific unemployment rates differs significantly across Organization for Economic Co-operation and Development (OECD) countries. The way age-specific un-employment rates fluctuate over the business cycle significantly differs across the US, France, and Japan, as shown in the time-series plot for the 1960-2008 period in Figure 1. First, youths’(15-24) and adults’(45-54) unemployment rates move in paral-lel in the US. Business-cycle fluctuations seem to be absorbed equally across genera-tions. Second, youths’ unemployment rate fluctuates more sharply than adults’ unemployment rate in France. This implies that employment adjustments occur more often for youths than for adults in France. The Japanese trend lies somewhere between those of the US and France. Shocks to the economy are equally absorbed by genera-tions in the US, while they are intensively absorbed by younger generagenera-tions in France. To see the heterogeneity of the age distribution of unemployment-rate volatility, adjusting for differences in the levels of unemployment rates by age groups, Table 1 reports the coefficient of variation of unemployment rates for these three countries. Again, we find that youths’ unemployment-rate volatility relative to adults’ employment-rate volatility is higher in France than in the US or Japan.
What factors cause this international difference in the responses of age-specific un-employment rates over the business cycle? Answering this question is particularly
© 2012 Kawaguchi and Murao; licensee Springer. This is an Open Access article distributed under the terms of the Creative Commons Attribution License (http://creativecommons.org/licenses/by/2.0), which permits unrestricted use, distribution, and reproduction in any medium, provided the original work is properly cited.
0
5
10
15
20
Unemployment rate (%)
3920 3930 3940 3950 3960 3970
Year
Unemployment rate(15-24) Unemployment rate(25-34) Unemployment rate(45-54)
Age-specific unemployment rate, US
0
5
10
15
20
25
Unemployment rate (%)
3930 3940 3950 3960 3970
Year
Unemployment rate(15-24) Unemployment rate(25-34)
Unemployment rate(45-54)
Age-specific unemployment rate, France
0
5
10
15
Unemployment rate (%)
3930 3940 3950 3960 3970
Year
Unemployment rate(15-24) Unemployment rate(25-34)
Unemployment rate(45-54)
Age-specific unemployment rate, Japan
important to address policy makers’concerns about the continuing high unemployment among youth across OECD countries after the 2008 financial crisis. The press release by OECD in advance of the G20 Labor Ministers Meeting in Mexico on 17-18 May 2012 points out that the youth employment rate is higher than the general unemploy-ment rate, citing examples of Greece and Spain, where youth unemployunemploy-ment is three times higher than general unemployment rate.1 Pointing to longer-term consequences of youth unemployment, OECD recommends that governments expand job-search as-sistance, apprenticeship and other vocational training programs, and employment sub-sidies for youth. It also recommends reducing the gap of employment protection between permanent and temporary workers, and setting minimum wage not too high. Although these policy recommendations are likely to be effective for alleviating youth unemployment problems, determining why the burden of negative economic shock falls disproportionately on youth in some countries in the first place can contribute to re-moving the causes of youth unemployment.
Previous literature shows that the youths’unemployment rate is more cyclically sensi-tive than that of adults (Clark and Summers 1981, Alba-Ramirez 1995, Rios-Rull 1996, Gomme et al. 2005, Bertola et al. 2007 and Jaimovich and Siu 2009). Many theoretical and empirical investigations also account for higher unemployment rates for youths than for adults. Research indicates that stricter employment protection or a higher unionization rate raises the unemployment rate in general (e.g. Lazear 1990). These rigid labor-market institutions particularly raise youths’unemployment rate relative to adults’(Lazear 1990, Canziani and Petrongolo 2001, Rodriguez-Palenzuela and Jimeno-Serrano 2002, Bertola, Blau and Kahn 2007, Kahn 2007, Leonor 2008). These prior studies examine how employment protection or wage-setting institutions affect the re-spective unemployment rates of youths and adults. In other words, these studies exam-ine the long-run effect of employment protection or wage-setting institutions on the unemployment rate of youths relative to that of adults.
To the best of our knowledge, none of the existing studies examine why the fluctua-tions of age-specific unemployment rates differ across countries. It is important to study which age groups of workers absorb the short-run macroeconomic shocks from the point of view of inter-generational risk-sharing. Economies where younger genera-tions disproportionately absorb macroeconomic shocks place a greater burden of the business cycle on youths, who presumably have a lower capacity for absorbing risks be-cause they hold less asset than other age groups, on average. Neumark (2002), Wachter and Bender (2006) and Genda et al. (2010) report that the employment status of youths has prolonged effects on labor-market outcomes in the long run because of the hyste-resis. Thus, short-run macroeconomic shocks experienced when workers are young may well have a considerable long-run effect on their welfare, and workers belonging to different birth-year cohorts may have significantly different levels of welfare in an
Table 1 Coefficient of variation of the age-specific unemployment rate in three countries
15-24 25-34 45-54 15-24/45-54 25-34/45-54
France 0.49 0.57 0.58 0.84 0.99
US 0.50 0.56 1.32 0.38 0.42
Japan 0.22 0.36 0.73 0.30 0.49
Kawaguchi and MuraoIZA Journal of Labor Policy2012,1:10 Page 3 of 22
economy where short-run macroeconomic shocks are absorbed disproportionately by young workers.
This paper explores the extent to which labor-market institutions, such as the degree of employment protection, affect heterogeneous responses of age-specific unemploy-ment rates to macroeconomic shocks. We derive empirical predictions from a theore-tical model and test them using panel data of the unemployment rate of 18 developed countries spanning the 1971-2008 period. By regressing changes of age-specific un-employment rates on the overall unun-employment rate, the heterogeneity of responses of age-specific unemployment rates to a macroeconomic shock is estimated. We further examine how this heterogeneity depends on various labor-market-institution indexes, originally published by OECD and extended by other sources.
Our results indicate that stricter employment protection amplifies the effect of the cyclical unemployment rate on youths’unemployment rate. This implies that the cost of the business cycle falls disproportionately on youths in the countries with stricter employment protection. A higher replacement rate for unemployment insurance bene-fits seems to mitigate the cyclical sensitivity of youth unemployment rates.
The rest of this paper is organized as follows. Section 2 lays out a theoretical model to derive empirical predictions on how labor-market institutions affect unemployment rates of different age groups in different ways. Section 3 discusses the empirical stra-tegy. Section 4 describes our data. Section 5 reports the empirical results, and Section 6 provides conclusions.
2. Theoretical background
In this section, we introduce a theoretical model that analyzes firms' employment po-licies in a dynamic setting when the adjustment of labor input is costly.
We consider a firm that operates infinitely, discounting future profit with a discount factor. The firm produces output using LYt young workers, and LOt adult workers as inputs. Young and adult workers are combined by the constant elasticity of substitution (CES) production technology with the elasticity of substitutionσ= 1/1(1−ρ):
Yt¼At LρYtþL
ρ
Ot
1 ρ;ρ≤1;
whereAtis the total factor productivity, which takes either a high or low value and fol-lows a first-order Markov process. We denote transition probabilities asPH|H,PL|H,PH|L, PL|L, wherePj|jstands for the probability of transition from stateitoj. Hence, the firm has an incentive to adjust employment, responding to productivity realization in each period. We assume that the number of young workers in the previous period becomes the number of adult workers at the beginning of a period. The firm bears the labor-adjustment costs for changing the number of adult employees from this initial value, as well as for hiring the young workers.
Given the wage rate of young workersWYt,and adult workersWOt,its profit in period tis represented as follows:
πt ¼At LρYtþL
ρ
Ot
1 ρW
YtLYtWOtLOtαðLOtLYt1Þ2γð ÞLYt 2;
employment-protection legislation (EPL) and opposition to the labor adjustment by labor unions are all captured by a higher value of α. In contrast, a generous unemployment-insurance system may well reduce adjustment costs because existing workers are willing to be unemployed.
In the above setting, the firm’s employment policy must be consistent with the fol-lowing Bellman equations, with the current-state variables (At,LYt-1).
V A;LY;1
¼A LρYþLρO 1
ρW
YLYWOLOα LOLY;1 2
γð ÞLY 2þβΕV Að 0;LYÞ;
where LY,-1 is the number of youths employed in the previous period (for the initial period, it is the number of old workers, which is exogenously given), β is a discount factor, andA0is productivity realization in the next period.
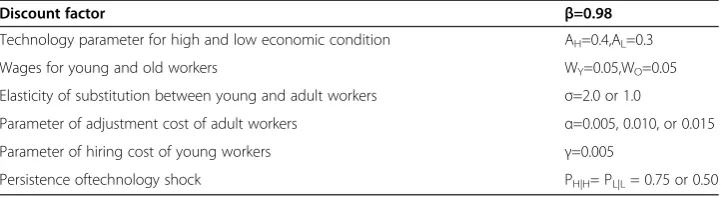
We solve the model numerically with the parameters in Table 2 and simulate the economies for 10,000,000 periods. Specifically, we conduct them with three different sets of (σ,Pi|i), each of which is calculated with three different values of α. The lower substitutability between young and adult workers (lowerσ) tends to suppress the vola-tility of both youth and adult employment because the two factors become comple-mentary in production and firms attempt to balance these two inputs. The lower persistence of the shock (Pi|i) also tends to suppress the volatility of youth employment, because the current shock is less likely to carry over into the next period and firms can-not save adjustment costs in the next period by swinging youth employment today.
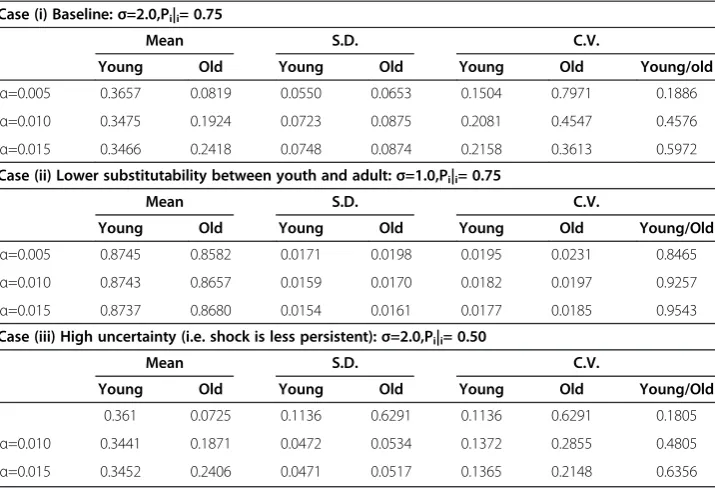
We calculate the mean, standard deviation, and coefficient of variation (CV) of the simulated paths of youth and adult employment. Then, we calculate the relative CV be-tween young and adult workers. Results are presented in Table 3. In the table, all three cases (i)-(iii) show that with higher α, the relative CVs of the young workers mark a higher value. That is, the higher adjustment cost of existing workers makes firms adjust labor input by reducing new hires from the labor market. As expected, young and old employment becomes less volatile in cases of the lower substitutability of youth and adult workers (lower σ) and higher uncertainty (lower Pi|i), as evidenced by lower standard deviations for both cases.
More volatile labor demand for youths leads to higher volatility of youths’ unemploy-ment rate, with some degree of rigidity in the wage setting. To capture the heteroge-neity of wage rigidity across countries, we control for the difference in wage-setting institutions. In the following empirical sections, we test whether the higher adjustment costs of adult workers as compared with young workers results in a higher volatility of youths’employment relative to that of adults.
Table 2 Parameters of the dynamic stochastic labor-adjustment model
Discount factor β=0.98
Technology parameter for high and low economic condition AH=0.4,AL=0.3
Wages for young and old workers WY=0.05,WO=0.05
Elasticity of substitution between young and adult workers σ=2.0 or 1.0
Parameter of adjustment cost of adult workers α=0.005, 0.010, or 0.015
Parameter of hiring cost of young workers γ=0.005
Persistence oftechnology shock PH|H= PL|L= 0.75 or 0.50
Kawaguchi and MuraoIZA Journal of Labor Policy2012,1:10 Page 5 of 22
3. Empirical strategy
Theoretical predictions in the previous section emphasize the role of adjustment costs on the labor-demand fluctuation by age group. The adjustment cost depends on various labor-market institutions. Stricter employment-protection legislation increases the legal cost of employment adjustment. Higher union density also may increase the adjustment cost, because union workers request higher compensation for employment adjustments backed by their strong bargaining power. In contrast, a generous unemployment insu-rance system may well reduce the adjustment cost, because a worker who currently holds a job does not have to go through hardship before landing a new job when he is fired.
The degree to which the labor-demand fluctuation is transmitted to the unemployment rate fluctuation depends on wage rigidities. Thus wage-setting institutions, which differ across countries, may well affect unemployment rates by age group. Hence, we control for wage-setting institutions as well.
Shock to the labor market is approximated by the unemployment rate defined over all age groups, and the relation between the overall unemployment rate and the age-specific unemployment rate is examined. In particular, we specify a model as follows.
△
UEitage¼β0þ△
UEitoverallβ1þINSt1β2þ
△
UEitoverall△
UE————overallit
INSit1β3þ
△
Y POPit
β4þ
△
YA POPit
β5þc age
i þe
age
it ;
ð1Þ
where the age groups of 15-24, 25-34, and 45-54 are indexed by age; countries are indexed byi; years are indexed byt.;INSis the vector of seven labor-market institution indexes, which are normalized to mean 0 and standard deviation 1; Y/Popis the ratio
Table 3 Simulated employment level
Case (i) Baseline:σ=2.0,Pi|i= 0.75
Mean S.D. C.V.
Young Old Young Old Young Old Young/old
α=0.005 0.3657 0.0819 0.0550 0.0653 0.1504 0.7971 0.1886
α=0.010 0.3475 0.1924 0.0723 0.0875 0.2081 0.4547 0.4576
α=0.015 0.3466 0.2418 0.0748 0.0874 0.2158 0.3613 0.5972
Case (ii) Lower substitutability between youth and adult:σ=1.0,Pi|i= 0.75
Mean S.D. C.V.
Young Old Young Old Young Old Young/Old
α=0.005 0.8745 0.8582 0.0171 0.0198 0.0195 0.0231 0.8465
α=0.010 0.8743 0.8657 0.0159 0.0170 0.0182 0.0197 0.9257
α=0.015 0.8737 0.8680 0.0154 0.0161 0.0177 0.0185 0.9543
Case (iii) High uncertainty (i.e. shock is less persistent):σ=2.0,Pi|i= 0.50
Mean S.D. C.V.
Young Old Young Old Young Old Young/Old
0.361 0.0725 0.1136 0.6291 0.1136 0.6291 0.1805
α=0.010 0.3441 0.1871 0.0472 0.0534 0.1372 0.2855 0.4805
of 15-24 year-olds to 45-54 year-olds; and YA/POP is the ratio of 25-34 year-olds to 45-54 year-olds.
In equation (1), the coefficient on the overall unemployment rate of all ages identifies the impact of the overall change of the unemployment rate on the change of the age-specific unemployment rate. The coefficients on lagged labor-market institutions iden-tify the long-run effects of labor-market institutions, such as firing restrictions, on the age-specific unemployment-rate change. The coefficients on the interaction terms be-tween the labor-market institution index and the overall unemployment rate change identify how the effects of overall labor-market shock on age-specific unemployment rates depend on labor-market institutions, such as firing restrictions, unemployment in-surance, and wage-setting institutions.
Equation (1) includes the change of the fraction of the young and young adult popu-lation to the total popupopu-lation to allow for a possibility that young workers belonging to a cohort of a larger population size may have harder time finding a job, which is con-ceptualized as the cohort-crowding effect (Welch 1979, Korenman and Neumark 2000 and Shimer 2001).
Since the overall unemployment rate is the weighted average of age-specific un-employment rates, the overall unun-employment rate is an obvious endogenous variable. This endogeneity is circumvented by instrumenting the overall unemployment rate by the GDP growth rate lagged one year, relying on Okun’s law (Lee 2000). We estimate the above equation with a random-effect IV model, assuming unobservable heteroge-neitycagei is not correlated with the regressors.
In addition, we run regressions with the difference of the unemployment rate change by age group as dependent variables to quantify the difference of the coefficients across age groups.
△
UEityoung△
UEadultit
¼β0þ
△
UEoverallit
β1þINSt1β2þ
△
UEoverallit
△
UEoverallit
————
INSit1β3þ
△
Y POPit
β4þ
△
YA POPit
β5þc age
i þe
age
it ;
ð2Þ
The parameter β1 captures the excess sensitivity of the youth unemployment rate over the adult unemployment rate to the overall business cycle, captured by the change of the overall unemployment rate. The parameter vector β3 identifies if a particular labor-market institution amplifies the sensitivity of the youth unemployment rate over the adult unemployment rate to the overall unemployment rate.
4. Data
We build the cross-country time-series dataset from two sources. First, we draw age-specific and overall unemployment rates and population from the OECD Stat Extracts.2 Age groups of our concern are 15-24, 25-34, and 45-54. Second, we draw labor-market-institution indices from the CEP-OECD Institution Dataset, which is compiled by Center for Economic Performance of London School of Economics (Nickell 2006). This dataset is constructed on the basis of an earlier work by Nickell and Nunziata
Kawaguchi and MuraoIZA Journal of Labor Policy2012,1:10 Page 7 of 22
(2000), which is in turn based on the OECD Employment Outlook and other related research.
The CEP-OECD Institution Dataset contains the data of 20 OECD countries from 1960 to 2004. Based on the original data set, we construct our sample covering the 1971 to 2008 period of 18 countries, because some variables are not available for the whole period and all countries. Since there are no data of the union-coverage rate for Ireland and of population for Switzerland, we exclude these countries from the analysis. After 2005, employment protection legislation (EPL) and union coverage are extended, based on the OECD labor-market statistics database for the period until 2008. The Benefit Replacement Ratio of unemployment insurance is extended to 2007 based on Benefits and Wages: OECD Indicators to 2008.3For other institutional variables after 2005, the values of 2005 are extrapolated.
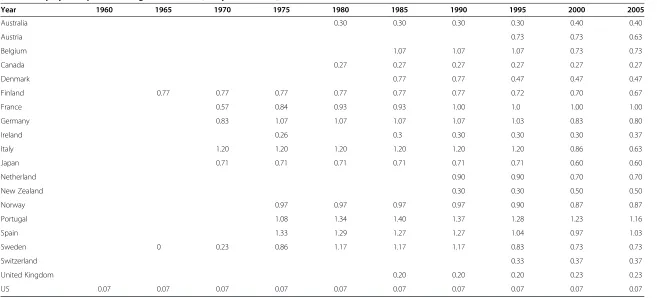
Regression analyses are conducted with the following labor-market-institution indi-ces: the Employment Protection Legislation (hereafter, EPL) Index, the Benefit Replace-ment Ratio Index, the Benefit Duration Index, the Union Density Ratio, the Union Coverage Ratio, the Bargaining Centralization Index, and the Bargaining Coordination Index. Tables 4, 5, 6, 7, 8, 9 and 10 tabulate the time series of each index for each coun-try. Details of these indexes are summarized as follows.
1. TheEPL Indextakes a higher value if employment protection legislation is more stringent. This index is essentially based on Blanchard and Wolfers (2000), which in turn is based on Lazear (1990) and OECD (1994). Blanchard and Wolfers (2000) extend an EPL measure of OECD (1994) by connecting with Lazear (1990). In particular, Blanchard and Wolfers (2000) use a measure namedversion 1, which is the longest series of the three measures published by the OECD. Here we only briefly explain the method for constructing the OECD (1994) version 1 measure (See Nickell
2006and OECD1994for more about the construction of version 1 of the EPL Index). The OECD indicators of employment protection measure the procedures and costs involved in dismissing individuals or groups of workers and the procedures involved in hiring workers on fixed-term or temporary-work agency contracts. The indicators are compiled from several items covering three different aspects of employment
protection: individual dismissal of workers with regular contracts, additional costs for collective dismissals, and regulation of temporary contracts. The measure is an unweighted average of the sub-indicators of regular and temporary contracts. These sub-indicators are aggregates ofbasis measures, which take a value of 0 to 6.4
Blanchard and Wolfers (2000) construct their EPL index for every five years, and then Nickell (2006) interpolates them. In 2005, the US marked 0.07, France marked 1.00, and Japan marked 0.60.
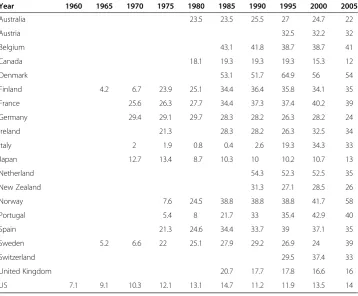
2. TheBenefit Replacement Ratio Indexsummarizes a benefit replacement ratio for various conditions. For many countries, the benefit replacement ratio depends on family structures and earnings before losing a job. The OECD calculates the replacement rates for the first five years of unemployment for three typical family structures and for two earnings levels, and takes the average of the figures. In 2005, the US marked 14, France marked 39, and Japan marked 13.
Table 4 Employment protection legislation index (five-year intervals)
Year 1960 1965 1970 1975 1980 1985 1990 1995 2000 2005
Australia 0.30 0.30 0.30 0.30 0.40 0.40
Austria 0.73 0.73 0.63
Belgium 1.07 1.07 1.07 0.73 0.73
Canada 0.27 0.27 0.27 0.27 0.27 0.27
Denmark 0.77 0.77 0.47 0.47 0.47
Finland 0.77 0.77 0.77 0.77 0.77 0.77 0.72 0.70 0.67
France 0.57 0.84 0.93 0.93 1.00 1.0 1.00 1.00
Germany 0.83 1.07 1.07 1.07 1.07 1.03 0.83 0.80
Ireland 0.26 0.3 0.30 0.30 0.30 0.37
Italy 1.20 1.20 1.20 1.20 1.20 1.20 0.86 0.63
Japan 0.71 0.71 0.71 0.71 0.71 0.71 0.60 0.60
Netherland 0.90 0.90 0.70 0.70
New Zealand 0.30 0.30 0.50 0.50
Norway 0.97 0.97 0.97 0.97 0.90 0.87 0.87
Portugal 1.08 1.34 1.40 1.37 1.28 1.23 1.16
Spain 1.33 1.29 1.27 1.27 1.04 0.97 1.03
Sweden 0 0.23 0.86 1.17 1.17 1.17 0.83 0.73 0.73
Switzerland 0.33 0.37 0.37
United Kingdom 0.20 0.20 0.20 0.23 0.23
US 0.07 0.07 0.07 0.07 0.07 0.07 0.07 0.07 0.07 0.07
Note: Index of strictness of employment protection legislation, which is increasing in the degree of employment protection legislation. Source: Nickell (2006) and extended by using OECD labor market statistics database.
Kawaguc
hi
and
Murao
IZA
Journal
of
Labor
Policy
2012,
1
:10
Page
9
o
f
2
2
http://ww
w.izajolp.com
/content/1
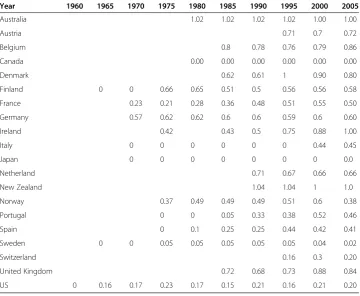
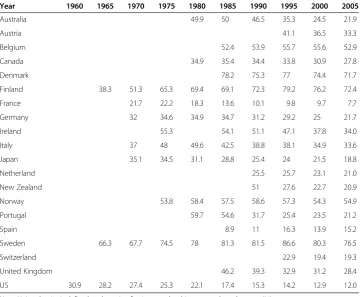
benefit decreases along with unemployment spell. The index is calculated as 0.6*brr23/ brr1+0.4*brr45/brr1, where brr1 refers to benefits of the first year, brr23 the second and the third years, and brr45 the fourth and the fifth years. This index takes 0 if the unemployment insurance benefit ends at or within 52 weeks of an unemployment spell and takes a positive value if the unemployment insurance benefit continues after 52 weeks. In 2005, the US marked 0.20, France marked 0.50, and Japan marked 0.00. 4. TheUnion Density Ratio(%) is a ratio of the number of union memberships over the employed population. In 2005, the US marked 12.0%, France marked 7.7%, and Japan marked 18.8%.
5. TheUnion Coverage Ratio(%) refers to a ratio of the number of workers covered by collective agreements over the employed population. A high value of this index implies that more workers are covered by agreements by collective bargaining between employers and unions. In some European countries, these agreements set a legally binding minimum wage for all employers. Therefore, the gap between union density and the union coverage ratio can be substantial, and the extreme example is France, where about 95% of workers are covered by union agreements,but less than 10% of workers are union members (Card et al. 2003). The latest year of the available index is 2000, when the US marked 14%, France marked 93%, and Japan marked 18%.
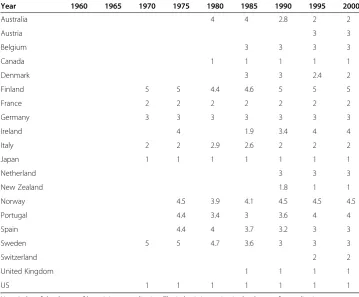
6. TheCentralization Indextakes a higher value if the bargaining process is more centralized. Bargaining may occur at several different levels, and this fact indicates the degree of centralization. The index is taken from Table 3.5 of OECD (2004).
Table 5 Benefit duration index (five-year intervals)
Year 1960 1965 1970 1975 1980 1985 1990 1995 2000 2005
Australia 1.02 1.02 1.02 1.02 1.00 1.00
Austria 0.71 0.7 0.72
Belgium 0.8 0.78 0.76 0.79 0.86
Canada 0.00 0.00 0.00 0.00 0.00 0.00
Denmark 0.62 0.61 1 0.90 0.80
Finland 0 0 0.66 0.65 0.51 0.5 0.56 0.56 0.58
France 0.23 0.21 0.28 0.36 0.48 0.51 0.55 0.50
Germany 0.57 0.62 0.62 0.6 0.6 0.59 0.6 0.60
Ireland 0.42 0.43 0.5 0.75 0.88 1.00
Italy 0 0 0 0 0 0 0.44 0.45
Japan 0 0 0 0 0 0 0 0.0
Netherland 0.71 0.67 0.66 0.66
New Zealand 1.04 1.04 1 1.0
Norway 0.37 0.49 0.49 0.49 0.51 0.6 0.38
Portugal 0 0 0.05 0.33 0.38 0.52 0.46
Spain 0 0.1 0.25 0.25 0.44 0.42 0.41
Sweden 0 0 0.05 0.05 0.05 0.05 0.05 0.04 0.02
Switzerland 0.16 0.3 0.20
United Kingdom 0.72 0.68 0.73 0.88 0.84
US 0 0.16 0.17 0.23 0.17 0.15 0.21 0.16 0.21 0.20
1. Company- and plant-level predominant.
2. Combination of industry and company/plant levels, with an important share of employees covered by company bargains.
3. Industry-level predominant.
4. Predominantly industrial bargaining, but also recurrent central-level associations. 5. Central-level agreements of overriding importance.
In these decades, there is no country in which bargaining processes became more centralized, while several countries, such as New Zealand, Switzerland, and Denmark, became more decentralized. In countries where at least two years differ from the period’s modal value, the period average is reported.
The latest available year of the index is 2000, when the US marked 1.0, France marked 2.0, and Japan marked 1.0.
7. TheCoordination Indexsummarizes the degree of coordination in bargaining processes on the employer’s as well as the union’s side. The index takes a higher value if the degree of coordination is higher.5This index is taken from Table 3.5 of OECD (2004).
1. Fragmented company/plant bargaining, little or no coordination by upper-level associations.
2. Fragmented industry and company-level bargaining, with little or no pattern-setting, 3. Industry-level bargaining with irregular pattern-setting and moderate co-ordination among major bargaining actors.
Table 6 Benefit replacement ratio
Year 1960 1965 1970 1975 1980 1985 1990 1995 2000 2005
Australia 23.5 23.5 25.5 27 24.7 22
Austria 32.5 32.2 32
Belgium 43.1 41.8 38.7 38.7 41
Canada 18.1 19.3 19.3 19.3 15.3 12
Denmark 53.1 51.7 64.9 56 54
Finland 4.2 6.7 23.9 25.1 34.4 36.4 35.8 34.1 35
France 25.6 26.3 27.7 34.4 37.3 37.4 40.2 39
Germany 29.4 29.1 29.7 28.3 28.2 26.3 28.2 24
Ireland 21.3 28.3 28.2 26.3 32.5 34
Italy 2 1.9 0.8 0.4 2.6 19.3 34.3 33
Japan 12.7 13.4 8.7 10.3 10 10.2 10.7 13
Netherland 54.3 52.3 52.5 35
New Zealand 31.3 27.1 28.5 26
Norway 7.6 24.5 38.8 38.8 38.8 41.7 58
Portugal 5.4 8 21.7 33 35.4 42.9 40
Spain 21.3 24.6 34.4 33.7 39 37.1 35
Sweden 5.2 6.6 22 25.1 27.9 29.2 26.9 24 39
Switzerland 29.5 37.4 33
United Kingdom 20.7 17.7 17.8 16.6 16
US 7.1 9.1 10.3 12.1 13.1 14.7 11.2 11.9 13.5 14
Note: Average number across the first five years of unemployment for three family situations and two money levels (%). Source:Nickell (2006) and OECD statistics.
Kawaguchi and MuraoIZA Journal of Labor Policy2012,1:10 Page 11 of 22
4. One of the following four categories from a) to d):
a) informal coordination of industry and firm-level bargaining by (multiple) peak associations;
b) Coordinated bargaining by peak confederations, including government-sponsored negotiations(tripartite agreements, social pacts), or government imposition of wage schedules;
c) regular pattern-setting coupled with high union concentration and /or bargainingco-ordination by large firms; or
d) government wage arbitration.
5. One of the following two categories a) or b):
a) informal coordination of industry-level bargaining by an encompassing union confederation; or
b) coordinated bargaining by peak confederations or government imposition of a wage schedule/freeze, with apeace obligation.
The latest year of the available index is 2000, when the US marked 1.0, France marked 2.0, and Japan marked 4.0.
In general, centralization may not necessarily mean coordination or vice versa (OECD 1997). First, if there is a significant discrepancy between the individual
Table 7 Union density (five-year intervals)
Year 1960 1965 1970 1975 1980 1985 1990 1995 2000 2005
Australia 49.9 50 46.5 35.3 24.5 21.9
Austria 41.1 36.5 33.3
Belgium 52.4 53.9 55.7 55.6 52.9
Canada 34.9 35.4 34.4 33.8 30.9 27.8
Denmark 78.2 75.3 77 74.4 71.7
Finland 38.3 51.3 65.3 69.4 69.1 72.3 79.2 76.2 72.4
France 21.7 22.2 18.3 13.6 10.1 9.8 9.7 7.7
Germany 32 34.6 34.9 34.7 31.2 29.2 25 21.7
Ireland 55.3 54.1 51.1 47.1 37.8 34.0
Italy 37 48 49.6 42.5 38.8 38.1 34.9 33.6
Japan 35.1 34.5 31.1 28.8 25.4 24 21.5 18.8
Netherland 25.5 25.7 23.1 21.0
New Zealand 51 27.6 22.7 20.9
Norway 53.8 58.4 57.5 58.6 57.3 54.3 54.9
Portugal 59.7 54.6 31.7 25.4 23.5 21.2
Spain 8.9 11 16.3 13.9 15.2
Sweden 66.3 67.7 74.5 78 81.3 81.5 86.6 80.3 76.5
Switzerland 22.9 19.4 19.3
United Kingdom 46.2 39.3 32.9 31.2 28.4
US 30.9 28.2 27.4 25.3 22.1 17.4 15.3 14.2 12.9 12.0
firm-level negotiated wage and the globally negotiated wage, which is called wage drift, the extent of coordination may be weaker despite the centralized wage set-ting. Second, institutions such as pattern-setting may promote coordination, while it is also substitutable for institutions that are intended to promote centralization.6 There are several different claims regarding the effects of centralization and co-ordination on unemployment rates. Nickell (1997) refers to the notion of OECD (1994) Table 5.16 that coordinative arrangements lower wages, while centralized arrangements do not, and summarizes that the negative effects of unionization on employment are mitigated by coordination. In contrast, Calmfors and Driffill (1988) claim that the relation between centralization and employment is U-shaped, while Driffill (2006) later find that highly coordinated or centralized bar-gaining leads to wage restraint and a low unemployment rate.
Time-series, cross-section values of these indexes are summarized in Tables 4, 5, 6, 7, 8, 9 and 10. The indexes do not vary much over time within a country; thus the estima-tion relies mainly on the cross-country variaestima-tion of labor-market instituestima-tions.7The de-scriptive statistics of the analysis sample are summarized in Table 11. Since the values of the index of labor markets do not carry information in themselves, we normalize all the indexes for the purpose of comparing the relative importance of institutions in de-termining the change of unemployment rates.
Table 8 Union coverage ratio
Year 1960 1965 1970 1975 1980 1985 1990 1995 2000
Australia 84 85 81.5 80.5 83
Austria 98.8 98
Belgium 90 91.5 90.5 93
Canada 38.5 39 38 35.3 32
Denmark 74 71 71.3 83
Finland 95 95 95 94 95 94 94.7 93
France 84 92 92.5 94.7 93
Germany 90 90 87 90 86.5 88 68
Ireland
Italy 88 85 84 85 83 82.2 83
Japan 28 25.5 23 20.5 18
Netherland 73 84.7 83
New Zealand 65 30.5 28
Norway 65 71.5 70 71.5 70.5 73
Portugal 71.5 73.8 76 73 83
Spain 65.5 70 74.5 78.8 83
Sweden 83 83.8 84.5 89.7 93
Switzerland 51.3 43
United Kingdom 62 48.5 38.8 33
US 29 27 27 24 23.5 21 18 16.5 14
Note: Ratio of workers covered by collective agreements (%).
Values after year 2000 are extrapolated using the value in 2000 in the course of estimation. Source: Nickell (2006).
Kawaguchi and MuraoIZA Journal of Labor Policy2012,1:10 Page 13 of 22
5. Estimation results
Table 11 displays descriptive statistics of the analysis data. The data set includes obser-vations from 18 countries between 1971 and 2008. Were all obserobser-vations included, there would be 684 observations, but because of missing observations, there are 507 observations in the data set. The mean youth (15-24) unemployment rate is about 14% and higher than that of prime age groups (25-34, 7% and 45-54, 4%). Each institution index is normalized by mean and standard deviation so that the effects of each institu-tion on unemployment rates are comparable.
Table 12 reports the estimation results of equations (1) and (2). Columns (1) through (3) report the results for age-specific unemployment rate changes among 15-24 year olds, 25-34 year olds, and 45-54 year olds, as dependent variables. Column (4) is the result with the difference of the unemployment rate change between 15-24 year olds and 45-54 year olds as the dependent variable. Column (5) shows the result with the difference be-tween the unemployment rate change of 15-24 year olds and that of 45-54 year olds as the dependent variable.
The coefficients of the overall unemployment rate are positive in each of the age groups. The estimated coefficients are larger for younger workers than adult workers, indicating that youths’unemployment rate is more procyclical than adults’unemployment rate.
Estimation results suggest that labor-market institution indexes, such as firing restric-tions, unemployment system, and wage-setting institurestric-tions, are broadly irrelevant to unemployment growth.
Table 9 Bargaining centralisation index
Year 1960 1965 1970 1975 1980 1985 1990 1995 2000
Australia 4 4 2.8 2 2
Austria 3 3
Belgium 3 3 3 3
Canada 1 1 1 1 1
Denmark 3 3 2.4 2
Finland 5 5 4.4 4.6 5 5 5
France 2 2 2 2 2 2 2
Germany 3 3 3 3 3 3 3
Ireland 4 1.9 3.4 4 4
Italy 2 2 2.9 2.6 2 2 2
Japan 1 1 1 1 1 1 1
Netherland 3 3 3
New Zealand 1.8 1 1
Norway 4.5 3.9 4.1 4.5 4.5 4.5
Portugal 4.4 3.4 3 3.6 4 4
Spain 4.4 4 3.7 3.2 3 3
Sweden 5 5 4.7 3.6 3 3 3
Switzerland 2 2
United Kingdom 1 1 1 1
US 1 1 1 1 1 1 1
Note: Index of the degree of bargaining centralization. The index is increasing in the degree of centralization. Values after year 2000 are extrapolated using the value in 2000 in the course of estimation.
The coefficients of the interaction terms between institution indexes and the overall unemployment rate identify the heterogeneous impacts of the macroeconomic shock on age-specific unemployment rates by institutional setting. We first examine the results for employment protection. Table 12 Column 1 shows that stricter employment protection amplifies the effect of overall shock on youth unemployment, while it has no effect on that of young adult and adult workers, according to Columns 2 and 3. This implies that firing restrictions mitigate the cyclical fluctuation of young adult and adult unemployment, but they do not mitigate it for youth. This result is consistent with the theoretical result of the previous section. This also well explains why the unemploy-ment rates of all age groups move simultaneously in the US, where firing restrictions are less stringent, while youths’unemployment rate fluctuates more than that of adults in France, where firing restrictions are more stringent.
Notable results other than that of employment protection legislation (EPL) are coeffi-cients of the interaction terms between the overall unemployment rate and the benefit replacement ratio. The estimated coefficient is negative and statistically significant for youths, but it is positive while not statistically significant for young adults and adults. Put differently, the higher benefit replacement ratio reduces the difference of the un-employment rate sensitivity to macro shocks between youths and adults.
Given that adult workers are more likely to be employed and so are more likely to receive benefits from unemployment insurance, the above empirical results are consist-ent with the assertion that a higher replacemconsist-ent rate makes unemploymconsist-ent acceptable
Table 10 Bargaining coordination index
Year 1960 1965 1970 1975 1980 1985 1990 1995 2000
Australia 4.3 4.2 2.8 2 2
Austria 4 4
Belgium 4 4 4.3 4.5
Canada 1.8 1 1 1 1
Denmark 3.6 3.4 3.6 4
Finland 5 5 4.4 4.6 5 5 5
France 2 2 2 2 2 2 2
Germany 4 4 4 4 4 4 4
Ireland 4 1.9 3.4 4 4
Italy 2 2 2.9 2.6 2.6 3.6 4
Japan 4 4 4 4 4 4 4
Netherland 4 4 4
New Zealand 2.2 1 1
Norway 4.5 3.9 4.1 4.5 4.5 4.5
Portugal 4.4 3.4 3 3.6 4 4
Spain 4.4 4 3.7 3.2 3 3
Sweden 4 4 3.7 3.2 3 3 3
Switzerland 4 4
United Kingdom 1 1 1 1
US 1 1 1 1 1 1 1
Note: Index of the degree of bargaining coordination. The index is increasing in the degree of coordination. Values after year 2000 are extrapolated using the value in 2000 in the course of estimation.
Source:Nickell (2006).
Kawaguchi and MuraoIZA Journal of Labor Policy2012,1:10 Page 15 of 22
for adult workers, while empirical results on this effect are mixed (Atkinson and Micklewright 1991).
The relative youth cohort size and the relative young-adult cohort size are negatively correlated with the unemployment rate of the young, though neither relation is statisti-cally significant. This result is consistent with findings by Korenman and Neumark (2000) that the share of youth has little impact on youths’unemployment rate in OECD countries between 1970 and 1994.
6. Effects of industry composition on the volatility of the unemployment rate
The difference in the volatility of the age-specific unemployment rate may be a conse-quence of the fact that young and older workers are in different industries that are sub-ject to different business-cycle effects. The employment share in manufacturing sectors decreases in all OECD countries between 1970 and 2003, but the speeds of transition are different across countries (Pilat et al. 2006). Youth employment can be concentrated in the service sector in countries that experience a rapid contraction of the manufacturing sector, given that the decrease of the employment share in the manufacturing sector is more significant among youths than adults. This difference in industry composition of employment between youths and adultsinduces a difference in the volatility of employ-ment if employemploy-ment in some industries is more sensitive to the business cycle than em-ployment in other industries. In this case, if the age-specific industry compositions are correlated with the index of labor-market institutions across countries, the estimates in the previous section could be biased.
Indeed, Filardo and Andrew (1997) claims that the manufacturing sector may well be more susceptible to the business cycle than the service sector because the product demand is more volatile due to the durable and tradable nature of its product. Filardo and Andrew
Table 11 Descriptive statistics, 1971-2008, 18 countries
Variable mean s.d. min max
Unemployment rate for 15-24 13.855 6.744 0.648 39.267
Unemployment rate for 25-34 6.605 3.570 0.392 21.963
Unemployment rate for 45-54 4.365 2.384 0.000 14.013
Population 15-24 / Population 15-55 (%) 24.902 5.555 17.783 34.177
Population 25-34 / Population 15-55 (%) 26.894 1.856 17.783 33.956
GDP growth rate lagged one year 0.021 0.018 −0.080 0.080
Employment rate for 15-24 52.033 11.854 26.804 75.023
Employment rate for 25-34 87.009 4.271 72.463 96.910
Employment rate for 45-54 86.865 3.687 75.000 96.391
Employment Protection Legislation Index(EPL Index) 0.00 1.00 −1.803 1.920
Benefit duration ratio 0.00 1.00 −1.429 1.738
Benefit replacement ratio 0.00 1.00 −1.993 15.961
Union density 0.00 1.00 −1.583 2.210
Union contract coverage rate 0.00 1.00 −2.203 1.172
Union centralization index 0.00 1.00 −1.307 1.920
Union coordination index 0.00 1.00 −1.632 1.451
Table 12 The impact of overall unemployment rate growth on age-specific unemployment rate growth
(1) (2) (3) (4) (5)
VARIABLES ΔUE15-24, t ΔUE25-34, t ΔUE45-54, t ΔUE15-24, t-ΔUE45-54, t ΔUE25-34, t -ΔUE45-,54, t
ΔUnemployment rateall ages, t 1.739 (0.137) 1.185 (0.050) 0.724 (0.051) 1.015 (0.162) 0.460 (0.075)
Employment protection legislationt-1 −0.004 (0.094) −0.005 (0.034) 0.010 (0.035) −0.014 (0.111) −0.014 (0.051)
Benefit durationt-1 0.064 (0.070) −0.007 (0.025) −0.028 (0.026) 0.092 (0.083) 0.021 (0.038)
Benefit replacement ratiot-1 −0.218 (0.152) 0.031 (0.055) 0.085 (0.057) −0.303 (0.180) −0.054 (0.083)
Union densityt-1 0.060 (0.062) −0.031 (0.022) −0.007 (0.023) 0.067 (0.073) −0.024 (0.034)
Union coveraget-1 −0.019 (0.093) 0.003 (0.034) 0.003 (0.035) −0.022 (0.110) −0.000 (0.051)
Centralizationt-1 0.086 (0.098) −0.023 (0.035) −0.019 (0.037) 0.104 (0.116) −0.004 (0.054)
Coordinationt-1 −0.081 (0.083) 0.031 (0.030) −0.009 (0.031) −0.072 (0.098) 0.040 (0.046)
Employment protection legislationt-1×ΔUEall ages, t 0.402 (0.170) 0.023 (0.061) −0.125 (0.063) 0.527 (0.201) 0.148 (0.093)
Benefit durationt-1×ΔUEall ages, t 0.146 (0.145) −0.092 (0.052) −0.022 (0.054) 0.168 (0.171) −0.070 (0.079)
Benefit replacement ratiot-1×ΔUEall ages, t −0.698 (0.380) 0.155 (0.138) 0.210 (0.142) −0.907 (0.450) −0.055 (0.208)
Union densityt-1×ΔUEall ages, t 0.005 (0.098) 0.079 (0.036) −0.023 (0.037) 0.028 (0.116) 0.103 (0.054)
Union coveraget-1×ΔUEall ages, t 0.060 (0.281) −0.016 (0.102) −0.022 (0.105) 0.082 (0.332) 0.005 (0.154)
Centralizationt-1×ΔUEall ages, t 0.246 (0.332) −0.214 (0.120) −0.009 (0.124) 0.255 (0.392) −0.205 (0.182)
Coordinationt-1×ΔUEall ages, t −0.332 (0.367) 0.135 (0.133) 0.058 (0.137) −0.389 (0.434) 0.078 (0.201)
Δln(15-24 population) −3.906 (3.235) 1.799 (1.172) −1.926 (1.207) −1.981 (3.828) 3.725 (1.772)
Δln(25-34 population) −3.702 (2.756) −0.429 (0.999) 0.160 (1.028) −3.863 (3.261) −0.590 (1.510)
Constant 7.663 (5.250) −1.350 (1.902) 1.765 (1.958) 5.898 (6.212) −3.115 (2.876)
Observations 489 489 489 489 489
Number of countries 18 18 18 18 18
Notes: Standard errors are in parentheses. Each institution index is computed as the deviation from the mean over standard error. All specifications include year dummy variables. Dependent variable :Δ(Unemployment rate)specific age,t.
Endogenous variables:Δ(Unemployment rate)all ages,tand its interactions with labor market institution indexes.
Estimation Method: Random Effects IV usingΔ(GDP growth rate)t-1and its interactions with labor market institution indexes as IV.
Kawaguc
hi
and
Murao
IZA
Journal
of
Labor
Policy
2012,
1
:10
Page
17
of
22
http://ww
w.izajolp.com
/content/1
(1997) in fact shows that employment in the manufacturing sector is much more volatile than in the service sector over the business cycle using US data. If this result carries over to OECD countries in general, we have to be concerned about the effects of different industrial compositions across age groups on the estimation results in the previous section. To ad-dress this concern, we examine if the effect of lagged GDP growth on the unemployment rate is stronger in countries where the share of manufacturing employment is high. The re-sult of the regression appears in Table 13. While a one-percent-higher lagged GDP growth rate reduces the unemployment rate by 0.37 percent, the size of its effect does not depend on the share of employment in the manufacturing sector in a statistically significant way. Based upon this estimation result, we conclude that the effect of industrial composition on the age-specific unemployment rate is limited.
7. Unemployment vs. Non-employment
Literature argues that the distinction between unemployment and out-of-labor-force is vague and dependent on the policy environment (Atkinson and Micklewright 1991). For in-stance, long-term unemployed workers may quit their job-search when their unemployment benefits expire, while they may continue job-search if the benefit spell is indefinite and the insurance requires job-search as a condition for receiving the benefit. In this case, indivi-duals not in employment are more likely to be classified as unemployed in countries with more generous unemployment insurance. In addition, recent studies in the US and Europe report that unemployed workers make claims for disability insurance instead of unemploy-ment insurance because of its generosity (Black et al. 2002, Autor and Duggan 2003, Rege et al. 2009 and Bratsberg et al. 2010). Since recipients of disability insurance are classified as out-of-labor-force instead of unemployed, the unemployment rate would be smaller in countries with a generous disability insurance system. To address a concern that the results in the previous section depend critically on the usage of the unemployment rate instead of the employment rate, we estimate exactly the same equation by using the employment rate in place of the unemployment rate as a dependent variable.
The regression results are reported in Table 14. When the overall employment rate increases by 1 percentage point, the employment rate of 15-24 year olds increases by 1.478 percentage points, the employment rate of 25-34 year olds increases by 1.143 percentage points, while the employment rate of 45-54 increases by only 0.612 percentage points. The fact that the youth employment rate is more volatile than the adult employment rate preserves the results based
Table 13 Industry composition and sensitivity of unemployment rate to economic shock, Random effects estimates
VARIABLES ΔUEt
Δln(GDPt-1) −37.135 (3.294)
Manufacturing sector employment share 0.040 (1.522)
Δln(GDPt-1)×manufacturing sector employment share −28.199 (107.513)
Constant 0.636 (0.346)
Observations 234
Number of countries 17
Table 14 The impact of overall employment rate growth on age-specific employment rate growth
(1) (2) (3) (4) (5)
VARIABLES ΔE15-24, t ΔE25-34, t ΔE45-54, t ΔE15-24, t-ΔE45-,54, t ΔE25-34, t -ΔE45-,54, t
ΔUnemployment rateall ages, t 1.478 (0.132) 1.143 (0.090) 0.612 (0.097) 0.866 (0.187) 0.531 (0.132)
Employment protection legislationt-1 −0.193 (0.112) 0.051 (0.076) 0.004 (0.082) −0.197 (0.159) 0.048 (0.112)
Benefit durationt-1 −0.134 (0.091) 0.121 (0.062) 0.018 (0.067) −0.151 (0.130) 0.104 (0.091)
Benefit replacement ratiot-1 0.100 (0.123) −0.140 (0.084) −0.081 (0.091) 0.181 (0.175) −0.059 (0.123)
Union densityt-1 −0.060 (0.074) 0.081 (0.051) −0.017 (0.055) −0.043 (0.105) 0.099 (0.074)
Union coveraget-1 0.148 (0.113) −0.057 (0.077) −0.021 (0.083) 0.169 (0.160) −0.036 (0.113)
Centralizationt-1 0.050 (0.116) 0.145 (0.080) −0.005 (0.086) 0.055 (0.166) 0.150 (0.117)
Coordinationt-1 0.085 (0.124) −0.177 (0.085) 0.090 (0.092) −0.005 (0.177) −0.267 (0.124)
Employment protection legislationt-1×ΔUEall ages, t 0.160 (0.153) −0.199 (0.104) −0.222 (0.113) 0.382 (0.218) 0.023 (0.153)
Benefit durationt-1×ΔUEall ages, t 0.073 (0.129) −0.213 (0.088) −0.016 (0.095) 0.089 (0.183) −0.197 (0.129)
Benefit replacement ratiot-1×ΔUEall ages, t −0.216 (0.261) 0.484 (0.178) 0.272 (0.193) −0.488 (0.371) 0.212 (0.261)
Union densityt-1×ΔUEall ages, t 0.058 (0.092) −0.004 (0.063) −0.081 (0.067) 0.140 (0.130) 0.077 (0.092)
Union coveraget-1×ΔUEall ages, t −0.352 (0.236) 0.229 (0.161) 0.167 (0.174) −0.520 (0.336) 0.062 (0.236)
Centralizationt-1×ΔUEall ages, t 0.250 (0.361) −0.431 (0.247) 0.190 (0.266) 0.060 (0.514) −0.620 (0.361)
Coordinationt-1×ΔUEall ages, t −0.112 (0.376) 0.313 (0.257) −0.239 (0.277) 0.127 (0.535) 0.552 (0.376)
Δln(15-24 population) 1.855 (3.473) 1.180 (2.372) 7.514 (2.561) −5.659 (4.941) −6.334 (3.475)
Δln(25-34 population) 1.664 (3.177) −0.382 (2.170) −16.062 (2.343) 17.726 (4.519) 15.680 (3.179)
Constant −3.899 (5.819) −0.950 (3.974) 8.398 (4.291) −12.296 (8.278) −9.348 (5.822)
Observations 489 489 489 489 489
Number of countries 18 18 18 18 18
Notes: Standard errors are in parentheses. Each institution index is computed as the deviation from the mean over standard error. All specifications include year dummy variables. Independent variable :Δ(Employment rate)specific age,t.
Macroeconomic shock:Δ(Employment rate)all ages,t.
Estimation Method: Random Effects IV usingΔ(GDP growth rate)t-1as IV.
Kawaguc
hi
and
Murao
IZA
Journal
of
Labor
Policy
2012,
1
:10
Page
19
of
22
http://ww
w.izajolp.com
/content/1
on the unemployment rate. The interaction of the overall employment rate and employment protection legislation (EPL) is positive though not statistically signifi-cant. This positive coefficient implies that stricter EPL amplifies the fluctuation of youth employment, but its effect is weaker than the effect on the unemployment rate. In contrast, stricter EPL reduces the fluctuation of the employment rate for both 25-34 and 45-54 year olds, and these effects are statistically significant. Hence, stricter EPL makes the youth employment rate more volatile than the adult employment rate, and the difference of the coefficients is statistically signifi-cant at the 10% level. Therefore, the result that stricter EPL makes the youth un-employment rate more volatile than the adult unun-employment rate carries over to the analysis of the employment rate.
The interaction terms of the overall employment rate and the benefit replacement ra-tion (BRR) are negative for youths and positive for young adults and adults (25-34 and 45-54), though only the coefficient for young adult is statistically significant. This result weakly suggests that generous unemployment benefits make non-employment of young adults and adults more sensitive to the business cycle and make that of young adults less sensitive. Again, results obtained for the unemployment rate weakly carries over to the analysis based on the employment rate.
Overall, results based on the employment rate confirm the robustness of results based on the unemployment rate.
8. Conclusion
In this paper, we empirically explore the effect of labor-market institutions on cyc-lical variations of age-specific unemployment rates. A theoretical model with a nu-merical simulation suggests that a firing restriction has the heterogeneous impacts of a macroeconomic shock on the fluctuation of age-specific labor demand. In particu-lar, a high adjustment cost of adult workers amplifies the cyclical variation of labor demand for young workers, while it mitigates the fluctuation of such demand for adult workers.
Our empirical analysis from 18 OECD countries over 1971-2008 shows that the firing restriction amplifies the cyclical fluctuation of the unemployment rate for youths, but not for adults. This implies that macroeconomic shocks are disproportionately absorbed by younger workers rather than older workers in economies with stricter fi-ring restrictions. The other notable result is that macroeconomic shocks are less likely to be absorbed by young workers in economies with a generous unemployment insu-rance system, represented by a high benefit-replacement ratio.
Previous literature has shown that youths’unemployment rate is more cyclically sen-sitive than that of adults. Another strand of literature has shown that employment protection and wage-setting institutions tend to increase young workers' long-run un-employment rate. On top of that existing knowledge, this paper adds a new finding that a stricter firing restriction disproportionately insulates older workers from macroeconomic shocks at the cost of a fluctuation in younger workers’ unemployment rate. Our results suggest the importance of paying attention to intergenerational risk sharing in discussions about designing labor-market institutions.
over a life cycle. In contrast, if employment status during workers’ youth is persist-ent over a life cycle, the experience of unemploympersist-ent at youth may significantly de-crease the life-time welfare of a specific cohort. Hence, using cross-country panel data, calculating an average unemployment rate over the life cycle for each cohort, and examining how its inter-cohort variation depends on labor-market institutions are interesting areas for future research.
Endnotes 1
OECD data released in advance of the meeting areavailable from following web page. http://www.oecd.org/newsroom/g20labourministersmustfocusonyoungjobseekers.htm (Viewed on August 25, 2012).
2
http://stats.oecd.org 3
Social policies and data, Benefits and Wages: OECD Indicators. http://www.oecd. org/social/socialpoliciesanddata/benefitsandwagesoecdindicators.htm. Accessed on August 26, 2012.
4
For regular employment, there are 8 basis indicators (notification procedures, delay involved before notice can start, length of the notice period, severance pay, definition of justified or unfair dismissal, length of trial period, and compensation following unfair dismissal). For temporary workers, there are 6 basis indicators (valid cases for use of Fixed-Term Contracts (FTC), maximum number of successive FTCs, maximum cumu-lated duration of successive FTCs, types of work for which Temporary Work Agency (TWA) employment is legal, restrictions on the number of renewals, and maximum cumulated duration of TWA contracts). See “Calculating summary indicators of em-ployment protection strictness” (http://www.oecd.org/dataoecd/24/40/42740190.pdf ) for details of these measures.
5“
[D]egree of consensus between the collective bargaining partners”(OECD 1997). 6
Pattern setting is a type of arrangement in which representative employers and unions act as de-facto leaders and their agreements are taken as a pattern for all nego-tiations in the same industry.
7
We estimated a country fixed-effects model.exploiting within-country variation of labor-market institutions. The lack of sufficient within-country variation prevents us from making precise inferences.
Competing interests
The IZA Journal of Labor Policy is committed to the IZA Guiding Principles of Research Integrity. The authors declare that they have observed these principles.
Acknowledgements
We thank Naohito Abe, Julen Esteban-Pretel, Makoto Saito, EtsuroShioji, Kotaro Tsuru, David Neumark, and seminar participants at Research Institute of Economy, Trade and Industry and Hitotsubashi University for their comments. This research is financially supported by Ministry of Education, Culture, Sports, Science and Technology of Japanese Government and Japan Society of Promotion for Science.
Responsible editor: David Neumark. Author details
1Research Institute of Economy Trade and Industry, Tokyo Center for Economics Research, Institute for the Study of Labor (IZA), Hitotsubashi University, Tokyo, Japan.2Kyushu University, Fukuoka, Japan.
Received: 8 September 2012 Accepted: 25 October 2012 Published: 24 December 2012
Kawaguchi and MuraoIZA Journal of Labor Policy2012,1:10 Page 21 of 22
References
Alba-Ramirez A (1995) Cross-Country Differences in Cyclical Variations of Male Teenage Employment. Econ Letters 48(3-4):419–26
Atkinson AB, Micklewright J (1991) Unemployment Compensation and Labor Market Transitions: A Critical Review. J Econ Lit 29(4):1679–727
Autor DH, Duggan MG (2003) The Rise in the Disability Rolls and the Decline in Unemployment. Quart J Econ 118 (1):157–205
Bertola G, Blau F, Khan L (2007) Labor Market Institutions and Demographic Employment Patterns. J Population Econ 20(4):833–67
Black D, Daniel K, Sanders S (2002) The Impact of Economic Conditions on Participation in Disability Programs: Evidence from the Coal Boom and Bust. Amer Econ Rev 92(1):27–50
Blanchard O, Wolfers J (2000) The Role of Shocks and Institutions in the Rise of European Unemployment: The Aggregate Evidence. Econ J 110(462):C1–33
Bratsberg B, Fevang E, Røed K (2010) Disability in the Welfare State: An Unemployment Problem in Disguise?., IZA DP. http://ftp.iza.org/dp4897.pdf. Accessed 26 Oct 2012
Calmfors L, Driffill J (1988) Bargaining Structure, Corporatism and Macroeconomic Performance. Econ Pol 3(6):13–61 Canziani P, Petrongolo B (2001) Firing Costs and Stigma: A Theoretical Analysis and Evidence from Microdata.
Europ Econ Rev 45(10):1877–906
Card D, Lemieux T, Riddell WC (2003) Unions and the Wage Structure. In: Addison JT, Schnabel C (eds) International Handbook of Trade Unions. Edward Elgar, Cheltenham, pp 246–92
Clark KB, Summers LH (1981) Demographic Differences in Cyclical Employment Variation. J Human Res 16(1):61–79 Driffill J (2006) The Centralization of Wage Bargaining Revisited: What Have We Learnt? J Common Market Stud
44:731–56
Filardo AJ (1997) Cyclical Implications of the Declining Manufacturing Employment Share. Econ Rev (Q II):63–87 Genda Y, Kondo A, Ohta S (2010) Long-Term Effects of a Recession at Labor Market Entry in Japan and the United
States. J Human Res 45(1)
Gomme P, Rogerson R, Rupert P, Wright R (2005) The Business Cycle and the Life Cycle. In: Gertler M, Rogoff K (eds) NBER Macroeconomics Annual 2004, Volume 19. National Bureau of Economic Research, Inc, pp 415–592 Jaimovich N, Siu HE (2009) The Young, the Old, and the Restless: Demographics and Business Cycle Volatility. Amer
EconRev 99(3):804–26
Kahn LM (2007) The Impact of Employment Protection Mandates on Demographic Temporary Employment Patterns: International Microeconomic Evidence. Econ J 117(521):333–56
Korenman S, Neumark D (2000) Cohort Crowding and Youth Labor Markets (a Cross-National Analysis). In: Blanchflower DG, Freeman RB (eds) Youth Employment and Joblessness in Advanced Countries. University of Chicago Press, pp 57–106
Lazear EP (1990) Job Security Provisions and Employment. Quart J Econ 105(3):699–726
Lee J (2000) The Robustness of Okun's Law: Evidence from Oecd Countries. J Macroecon 22(2):331–56 Leonor M (2008) Unions, Firing Costs, and Unemployment. Labour 22(3):509–46
Neumark D (2002) Youth Labor Markets in the United States: Shopping around Vs. Staying Put. Rev Econ Statist 84(3):462–82
Nickell S (1997) Unemployment and Labor Market Rigidities: Europe Versus North America. J Econ Perspect 11(3):55–74 Nickell S, Nunziata L (2000) Employment Patterns in Oecd Countries. CEP Discussion Papers. Centre for Economic
Performance, LSE
Nickell W (2006) The Cep-Oecd Institutions Data Set (1960-2004). CEP Discussion Papers. Centre for Economic Performance, LSE
OECD (1994) Oecd Employment Outlook 1994. OECD Publishing, Paris OECD (1997) Oecd Employment Outlook 1997. OECD Publishing, Paris
Pilat D, Cimper A, Olsen KB, Webb C (2006) The Changing Nature of Manufacturing in Oecd Economies, OECD Science, Technology and Industry Working Papers. OECD Publishing
Rege M, Telle K, Votruba M (2009) The Effect of Plant Downsizing on Disability Pension Utilization. J Europ Econ Assoc 7(4):754–85
Rios-Rull JV (1996) Life-Cycle Economies and Aggregate Fluctuations. Rev Econ Stud 63(3):465–89
Rodriguez-Palenzuela D, Jimeno-Serrano JF (2002) Youth Unemployment in the Oecd: Demographic Shifts; Labour Market Institutions, and Macroeconomic Shock. Working Paper Series. European Central Bank
Shimer R (2001) The Impact of Young Workers on the Aggregate Labor Market. Quart J Econ 116(3):969–1007 Wachter TV, Bender S (2006) In the Right Place at the Wrong Time: The Role of Firms and Luck in Young Workers.
Amer Econ Rev 96(5):1679–705
Welch F (1979) Effects of Cohort Size on Earnings: The Baby Boom Babies' Financial Bust. J Polit Econ 87(5):S65–97
doi:10.1186/2193-9004-1-10