RUSC VOL. 12 No 3 | Universitat Oberta de Catalunya and University of New England | Barcelona, July 2015
CC G. Lavigne, G. Gutiérrez Ruiz, L. McAnally-Salas and J. Organista Sandoval | CC by FUOC, 2015 | Log Analysis in a Virtual Learning Environment… Recommended citation:
Lavigne, G., Gutiérrez, G., McAnally-Salas, L., & Organista, J. S. (2015). Log Analysis in a Virtual Learning Environment for Engineering Students.
RUSC. Universities and Knowledge Society Journal, 12(3). pp. 113-128. doi: http://dx.doi.org/10.7238/rusc.v12i3.2162
Abstract
The use of information and communication technologies (ICTs) at different educational levels has impacted the teaching-learning process. ICTs have effectively become tools that support educational environments and, hence, have become educational technology. Virtual learning environments (VLEs) are widely used, offering advantages to both students and instructors. Different platforms include various activity modules, within which collaborative learning communities are built, file sharing and grade handling are facilitated, and navigation log statistics are provided. These logs shed light on the daily use of the platform. The resulting information creates an overview of users’ online navigation characteristics and preferences. Through the analysis of these navigation logs, relevant information can be extracted that may help in understanding the teaching-learning processes within VLEs. In this study, the navigation logs of students enrolled in a course offered at a School of Engineering were analyzed. The objective of this project was to analyze the characteristics of the students’ navigation by identifying, summarizing and characterizing the way in which they interact with the platform. Based on the results, it is inferred that students apply different learning strategies and follow individualized navigation paths.
Keywords
logs, educational technology, educational data mining, virtual learning environment, Moodle
Log Analysis in a Virtual Learning Environment
for Engineering Students
Gilles Lavigne
1, Genoveva Gutiérrez Ruiz
2, Lewis McAnally-Salas
3and Javier Organista Sandoval
41. Autonomous University of Baja California (UABC), Mexico | [email protected]
2. Autonomous University of Baja California (UABC), Mexico | [email protected]
3. Autonomous University of Baja California (UABC), Mexico | [email protected]
4. Autonomous University of Baja California (UABC), Mexico | [email protected]
Submitted in: April 2014 Accepted in: September 2014 Published in: July 2015
RUSC VOL. 12 No 3 | Universitat Oberta de Catalunya and University of New England | Barcelona, July 2015
CC G. Lavigne, G. Gutiérrez Ruiz, L. McAnally-Salas and J. Organista Sandoval | CC by FUOC, 2015| Log Analysis in a Virtual Learning Environment…
Análisis de la navegación en un entorno virtual de aprendizaje de estudiantes de ingeniería
Resumen
La inclusión de las tecnologías de la información y comunicación en los distintos niveles educativos ha impactado los procesos de enseñanza-aprendizaje y se han convertido en herramientas que brindan soporte a los entornos educativos, convirtiéndose así en tecnología educativa. Los entornos virtuales de aprendizaje son ampliamente utilizados, ofrecien-do ventajas tanto a estudiantes como a instructores. Las distintas plataformas incluyen diversos módulos de actividad, dentro de los cuales se construyen comunidades colaborativas de aprendizaje, intercambio de archivos, manejo de ca-lificaciones, estadísticas de uso de la plataforma en donde se alojan los registros de navegación. Dichos registros dan cuenta del uso diario que se le da a la plataforma. La información que de ello resulta genera un panorama acerca de las características y preferencias de navegación en línea por parte de los usuarios. Por medio del análisis de los registros es posible extraer información relevante que puede ayudar a entender los procesos de enseñanza-aprendizaje dentro de los entornos virtuales de aprendizaje. En la presente investigación se analizaron los registros de navegación de estudiantes dentro de un curso de una facultad de ingeniería. El objetivo de este proyecto fue el de analizar las características de nave-gación de los estudiantes a través de la identificación, caracterización y síntesis de la forma en la que interactúan con la plataforma. Se infiere, derivado de los resultados, que los estudiantes aplican estrategias diferentes de aprendizaje y que siguen trayectorias de navegación individualizadas.
Palabras clave
RUSC VOL. 12 No 3 | Universitat Oberta de Catalunya and University of New England | Barcelona, July 2015
CC G. Lavigne, G. Gutiérrez Ruiz, L. McAnally-Salas and J. Organista Sandoval | CC by FUOC, 2015| Log Analysis in a Virtual Learning Environment…
Introduction
Education has been reshaped since the advent of information and communication technologies (ICTs) as well as by
the rapid incorporation of the Internet into educational processes. Changes have occurred at different educational
levels, affecting all involved: students and teachers, even the institutions themselves. The use of virtual learning
platforms has grown and is now commonplace in many educational practices (Lavigne, Backhoff-Escudero &
Organista-Sandoval, 2008; Backhoff-Escudero, Lavigne, Organista-Sandoval, & Aguirre-Muñoz, 2007; Concannon,
Flynn, & Campbell, 2005).
Among current research possibilities, one encounters new objects of study, such as the navigation logs that
are automatically generated when using virtual learning platforms. This study seeks to understand how this
technology is employed by students. Such research can improve the use of teaching tools, taking into account
instructional design, as pointed out in Rochefort and Richmond (2011). Hershkovitz and Nachmias (2008) mention
that monitoring student motivation through the analysis of navigation logs allows the instructor to get involved
when necessary, with the aim of improving the efficiency of the learning process.
Background
Valuable information about users’ online browsing characteristics and preferences is generated through the daily
use of platforms. The information in navigation logs records the behavior of users of the website where the platform
is located, regardless of the willingness of these users to provide such information (Martínez, Mateo, & Albert, 2004).
However, the analysis of these data involves several challenges, including those of a technical nature, such as sample
size, organization and subsequent database management.
This type of analysis is called data mining and, when applied to the field of education, educational data mining
(Baker & Yacef, 2009). Online course management systems such as Moodle or Blackboard have their own programs
for recording the number of times the system is accessed and the activities that each user undertakes in the virtual
space.
According to Hardy, Bates, Antonioletti, and Seed (2005), the analysis of activity logs has been effective for
questioning certain aspects of online learning, but in some cases it becomes clear that the implementation of
virtual learning environments (VLEs) does not yield the expected results (Buelens, Roosels, Wils, & Van Rentergem,
2002).
Some authors (Feng & Heffernan, 2005, 2007) suggest that the analysis of logs can be useful in building
learning support systems or, as noted in Bisson, Bronner, Gordon, Nicaud, and Renaudie (2003), to identify students’
cognitive gaps or difficulties in adapting to the online environment. According to Hoskins and Van Hooff (2005),
little is known about the impact of online courses on students’ academic achievement. Dringus and Ellis (2005)
attempted to uncover the navigational structure of students that had written texts that were added to forums with
the aim of ascertaining their participation. Dönmez, Rosé, Stegmann, Weinberger, and Fischer (2005) performed a
multidimensional analysis of collaborative learning by means of linguistic treatment of forum content in order to
develop automatic analysis technology. This type of analysis also revealed the operations of collaborative working
RUSC VOL. 12 No 3 | Universitat Oberta de Catalunya and University of New England | Barcelona, July 2015
CC G. Lavigne, G. Gutiérrez Ruiz, L. McAnally-Salas and J. Organista Sandoval | CC by FUOC, 2015| Log Analysis in a Virtual Learning Environment… At the Autonomous University of Baja California (UABC), Mexico, students have been subjects of research via
the navigation logs of several courses on Moodle. Organista-Sandoval, Lavigne, & McAnally-Salas (2008) analyzed
students’ online activity and its relation with statistics learning. Students were classified into four clusters, of which
two had a great deal of online activity and also showed a tendency toward better grades. Analyses have also been
performed on learning styles (Díaz, 2010) and collaborative learning (Vasconcelos, 2011).
The contemporary pedagogy that forms the foundation for e-learning requires that the whole concept
of educational material focus on the student. Moreover, the hybrid process of teaching-learning needs new
approaches that will lead to more flexible teaching, such as the use of an instructional design based on the
characteristics resulting from students’ navigation in VLEs. However, there is a lack of knowledge about
the behavior of students in virtual environments. Therefore, this project, which is preliminary in nature, explores
to what extent, based on the use of the Moodle platform, learning strategies likely to affect students’ academic
performance can be identified.
Method
For this cross-sectional study, which employed a descriptive-exploratory approach, quantitative techniques were
used to analyze approximately 15,000 navigation logs from the Moodle1 platform.
Participants
The research was done through an analysis of the navigation logs of 33 students enrolled in a 16 week course
titled “Numerical Methods in Computer Engineering” in the School of Engineering, Architecture and Design at the
UABC. Based on existing data, we were able to identify the participants’ gender: three women and thirty men.
Course instruction was mixed, consisting of both onsite and virtual teaching. The onsite classes were conducted in a
computer lab where all the students were connected to the course, performing online tasks under the supervision
of the instructor.
Study context
Of the possible options in Moodle that could be used, the instructor included the following virtual activities:
t Forums: These were not mandatory but did account for 10% of the final grade; the forums had an evaluative
function, offering students the opportunity to present evidence of their performance in order to provide
feedback and assess learning.
t All of the suggested readings for the course were on the platform or on some other virtual site; not all the
readings were mandatory and students were not penalized if they failed to do them.
RUSC VOL. 12 No 3 | Universitat Oberta de Catalunya and University of New England | Barcelona, July 2015
CC G. Lavigne, G. Gutiérrez Ruiz, L. McAnally-Salas and J. Organista Sandoval | CC by FUOC, 2015| Log Analysis in a Virtual Learning Environment…
t Questionnaires and assignments, which were all mandatory and delivered virtually via the platform, had
deadlines, and students were penalized if they were turned in late.
t Feedback for each assignment was given through the platform; the final grade was given by the instructor.
Data collection
For the data collection, the navigation logs, which were available as reports, were extracted from the Moodle
platform by accessing the server logs, selecting the course and, within the course, all the students and their
respective activities. The data were exported to Excel and a database was generated. The students’ final grades – for
the activities carried out on the platform only – were also extracted.
Variables
The extracted data (retrieved directly from Moodle) were subsequently transformed into generic variables, from
which derived variables were inferred. As the platform offers seven types of resources and 22 types of activities, plus
tailored modules, the resources were stored in a single category, Resources, and the activities were reorganized into three categories: Assignments, Users, Forums – plus the Homepage.
The variables used are as follows:
t Connection date. Obtained by identifying the date (month and day) when the student logged into the
platform.
t Connection time. Obtained by identifying the exact time (hour, minutes and seconds) when the student
requested log-in. At the analysis level it was divided into five periods: 1:00 am to 5:59:59 am; 6:00 am to
10:59:59 am; 11:00 am to 3:59:59 pm; 4:00 pm to 8:59:59 pm; and 9:00 pm to 12:59:59 am.
t Actions performed on the platform. Obtained by identifying the module the student accessed: homepage,
forums, resources, activities and user.
t IP address. Obtained by identifying the IP address from which the student logged into the platform; these
were divided into two categories: those belonging to the UABC and those that did not.
t Final grade. Obtained by identifying the grade that the instructor gave each student for the activities
undertaken on the platform.
t Total number of HITS.2 Obtained by counting the total number of times the student requested access to any
page and/or module within it.
t Total number of log-ins. Obtained by identifying the number of times the student logged into Moodle.
t Mean length of each HITS. Obtained by dividing total length of time by the total number of HITS.
t Mean session length. Obtained by dividing total amount of time logged in by the total number of sessions.
RUSC VOL. 12 No 3 | Universitat Oberta de Catalunya and University of New England | Barcelona, July 2015
CC G. Lavigne, G. Gutiérrez Ruiz, L. McAnally-Salas and J. Organista Sandoval | CC by FUOC, 2015| Log Analysis in a Virtual Learning Environment…
t Total HITS per student in each of the modules or activities. Obtained by identifying the user’s name
within the activity modules and counting the number ofHITS.
t Log-in interval. Obtained by identifying the time when the student logged into the platform as well as the
time when he or she logged out.
Analysis tools
For the descriptive and inferential analyses, we used the Statistical Package for Social Sciences (SPSS). Cluster
analysis, as in Pérez & Santín (2006), consisted in dividing the group of students one or more times based on specific
characteristics; the agglomerative clustering method was used.
With the Organization Risk Analyzer (ORA)3 for dynamic meta-network assessment, paths were identified
using the database developed in Excel specifically for use in ORA. As the use of this tool for this type of research is
uncommon, a sample was taken and the paths of ten students were analyzed and plotted, although in this article
just one case is presented as an example.
Procedure
First, the navigation logs for each student were retrieved and exported to Excel; the data were filtered by removing
irrelevant information. Statistical analysis was performed using SPSS software. Subsequently, the navigation paths
were developed using the ORA application.
It is worth remembering that Moodle does not identify the log-ins themselves. It was necessary to identify them
based on the date, mean length of log-in, URL and the type of web page accessed before and after what appears
to be a new log-in, and sort them into chronological order. Likewise, the time format needed to be adjusted so that
it was possible to display seconds.
Results
Navigation characteristics
The descriptive elements of the main variables are revealed through the navigation characteristics. The time format
is expressed in days (dd), hours (hh), minutes (mm) and seconds (ss). The use of all or some of these time elements is
case dependent.
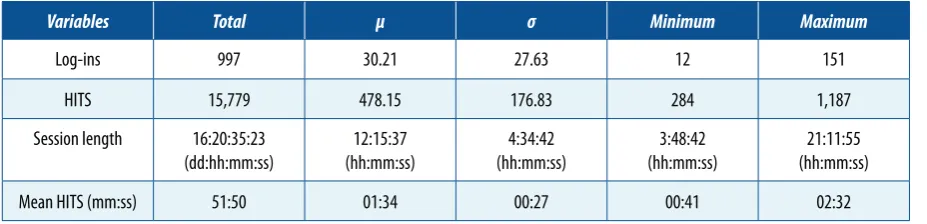
As can be seen below, the total number of log-ins throughout the course was 997, with a standard deviation
of 27.63; the total number of HITS was 15,779, with a mean of 478.15 and a standard deviation of 176.83, which
RUSC VOL. 12 No 3 | Universitat Oberta de Catalunya and University of New England | Barcelona, July 2015
CC G. Lavigne, G. Gutiérrez Ruiz, L. McAnally-Salas and J. Organista Sandoval | CC by FUOC, 2015| Log Analysis in a Virtual Learning Environment… underscores the vast differences between students. The mean time per HITS was 1 minute and 34 seconds; the
minimum was 41 seconds and the maximum, 2 minutes and 32 seconds.
Table 1.Description of the main variables
Variables Total μ σ Minimum Maximum
Log-ins 997 30.21 27.63 12 151
HITS 15,779 478.15 176.83 284 1,187
Session length 16:20:35:23 (dd:hh:mm:ss)
12:15:37 (hh:mm:ss)
4:34:42 (hh:mm:ss)
3:48:42 (hh:mm:ss)
21:11:55 (hh:mm:ss)
Mean HITS (mm:ss) 51:50 01:34 00:27 00:41 02:32
As a group, the students invested a total of 16 days, 20 hours, 35 minutes and 23 seconds on the platform, a
mean of 12 hours, 15 minutes and 37 seconds per student. Table 2 shows the modules in which all the available
activities were grouped. Assignments had a total of 7,314 HITS, while the four remaining modules together received
a total of 8,458 HITS. It should be noted that Homepage indicates the course access page as well as the page to which one returns from loop trajectories, such as when the back-space key is pressed.
Table 2. Description by activity module
Modules Total HITS μ σ Minimum Maximum
Assignments 7,314 221.64 60.02 138 447
Resources 2,485 75.30 31.57 21 188
Forums 2,516 76.24 37.82 20 210
Homepage 2,870 86.97 56.61 37 285
User 587 17.79 23.11 1 136
Table 3 shows the description of the time frames in which the students were logged into the course. The
night-time and early morning periods from 9:00 pm to 12:59 am and 1:00 to 5:59 am represent 42.89% of the total log-ins;
those that occurred between 4:00 and 8:59 pm, comprising 49.95% of the log-ins, correspond to sessions at the
onsite laboratory.
Table 3.Description by time of log-in
Schedule Total Log-ins % μ σ Minimum Maximum
1:00 - 5:59 am 260 24.78 7.88 11.621 0 54
6:00 - 10:59 am 44 4.19 1.33 1.88 0 8
11:00 am - 3:59 pm 28 2.66 0.85 1.34 0 5
4:00 -8:59 pm 524 49.95 15.88 8.46 9 47
RUSC VOL. 12 No 3 | Universitat Oberta de Catalunya and University of New England | Barcelona, July 2015
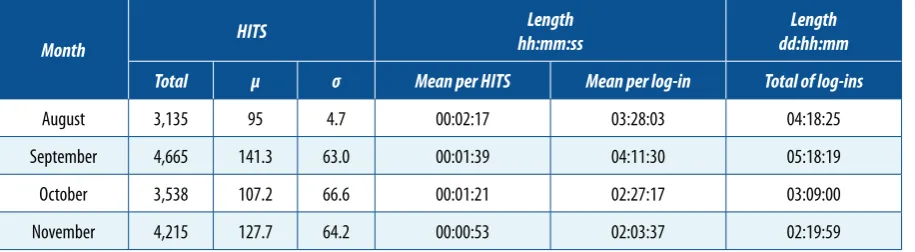
CC G. Lavigne, G. Gutiérrez Ruiz, L. McAnally-Salas and J. Organista Sandoval | CC by FUOC, 2015| Log Analysis in a Virtual Learning Environment… The following table shows descriptions grouped by month and HITS, as well as the mean time per HITS and
log-in. Two peaks of activity can be observed, in September and November, but the length of time per HITS decreased
steadily.
Table 4. Description grouped by month
Month
HITS Length
hh:mm:ss
Length dd:hh:mm
Total μ σ Mean per HITS Mean per log-in Total of log-ins
August 3,135 95 4.7 00:02:17 03:28:03 04:18:25
September 4,665 141.3 63.0 00:01:39 04:11:30 05:18:19
October 3,538 107.2 66.6 00:01:21 02:27:17 03:09:00
November 4,215 127.7 64.2 00:00:53 02:03:37 02:19:59
Table 4 above shows the distribution of the mean length per HITS by month. A steady drop in the mean time
per HITS can be observed, which indicates faster navigation and better use of time. Likewise, the total duration of
sessions per month rose during the second month and decreased steadily thereafter.
Cluster Analysis
Given the size of the standard deviations of some variables, the idea arose that there might be groups within the
student group as a whole. A non-hierarchical k-means cluster analysis (Pérez & Santín, 2006) was performed on
the data collected.
Table 5 shows the ANOVA analysis results, where the F values for the main variables can be seen, as well as the
significance level, which was less than 0.05 for the four variables.
Table 5.ANOVA result
Cluster Error
F Sig.
Main variables Mean square df Mean square df
Total HITS 169,625.7 1 26806.4 31 6.328 0.017
Total log-ins 3,440.313 1 677.2 31 5.080 0.031
Length of log-in (in seconds) 6.115E9 1 8.320E7 31 73.496 0.000
Mean length of HITS (in seconds) 12,294.789 1 391.7 31 31.382 0.000
The characteristics of the two groups are shown in Table 6. The total number of HITS for Group 2 was 2,843
lower than for Group 1. The total number of log-ins for Group 1 was 682, double that of Group 2, which logged in
315 times. The mean final grade, for the activities on the virtual course only, was 99.6 % for Group 1 and 98% for
RUSC VOL. 12 No 3 | Universitat Oberta de Catalunya and University of New England | Barcelona, July 2015
CC G. Lavigne, G. Gutiérrez Ruiz, L. McAnally-Salas and J. Organista Sandoval | CC by FUOC, 2015| Log Analysis in a Virtual Learning Environment… Table 6. Characteristics by group
Descriptive characteristics by group Group 1 Group 2
Total students 17 16
Total HITS 9,311 6,468
Mean length of HITS (mm:ss) 01:53 01:15
Total log-ins 682 315
Mean number of log-ins 40 20
Mean length of session (mm:ss) 32:49 27:04
Mean length of session per course (hh:mm:ss) 15:55:43 08:21:45
Mean grade 99.6 98
Table 7 shows that the assumption of equality of variances was supported by Levene’s test, since a value of
0.000 was obtained; therefore, the observed values forStudent’s t-testof 2.929 are taken into account, with a significance level of 0.006.
Table 7.Contrast t-student for independent samples
Final Grade
Levene’s test for
equality of variances Student’s t-test for equal means
F Sig. t df Bilateral
sig.
Mean
Diff. Dif. standard error
Equality of variances assumed 16.176 .000 2.929 31 0.006 1.51651 0.51776
Equality of variances not assumed - - 2.854 17.606 0.011 1.51651 0.53140
These results indisputably point to the existence of two groups.
Navigation paths
Navigation paths that shed light on the way the student negotiates the platform while making use of the different
options available can be inferred by identifying what he or she accesses during each session. To date, we have been
unable to find any software specifically for analyzing the students’ navigation paths, making it necessary to do the
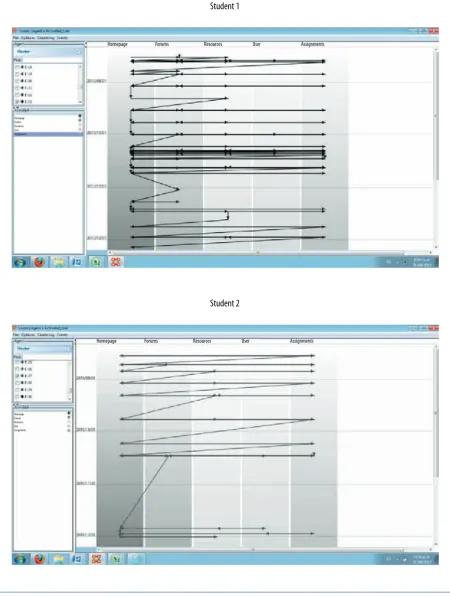
analysis by hand; therefore, we present the results for just two students, one from each group.
In the condensed report of the two students’ sessions, important differences in navigation stood out immediately.
Student 1 logged in 34 times and participated considerably more in the forums and consulted the available learning
resources more times than Student 2, who only logged in 12 times and focused on completing the assignments,
both at the beginning and the end of the course. The first received a grade of 100% and the second 94.7%.
The following figure shows the navigation paths followed by the students throughout the course. Student 1
showed greater activity; of the 308 HITS recorded for this student participating in the course, 205 took place in the
assignments module, compared with 232 for Student 2, which means that Student 2 dedicated 65.5% of his or her
RUSC VOL. 12 No 3 | Universitat Oberta de Catalunya and University of New England | Barcelona, July 2015
CC G. Lavigne, G. Gutiérrez Ruiz, L. McAnally-Salas and J. Organista Sandoval | CC by FUOC, 2015| Log Analysis in a Virtual Learning Environment… Figure 1. Navigation paths of the two students analyzed, produced as they accessed different modules of the platform during the course, divided into months
Student 1
Student 2
Homepage Forums Resources User Assignments
Homepage Forums Resources User Assignments
Homepage Forums Resources User Assignments
RUSC VOL. 12 No 3 | Universitat Oberta de Catalunya and University of New England | Barcelona, July 2015
CC G. Lavigne, G. Gutiérrez Ruiz, L. McAnally-Salas and J. Organista Sandoval | CC by FUOC, 2015| Log Analysis in a Virtual Learning Environment… Students in Group 1, characterized by greater activity on the platform (in terms of the number of accesses
and time spent), obtained a higher mean grade (99.6%). Students in Group 2, characterized by less activity on
the platform, obtained a lower mean grade of 98%. Thus, each group had a learning strategy that was almost the
complete opposite of the other’s. For Group 1, it was achieving the maximum grade, regardless of the time spent
online, while for Group 2, it was spending less time online to achieve an optimum grade. It should be noted that the
difference between the two mean grades, despite being small, was statistically significant.
Discussion
In this study, key elements of the teaching-learning process, whether virtual or not, became evident through the
students’ accessing the various elements within the different modules, such as assignments and resources, which
included questionnaires and lectures (Coll, 2004). Around 9,700 of the 15,779 total HITS made throughout the entire
course by the students were presented. The importance of the processes of socialization (Ávila & Bosco, 2001) and
communication (Barajas, 2002) have been recognized, evidenced in this case by the 2,500 occasions on which the
students accessed the forum module. As in Boneu (2007), the students had the option of using the platform at any
time of the day or night from any location.
The students’ success in finding different ways of navigating within the VLE demonstrated the potential to
which Díaz (2010) refers. While the virtual platform offers the same range of possibilities to all users, each inherently
determines the results of its use, regardless of the platform structure or the design intent that the instructor
implements. By utilizing the information at the time it is generated to provide the instructor with feedback,
navigation logs may have a positive impact on teaching practice by guiding instructors in their performance and
helping them choose the content and strategy to employ in order to obtain the best academic outcomes.
Do students follow the learning paths established by instructors? Yes; the logs analyzed suggest that they
make use of the resources more independently. Do students apply something similar to free will in managing their
navigation paths in VLEs? Most definitely; students decide how to access the platform and how to navigate within
it, within its design limits.
From this preliminary analysis, some observations were made that could be transformed into knowledge
through further studies of this type. According to Lavigne, Organista and McAnally (2008), and Lavigne,
McAnally-Salas, Organista-Sandoval, Díaz-López, and Vasconcelos-Ovando (2011), it appears to be usual for the duration
of HITS to decrease over time, with a mean length of approximately one minute. This observation raises certain
questions: What can students do in one minute? How can instructors design activities under these circumstances?
Based on their navigational characteristics, it was possible to identify two groups of students, each with very
different learning strategies in terms of the use of the navigational possibilities offered, but with relatively similar
success. It should be emphasized that these two groups had very different navigation patterns, which were the
result of the different learning strategies chosen and, consequently, each one’s use of time in the virtual space.
Nevertheless, the final grades were equally high in both groups. This element, which was also observed by Lavigne
et al. (2008), should be the object of further study in order to define lines of flexibility in instructional design. As
this is an emerging topic, the tools and techniques available for the treatment of data are currently not the most
expedient. Comparative studies using samples comprising students with different profiles and technological
abilities could be conducted. Furthermore, qualitative analysis could clarify behaviors thus far unexplored and,
RUSC VOL. 12 No 3 | Universitat Oberta de Catalunya and University of New England | Barcelona, July 2015
CC G. Lavigne, G. Gutiérrez Ruiz, L. McAnally-Salas and J. Organista Sandoval | CC by FUOC, 2015| Log Analysis in a Virtual Learning Environment…
References
Avila, P., & Bosco, M. (2001). Virtual environment for learning a new experience. 20th International Council for Open and Distance Education (Germany). Retrieved from http://investigacion.ilce.edu.mx/panel_control/doc/
c37ambientes.pdf
Backhoff-Escudero, E., Lavigne, G., Organista-Sandoval, J., & Aguirre-Muñoz, L. C. (2007). Modelo mixto de
educación digital-presencial: Una alternativa para el posgrado en México. In M. G. Cardenas López, A. Vite Sierra,
& L. Villanueva (Eds.), Ambientes virtuales para la educación y para la rehabilitación psicológica (pp. 17-33). Mexico City: Universidad Nacional Autónoma de México.
Baker, R. S., & Yacef, K. (2009). The State Of Educational Data Mining In 2009: A Review And Future Visions. JEDM
-Journal of Educational Data Mining, 1(1), 3-17. Retrieved from http://www.educationaldatamining.org/JEDM/ index.php/JEDM/article/view/8/2
Barajas, M. (2002). Restructuring Higher Education Institutions in Europe: The case of virtual learning environments.
Interactive Educational Multimedia 5, 1-28. Retrieved from http://greav.ub.edu/der/index.php/der/article/ view/52/140
Bisson, G., Bronner, A., Gordon, M. B., Nicaud J. F., & Renaudie, D. (2003, April). Analyse statistique de comportements
d’élèves en algèbre. In C. Desmoulins, P. Marquet & D. Bouhineau (Eds.) Actes de la conférence EIAH 2003
(Proceedings of the EIAH 2003 Conference) (Strasbourg, France). Accesible from archiveseiah.univ-lemans.fr/
EIAH2003/Infactes/ActesEiahCom.pdf
Boneu, J. (2007). Open e-learning platforms for supporting open educational resources. RUSC. Universities and Knowledge Society Journal, 4(1), 36-47. doi: http://dx.doi.org/10.7238/rusc.v4i1.298
Buelens, H., Roosels, W., Wils, A., & Rentergem, L. v. (2002, Sep 2nd). One Year e-Learning at the K.U. Leuven, an Examination
of Log-Files. Paper presented at the European Conference: The New Educational Benefits of ICT in Higher
Education, Rotterdam, Netherlands. Retrieved from https://lirias.kuleuven.be/bitstream/123456789/287540/1/
Buelens_2002_One_year_E-learning.pdf
Coll, C. (2004). Psicología de la educación y prácticas educativas mediadas. Synectics, 25, 1-24. Retrieved from
http://www.virtualeduca.org/ifdve/pdf/cesar-coll-separata.pdf
Concannon, F., Flynn, A., & Campbell, M. (2005). What campus-based students think about the quality and benefits
of e-learning. British Journal of Educational Technology, 36(3), 501-512. doi: http://dx.doi.org/10.1111/j.1467-8535.2005.00482.x
Díaz, K. (2010). Exploración de la relación entre estilos de aprendizaje y navegación en un curso en línea de la Maestría en Ciencias Educativas de la UABC (Master’s Thesis). Retrieved from http://iide.ens.uabc.mx/blogs/mce/files/2010/10/ TESIS-KARLA-MA-DIAZ-LOPEZ.pdf
Dönmez, P., Rosé, C., Stegmann, K., Weinberger, A., & Fischer, F. (2005). Supporting CSCL with automatic corpus
analysis technology. Proceedings of the International Conference of Computer Support for Collaborative Learning (CSCL 2005), 125-134. doi: http://dx.doi.org/10.3115/1149293.1149310
Dringus, L. P., & Ellis, T. (2005). Using data mining as a strategy for assessing asynchronous discussion forums.
Computer andEducation Journal, 45, 141-160. doi: http://dx.doi.org/10.1016/j.compedu.2004.05.003
Feng, M., & Heffernan, N. T. (2005). Informing Teachers Live about Student Learning: Reporting in the Assistment
RUSC VOL. 12 No 3 | Universitat Oberta de Catalunya and University of New England | Barcelona, July 2015
CC G. Lavigne, G. Gutiérrez Ruiz, L. McAnally-Salas and J. Organista Sandoval | CC by FUOC, 2015| Log Analysis in a Virtual Learning Environment… Feng, M., & Heffernan, N. T. (2007, April). Assessing Students’ Performance Longitudinally: Item Difficulty Parameter
vs. Skill Learning Tracking. Paper presented in the Annual Meeting of National Council of Measurement on
Educational (NCME 2007) (Chicago). Retrieved from http://web.cs.wpi.edu/~mfeng/pub/NCME_final_version.
Hardy, J., Bates, S., Antonioletti, M., & Seed, T. (2005). Integrating e-Learning and On-Campus Teaching II: Evaluation
of Student Use. Research Proceedings of the 12th Association of Learning Technology Conference,UK, 140-153. Retrieved from http://www.ph.ed.ac.uk/elearning/publications/hardyaltc2005-v2.doc
Hershkovitz, A., & Nachmias, R. (2008). Developing a Log-Based Motivation Measuring Tool. Retrieved from
http://www.sciweavers.org/publications/developing-log-based-motivation-measuring-tool
Hoskins, S. L., & Van Hooff, J. C. (2005). Motivation and ability: which students use online learning and what
influence does it have on their achievement? British Journal of Educational Technology, 36(2), 177-192. doi: http://dx.doi.org/10.1111/j.1467-8535.2005.00451.x
Lavigne, G., Backhoff-Escudero, E., & Organista-Sandoval, J. (2008). La hibridación digital del proceso educativo.
In J. Vales García (Ed.), New Technologies for Learning (pp. 43-60). Mexico City: Pearson-Prentice Hall.
Lavigne, G., McAnally-Salas, L., Organista-Sandoval, J., Díaz-López, K. M., & Vasconcelos-Ovando, M. P. (2011, June).
Moodle et ses registres de navigation: pouvons-nous en tirer des connaissances pratiques? In (No eds.) Recherche en éducation et TIC. Proceedings of the Congrès de la Association Francophone International de Recherche Scientifique en Éducation (pp. 10-16). AFIRSE-UNESCO (Paris, France).
Lavigne, G., Organista, J. S., & McAnally, S. L. (2008). Étude préliminaire des pratiques de navigation dans un
environnement d’apprentissage informatique et mesure de leur efficacité pédagogique. Revue internationale des technologies en pédagogie universitaire, 5(1), 6-26. doi: http://dx.doi.org/10.7202/000637ar
Organista, J. S., Lavigne, G., & McAnally-Salas, L. (2008). Aprendizaje de estadística y la actividad en línea del estudiante:
estudio preliminar de relaciones. Online Journal of Current Educational Research, 8(3), 1-27. Retrieved from
http://revista.inie.ucr.ac.cr/uploads/tx_magazine/estad.pdf
Perera, D., Kay, J., Koprinska, I., Yacef, K., & Zaiane, O. (2009). Clustering and sequential pattern mining to support team
learning. IEEE Transactions on Knowledge and Data Engineering, 21(6), 759-772. doi: http://dx.doi.org/10.1109/ TKDE.2008.138
Pérez, C., & Santín, D. (2006). Data Mining: Soluciones con Enterprise Miner. Madrid: RAMA.
Rochefort, B., & Richmond, N. (2011). Connecting Instruction to Connected Technologies – Why Bother?
An Instructional Designer’s Perspective. RUSC. Universities and Knowledge Society Journal, 8(1), 200-216. doi: http://dx.doi.org/10.7238/rusc.v8i1.942
RUSC VOL. 12 No 3 | Universitat Oberta de Catalunya and University of New England | Barcelona, July 2015
CC G. Lavigne, G. Gutiérrez Ruiz, L. McAnally-Salas and J. Organista Sandoval | CC by FUOC, 2015| Log Analysis in a Virtual Learning Environment…
About the authors
Gilles Lavigne
ORCID ID: http://orcid.org/0000-0002-8859-4864
Senior Research Professor, Institute of Educational Research and Development, Autonomous University of Baja California (UABC), Mexico
Dr Lavigne was full professor for twenty-one years at Télé Université, Université du Québec (Tele University, Quebec University, Canada), an entirely online university. His background experience is very broad, having worked in administration as director of graduate studies and research for eight years; in international cooperation for twelve years as head of project and/or scientific project director in various countries (Vietnam, Senegal, Mauritius, Brazil, Costa Rica, Chile, Belgium…, and currently in Cuba); as an instructor at the higher education level, both onsite and online – receiving the Minister of Education of Quebec Award in 2000 for the best online course; and in research in the area of technology in education. He has several publications in Spanish as well as in French and English.
Instituto de Investigación y Desarrollo Educativo Universidad Autónoma de Baja California Carretera Tijuana-Ensenada, km 103 s/n 22860 Ensenada (Baja California) Mexico
Genoveva Gutiérrez Ruiz
ORCID ID: http://orcid.org/0000-0003-2414-6496
Doctoral Student, Institute of Educational Research and Development, Autonomous University of Baja California (UABC), Mexico
Ms Ruiz has a bachelor’s degree in Psychology and a master’s degree in Education. She has experience as a practicing clinical psychologist and has published in the field of education.
RUSC VOL. 12 No 3 | Universitat Oberta de Catalunya and University of New England | Barcelona, July 2015
CC G. Lavigne, G. Gutiérrez Ruiz, L. McAnally-Salas and J. Organista Sandoval | CC by FUOC, 2015| Log Analysis in a Virtual Learning Environment…
Lewis McAnally-Salas
ORCID ID: http://orcid.org/0000-0002-4200-2640
Head of Graduate Studies and Research, Institute of Educational Research and Development, Autonomous University of Baja California (UABC), Mexico
Dr McAnally-Salas received his master’s degree in Education from the Autonomous University of Baja California (UABC), Mexico, and gained his doctorate in International Education from the Center for Excellence of the Autonomous University of Tamaulipas (UAT), Mexico. He is a member of the National System of Researchers in Mexico, at Level 1. His area of research deals with technology-mediated learning processes, such as online education, educational design for online courses, teacher training for online instruction and the processes of dissemination of technology for learning in educational institutions. He has published articles in Mexican and in international journals, has been a speaker at academic conferences in Mexico and abroad, and has contributed chapters for several books. He was director of the
Online Journal of Educational Research (REDIE) from October 2003 to March 2009 as well as in 2010.
Instituto de Investigación y Desarrollo Educativo Universidad Autónoma de Baja California Carretera Tijuana-Ensenada, km 103 s/n 22860 Ensenada (Baja California) Mexico
Javier Organista Sandoval
ORCID ID: http://orcid.org/0000-0001-8101-5084
Doctorate in Education from the Autonomous University of Baja California (UABC), Mexico
Dr Organista’s doctoral dissertation focused on innovation in statistics teaching through the use of learning objects and constructivism. He has taught various courses both at the doctoral and master’s degree level, specifically in the area of educational technology and data analysis. He is a member of the National System of Researchers in Mexico, at Level 1. He has coordinated several different projects in the area of Educational Technology and Internet. He currently directs the project “Typology of the educational use of 3G mobile devices by students at two campuses of the UABC in Ensenada”. He is the author of several research articles in the area of online education, m-learning and technology-assisted statistical information analysis. His areas of interest are online educational processes and m-learning.
Universidad Autónoma de Baja California Carretera Tijuana-Ensenada, km 103, s/n 22860 Ensenada (Baja California) Mexico
RUSC VOL. 12 No 3 | Universitat Oberta de Catalunya and University of New England | Barcelona, July 2015