R E G U L A R A R T I C L E
Open Access
Router-level community structure of the
Internet Autonomous Systems
Mariano G Beiró
1,2*, Sebastián P Grynberg
2and J Ignacio Alvarez-Hamelin
2,3,4*Correspondence: [email protected] 1ISI Foundation, Turin, Italy Full list of author information is available at the end of the article
Abstract
The Internet is composed of routing devices connected between them and organized into independent administrative entities: the Autonomous Systems. The existence of different types of Autonomous Systems (like large connectivity providers, Internet Service Providers or universities) together with geographical and economical constraints, turns the Internet into a complex modular and hierarchical network. This organization is reflected in many properties of the Internet topology, like its high degree of clustering and its robustness.
In this work we study the modular structure of the Internet router-level graph in order to assess to what extent the Autonomous Systems satisfy some of the known notions of community structure. We observe that most of the classical community detection methods fail to detect the Autonomous Systems as communities, mainly because the modular structure of the Internet (as that of many complex networks) is much richer than what can be captured by optimizing a global functional:
Autonomous Systems have largely variable sizes, structures and functions. Classical methods are severely affected by resolution limits and by the heterogeneity of the communities; even when using multiresolution methods, there is no single resolution at which most of the communities can be captured.
However, we show that multiresolution methods do find the community structure of the Autonomous Systems, but each of them has to be observed at the correct resolution level. Then we develop a low-complexity multiresolution modularity optimization algorithm that finds communities at different resolution levels in a continuous scale, in one single run. Using this method, we show that with a scarce knowledge of the node affiliations, multiresolution methods can be adjusted to retrieve the Autonomous Systems, significantly improving the results of classical single-resolution methods. Finally, in the light of our results, we discuss recent work concerning the use of a priori information to find community structure in complex networks.
Keywords: Internet topology; community structure; autonomous systems; complex
networks
1 Introduction
The Internet is a complex network composed of routing devices (routers) which are orga-nized into administrative entities, theAutonomous Systems (ASes). Each AS has its own routing policies and design criteria, which are based on technological, geographical and economical constraints and aim at maximizing the performance in terms of bandwidth,
delay and resilience. ASes are nowadays identified with large carriers, ISPs (Internet Ser-vice Providers), IXPs (Internet Exchange Points), CDNs (Content Delivery Networks) and universities, among others, and they are interconnected as the result of commercial agree-ments between them, either as peers or in provider-customer relationships.
ASes can also be classified into core ASes (once called Tier-’s), and peripheral ASes. The core ASes are typically the large carriers and some CDNs and are densely connected be-tween them. Instead, most ISPs lay in the periphery and are connected to one or more core ASes. This core-periphery division provides the Internet with an interesting hierarchy. In fact, many large-scale properties as the resilience, scalability and small-worldness of the Internet arise largely as a consequence of its hierarchical structure and self-organization [, ]. Understanding them might help developing better models of the Internet and im-proving its performance, by optimizing routing or reducing congestion, for example.
In this work we approach the modular structure of the Internet at the router level by trying to identify the ASes as communities of nodes. We explore different notions of com-munity structure, and we shall see that: (a) The goodness of the communities is in some way related to the core-periphery hierarchy of the ASes. (b) Though most of the ASes satisfy some notion of community, their largely variable sizes represent a hard problem for many classical community detection algorithms. (c) Using multiresolution methods instead, the ASes can be retrieved if each of them is observed at the right resolution level. Finally, we shall propose a method for identifying ASes using samples of nodes.
Our work falls into the study of Internet topology. Some of the main results on this area can be found in []. In particular, the study of community structure of the Internet at the Autonomous Systems level has been previously approached in [–] and, to the best of our knowledge, the community structure at the router level has only been addressed in [] in the context of traffic queuing analysis. For the community detection problem in general, we address the reader to the survey by Fortunato [].
The paper is organized as follows: In Section we describe the Internet exploration that we used. In Section we apply several community detection algorithms to it, matching the obtained communities to the ASes; we also introduce a hierarchical partitioning algorithm based on multiresolution modularity maximization and we determine which is the best resolution for each AS; we also evaluate other multiresolution algorithms. In Section we evaluate the results from the Internet topology perspective, explaining their variability: why some ASes satisfy our notion of community while others do not. We also discuss the methodological problems of community detection in heterogeneous networks and some possible solutions. Finally, in Section we extract the main results of this work.
2 Dataset
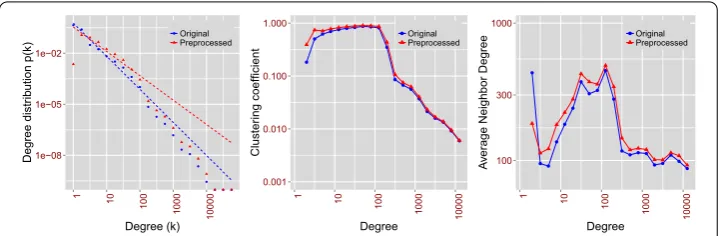
Figure 1 Graph distributions.Node degree distribution (left), average clustering coefficient as a function of node degree (center) and average neighbour degree as a function of node degree (right). The colors represent the network before (blue) and after (red) the preprocessing, i.e. removing the chains and filtering the 2-core of the graph. The node degree distributions have been adjusted to a power law by max-likelihood estimation, obtaining a slopeα= 1.94 for the original network (blue dashed line) andα= 1.41 after the preprocessing (red dashed line).
routers (routers which do not answer probes). Traceroute-based sampling is not a perfect sampling and has several biases []: some links are more frequently visited than others, and some links are probably not visited at all. This, together with the fact that the Internet is a fast evolving network, turns the map into a partial, approximate view of the Internet. However, router-level maps of the Internet have several applications, like improving routing algorithms by taking into account the network topology, understanding informa-tion propagainforma-tion, and studying the robustness and scale-free properties of networks [, ]. They can also be used for constructing maps of the Internet at the Autonomous Systems level [, ].
In this work we used the CAIDA router-level Internet map from October th, []. From the raw data we obtained an undirected graph consisting on ,, nodes (the routers) connected by ,, edges; .% of the nodes also contain information about their Autonomous System (AS) affiliation (for a description on how this information was inferred, consult [] and the CAIDA page []). Figure plots the degree distribu-tion and the average clustering coefficient and neighbour degree as a funcdistribu-tion of the node degree.
2.1 Graph preprocessing
The graph contains some low-degree structures which make it difficult to analyse its com-munity structure without some preprocessing. Regarding the AS affiliation, for example, the dataset contains , different ASes, of which , have less than nodes, and ASes contain single node of degree . We detected the presence of manytendrils
(sequences of degree- nodes finishing with a degree- node) involving ,, nodes. These nodes do not take part in any triangle or clustered structure of the network, and this is probably due to a limitation on the exploration. However, they can be considered to belong to the community of the first node with higher degree they are attached to, so we removed these nodes by computing the -core of the graph [].
Table 1 Correlation between having degree 2 and having AS affiliation
degree2 AS
True False
True 0.12 0.16 False 0.70 0.02
The table shows the joint distribution of the indicator variablesdegree2:having degree 2andAS:having AS affiliation.
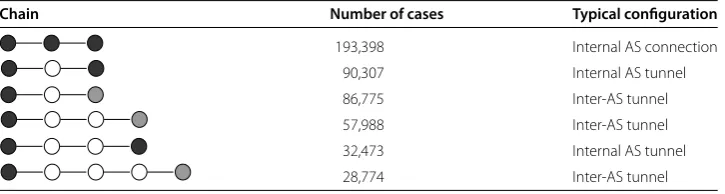
Table 2 Most common cases of chains of routers
Chain Number of cases Typical configuration
193,398 Internal AS connection
90,307 Internal AS tunnel
86,775 Inter-AS tunnel
57,988 Inter-AS tunnel
32,473 Internal AS tunnel
28,774 Inter-AS tunnel
Black and gray colours represent some hypothetical ASes; white nodes do not have AS affiliation. Many of these chains are caused by tunnels (like MPLS tunnels); others are probably due to a tie in the AS affiliation algorithm. After removing these chains, 99.2% of the nodes have AS affiliation.
nodes do contain AS affiliation. Some of the chains are due to the presence ofMPLS tun-nels[] or other types of tunnels: .% of nodes involved in chains and without AS affil-iation have private IP addresses (i.e. their interfaces did not answer the traceroute probes). We could classify .% of the chains as internal to the ASes, and .% of them as inter-AS chains.
Thus, we decided to clear the graph by restricting the analysis to the -core and replac-ing all the chains by an edge between their endpoints. We found , chains of different types, as resumed in Table . The resulting graph after this process has ,, nodes and ,, edges. .% of the nodes have AS affiliation now, and just , differ-ent ASes are found. The graph distributions after this preprocessing are shown in red in Figure . We observe that low degree nodes tend to have a higher clustering now, while the removal of chains changed the average neighbor degree for nodes of low degree.
3 Analysis methods and results
In a first stage, we analysed the community structure of the Internet router-level graph by applying several community detection methods:
• Infomap, by Rosvall and Bergstrom, based in the description length []. • LPM, the Label Propagation Method by Raghavan et al. [], which performs a
diffusion process on the graph.
• Deltacom, an efficient greedy algorithm for modularity optimization introduced here. • Louvain, a fast modularity optimization algorithm [].
• CommUGP, a local community detection method [].
3.1 A hierarchical partitioning method based on multiresolution modularity
Deltacom is based on the optimization of modularity. We recall that modularity was intro-duced by Newman in [, ] and, since then, several methods for its maximization have been proposed, like the one by Guimerà and Amaral based on simulated annealing [], the extremal optimization method by Duch and Arenas [], the fast greedy algorithm by Blondel et al. [], or the multilevel algorithm by Noack and Rotta [].
The following two results about modularity are fundamental to our present work: in [] Fortunato and Barthélemy showed that modularity has a resolution limit, i.e., its maxi-mization tends to put small communities together when they are connected among them; in [] Reichardt and Bornholdt observed that modularity can be understood as the Hamil-tonian of a ferromagnetic Potts model. Thus, maximizing the modularity implies finding the ground-state of this model, and the authors developed a simulated annealing based procedure for doing it.
Deltacom considers the optimization of the modularityQas a particular case of the op-timization of a more general functionalQt, with a resolution parametert, in which mod-ularity corresponds to a normalized resolution, i.e.,t= . The source of our idea can be traced back to theγ resolution parameter in [], and has also been followed by Lanci-chinetti and Fortunato in []. In [], the maximization is based on simulated annealing, it must run at one single resolution each time, and its computational complexity is very high. The advantage of our method is that the resolution evolves dynamically, so that all the partitions at different resolutions can be produced during one single run, and with a low computational complexity.
Deltacom is based on an agglomerative greedy algorithm; each step of the agglomera-tive process is a local maximum forQt, i.e., the generalized modularity, at some particular resolutiont. In other words, for eacht-value a community partition is found, which is locallyt-optimal in some sense. As these communities are joined, the resolution shrinks andtgets smaller. Fort= , the structure is a local maximum for the classical modularity. In other words, we observe the graph as by using a magnifying glass, obtaining parti-tions at every resolution level. The result is a hierarchical structure in which partiparti-tions at higher resolution levels are always refinements (in a mathematical sense) of those at lower ones.
Here we present a brief description of how the algorithm works. Further mathematical details on the properties ofQtand of our maximization algorithm can be found in [].
.. Newman’s modularity
Given a graphG= (V,E) and a partition of it,C, the modularity of the partition is defined as []:
Q(C) = m
(i,j)∈V
Aij–
kikj m
δ(i,j), ()
wheremis the amount of edges,A= (Aij),i,j∈Vis the adjacency matrix of the graph,ki is the degree of the nodeiandδ(i,j) is the indicator function that points out if nodesiand
The expression on the right side of Eq. compares the internal connections in the com-munities (represented by theAij·δ(i,j) product) with the expected number of connections under a random graph with the same expected degrees in the nodes and the same com-munities. It can be restated as a sum throughout the communities, in the following way:
Q(C) = m
C∈C
eC–
k C m
, ()
wherekC is the sum of degrees of the nodes in each communityC, andeC is twice the number of internal edges of it.
Now, in many agglomerative clustering methods, communities are joined by pairs at each step, until finding a local maximum. Joining two communitiesCandCduring the process produces the following variation in theQfunctional:
Q= m
eC,C–kC·kC m
, ()
wheree(C,C) is twice the number of edges betweenCandC.
.. Introducing a resolution parameter
We introduce a resolution parametertas
Qt(C) = m
C∈C
eC–t·
k C m
. ()
Now the functional variation after joining two communitiesCandCbecomes:
Qt= m
eC,C–t·kC·kC
m
. ()
It is clear that a positiveQt value for a particulartalso implies a positive (and even higher)Qt for any resolutiont<t. In other words, any agglomerative process which monotonically increasesQtalso serves as a process monotonically increasingQt for anyt<t.
It is also immediate that a very largetvalue discourages any join, becauseQtis negative for every pair of communities. It can also be shown that fort larger enough the global maximum forQtwould have each node isolated in its own community.
Thus, what we propose is to start with a large enought(so that the optimal initial par-titionCthas as many communities as nodes) and then to decreasetas little as possible so that a join can be made, i.e., so that someQtbecomes positive. Thistvalue is just
t(C) = max C,C∈C
e(C,C)·m kC·kC
. ()
Algorithm :Deltacom: Multiresolution modularity optimization
Input: A graphG= (V,E)
Output: A set of weakly optimal partitionsCtfor every resolution value
tmin≤t≤tmax, such thatCt≺Ctwhenevert<t
. begin
. D={{v},v∈V}#Initial partition
. tmax=maxC,C∈D{e(CkC,C·k)C·m}#Initial t
. t=tmax
. Ct=D
. while|D|> do
. whilethere exists a pair(C,C)inDsuch thatQt(C,C) = do
. D=D\ {C,C} ∪ {C∪C}
. end
. if|D|> then
. t=maxC,C∈D{e(C,C
)·m
kC·kC }#Decreasing t
. C(t,t]=D#Output partition for the range (t,t] is
finished
. else
. t=t#In the last step we cannot decrease t
. Ct=D#Last partition; composed of one large
community
. end
. t=t
. end
. tmin=t#Minimum resolution; all the graph into one large
community
. end
and the obtained result is a set of locally optimal partitionsCtfor every resolutiont, and such that the finer partitions are refinements of the coarser-grained ones. Even more, these partitions are what we callweakly optimalpartitions, in the sense that not only the join of any pair of communitiesC,Cwould decreaseQt, but also any coarser partition (i.e. obtained by joining its communities in any way) would also decrease it.
The code for the Deltacom algorithm is freely available at SourceForge []; given a graph as a list of edges, it produces a set of community partitions for every resolution value. The formalization of the process is contained in Algorithm . This algorithm produces weakly optimal partitions for the generalized modularityQt. In particular,Cis a weakly
optimal partition for the classical modularityQ. The notationC(a,b]represents that the
partition is weakly optimal for every resolution in the (a,b] interval. For a complexity analysis, we shall consider keeping a set of listsLC, one for each community, containing its neighbour communitiesCand the edge cut with each of them. The lists shall be ordered by a community identifier. The initial construction of these structures has time complexity
O(m·log(m)) (as each list has sizesC, with
CsC=m, and
steps: (a) finding a pair of communities with(Qt) = ; (b) joining the communities; and (c) decreasingt. The first step implies traversing all the lists; each(Qt) computation is O() so this step’s complexity can be bounded toO(m). Joining two communities implies merging their lists into one, and also updating the lists of their neighbour communities. As all the lists are ordered, this can be done by traversing those lists, which we can bound toO(m). Finally, decreasingtimplies traversing all the lists and computing e(CkC,C·k)·m
C for each element. This is againO(m). Putting all together, we have at mostncycles withO(m). The final complexity is thenO(nm).
While O(nm) is a theoretical upper bound for a general graph, the practical running time for sparse graphs can be greatly reduced with some considerations: step (c) gives all the information for the next step (a), because the community pair which maximizedtin line1.11is the same that will haveQt= in the next iteration; also, by keeping a search structure like an ordered tree with all the pair of connected communitiesC,Cordered by
e(C,C)·m
kC·kC decreasingly, there is no need to traverse all the lists in each iteration, but we must just update the modified values into this tree and choose the community pair at its head as the one maximizingt. For sparse graphs, this process has an upper complexity bound of
O(m·log(m)·smax
C ), wheresmaxC is the maximum number of neighbour communities that a community may have at any time of the process.
3.2 Finding ASes through similarity maximization
We applied the five forementioned algorithms (Infomap, LPM, Deltacom att= , Louvain and CommUGP) to the CAIDA dataset. Each of these methods produces a partitionC of the graph. In order to determine if the communities in these partitions are related to the ASes, we shall use this criterion: for each AS in the graph, and given a partitionC, we find the communityC∈C which maximizes theJaccard similarity:
J(C,AS) =|C∩AS|
|C∪AS|.
This most similar community shall be calledCAS():
CAS()=arg max C∈C
J(C,AS).
And this maximum Jaccard similarity value will be called therecall scoreof the AS (ac-cording to []) and noted asR(AS):
R(AS) =J
CAS(),AS. ()
In this way, we can evaluate each of the methods by observing the empirical cumula-tive distributions of the recall score of the ASes,R(AS) (Eq. ). Those methods with
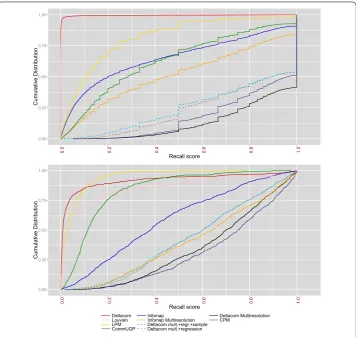
Figure 2 Cumulative distribution of the AS recall score.(Upper) The curves represent the cumulative distribution of the recall scores over all the ASes for different community discovery methods:R1(AS) is shown for Deltacom att= 1 (i.e., modularity maximization) (red), LPM (yellow), Louvain modularity maximization (pink), CommUGP (green) and Infomap (blue). If we find the best resolution level for each AS using the multiresolution versions of Deltacom, Infomap and CPM, we get theblack,orangeandpurplecurves instead. Thebrowncurve represents the Multiresolution Deltacom using the resolution value˜tpredicted by the regression line for each AS, and then computingR1(AS) inC˜t. Finally, if we use 15% of the AS routers when matching the partition atC˜tfor each AS, then we get thelight bluecurve. (Lower) The same methods as in the upper picture, but restricted to ASes containing at least 100 nodes.
We can clearly see that the five methods fail to reproduce the ASes structure. In the best performing one, Infomap, only % of the large ASes reach a recall of ., which is however small. A premature conclusion might state that the Internet graph does not have communities at the router level, or at least that they are not related with the Autonomous Systems. But we will show that this is not the case, and that the failure of the methods is in part due to the largely variable sizes, internal structures and functions of the Internet ASes. However, the structure of the Internet graph at the router level can be better captured by using multiresolution methods.
In order to assess our hypothesis we shall exploit the resolution parametertof Delta-com, which provides us with a new level of freedom for matching the ASes in the hier-archical community tree. For eachtin the range [tmin,tmax] we have a partitionCt. Thus, we shall define a new recall scoreR(AS) based on exploring a parameter spacewith
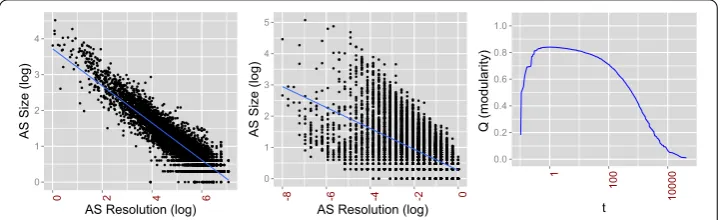
Figure 3 Correlation between the AS size and resolution in Deltacom and CPM, and evolution ofQin Deltacom.The left picture plots the correlation between the AS size (in terms of the amount of routers) and the resolutiontat which it is best detected by Multiresolution Deltacom. The correlation coefficient between size and resolution in the log-scale is –0.93. A linear regression model between them gives the line
y= 4.09 – 0.60xshown in blue, with a determination ofr2= 0.87. The central picture does the same for the best resolutionγin the Constant Potts Model (CPM), with a correlation of –0.65. On the right picture, the evolution of classical modularity (Q1) as a function oftduring the agglomerative process of Deltacom.
an Autonomous System,CAS(), is:
Cθ
AS=arg max C∈Cθ
J(C,AS), θ∈,
CAS()=arg max {CθAS:θ∈}
JCθAS,AS,
and the recall score as:
R(AS) =J
CAS(),AS. ()
In the case of Deltacom,= [tmin,tmax] andtplays the role ofθ. In this way, the Jac-card similarity allows us to capture the moment in which each AS is formed. With this adjustments, the results clearly improve. The recall scoreR(AS) (Eq. ) over all the ASes
is . (and . over the ASes of at least nodes). The new cumulative distribution is presented as the black curve in Figure , and we shall call itDeltacom Multiresolution, as we are exploring all the communities at all possible resolutions.
The observed improvements tell us that each Autonomous System has anatural reso-lution at which it can be best observed. There is an important correlation between this resolution and the size of the AS, as the left picture in Figure shows. The right picture in Figure shows the evolution of classical modularityQfor the Internet graph as a function of the resolutiont, i.e. as the algorithm evolves (from right to left). As one of the properties of our algorithm,Qthas its maximum attfor every possiblet, so that the classicalQis maximal att= .
We stress that several multiresolution methods exist in literature, but the advantage of ours is that it can generate a hierarchical partition covering all the possible resolution levels, in one single run. However, we compared our results with those of two other mul-tiresolution methods, i.e., Infomap mulmul-tiresolution and the Constant Potts Model:
• The Infomap algorithm has a multiresolution variant [], which generates a
andθ=k). Here we found a clear improvement too, which is shown in the orange curve of Figure , pointing out that it is important to find the correct resolution for each AS.
• From the general schema described by Reichardt and Bornholdt in [] several multiresolution approaches have been proposed. We used the Constant Potts Model by Traag et al. [], which removes the null model in the Hamiltonian to cancel global dependences. For this algorithm we tested different values ofγ ∈[–, ]. We
observed that this interval covers all the interesting situations, as forγ = –we
obtain a partition with communities, and forγ = all the nodes are in different communities. We sampled the interval by dividing it into , , and pieces, equidistant in the logarithmic scale. When dividing it intokpieces we obtaink+
values ofγ which we use as the parameter space={γ,γ, . . . ,γk}in order to match
each AS against its most similar community (according to the recall scoreR(AS))
among thek+ different partitions. We chose to stop the exploration atk= (
values ofγ) because the observed convergence suggested that refining the parameter space would not produce much better results. The curve fork= representing CPM is shown in purple in Figure . Finally, the central picture in Figure shows the bestγ value (from among the considered values) for each AS, as a function of its size. Compared to Deltacom, in CPM the correlation between resolution and size is not so strong.
From this analysis we conclude that there is no single resolution at which we can find most of the ASes. This had already been observed in [] for modularity, and is partly due to the fact that modularity is affected by resolution limit issues []. Similar theoretical analysis have been provided for Infomap’s map equation [] and for some methods based on Hamiltonians of Potts models []. Despite these difficulties, here we show that the ASes do exist as communities at different levels of the hierarchical structure.
3.3 Detecting ASes from samples
The previous results show us that different ASes have different resolutions, and that we cannot expect to get all the ASes with classical community detection methods or at some particular resolution value. However, our results with the multiresolution methods are ideal, in the sense that we used the information of the AS structure in order to know at which resolution to stop for each AS. Now we wonder whether we might retrieve the ASes using a minimal amount of information: their size, and a small sample of their nodes. We observed that there is a strong dependence between the AS size and the AS resolution at which the AS is best identified by our algorithm, so that we shall use the linear regres-sion in Figure to approximate the best resolution for each AS,t˜. If we look for the most similar community to each AS restricted to the partition produced by Deltacom at that approximate resolution,Ct˜, then we obtain the brown curve in dashed lines in Figure .
Lastly, we shall consider that we only know % of the nodes at random. Suppose that
ASsample⊂ASis the known subset for eachAS. We shall estimate the most similar
com-munity using theASsampleand the partition at resolutiont˜:
ˆ
CAS()=arg max C∈C˜t
J(C,ASsample),
R(AS) =Rˆ(AS) =J ˆ
i.e., we only consider the nodes of the AS which are part of our sample when choosing the most similar community. Instead, for computing the recall scoreR(AS) (Eq. ) we
consider all the nodes of the AS, so that the method can be compared against the others. The results forR(AS) are those of the light blue curve in dashed lines in Figure .
The closeness between the brown and light blue curves proves that we do not need to know the whole AS in order to identify it as a community at a certain step of the modularity optimization process: % of the nodes is enough in order to get as good a result as if we knew all the AS nodes. However, the distance between the brown and black curve tells us that the linear regression between size and resolution is just a rough approximation. We also point out that we tested sample sizes between % and % and the performance was similar (average recalls between . and .), mainly because ideally the probability of misclassifyingnrandom nodes of an AS decreases exponentially withn, so that even for a small sample of nodes the majority of them should be correctly classified if the AS exists as a community at that resolution (e.g., with a recall of at least .). In conclusion, the sample-based method seems to be very successful, and is only limited by the error of the linear regression. We can thus identify many of the ASes just knowing their size and a small sample of their nodes. This method can also be extended to other networks, even if the relation between resolution and size is not known exactly. In that case, one should match the most similar community at each resolution, and then choose the resolution for which the most similar community has the closest size to the AS size, for example.
4 Discussion
The results in Figure show a type of stochastical dominance among the methods. The lowest curves are the ones most left-skewed and thus represent better correspondence between the communities identified by maximizing the Jaccard similarity and the ASes. In particular, the area above each curve is an interesting measure of the goodness of the method, and it also represents the mean recall score over all the ASes. The list of areas is presented in Table , computed for the cumulative distributions of ASes with at least nodes.
The difficulties of classical modularity maximization due to the resolution limit and the degeneracy of its maxima are manifested in the poor average values obtained by Deltacom
Table 3 Average recall scores of the methods
Method avgR(AS)
ASes≥100 nodes All ASes
LPM 0.05 0.18
Deltacom (t= 1) 0.08 0.00
Louvain 0.13 0.01
CommUGP 0.16 0.37
Infomap 0.41 0.35
Deltacom Multiresolution + Regression line + 5% sample 0.57 0.75
Deltacom Multiresolution + Regression line 0.59 0.77
Infomap Multiresolution (Best Resolution) 0.61 0.49
Deltacom Multiresolution (Best Resolution) 0.67 0.87
CPM (Best Resolution from 33 values ofγ) 0.70 0.83
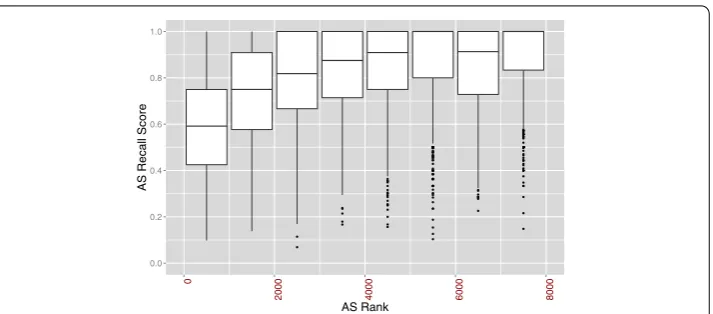
Figure 4 AS Recall score vs. AS Rank.Boxes in this figure represent Autonomous Systems grouped byAS rankaccording to CAIDA [10], while they-axis represents the recall score obtained with the Multiresolution Deltacom algorithm,R2(AS) (Eq. 8). Each box contains information on the median recall score and its interquartile range (IQR). The whiskers represent extreme values within 1.5·IQR, and the points are outliers. There is a clear trend towards higher recalls for low-ranked ASes.
att= (.) and by Louvain (.) for the recall score of ASes with at least nodes. But the multiresolution algorithms have a good performance when we explore all the possible resolution levels, showing that most of the Autonomous Systems do have a community structure (% of them have a recall over .). Instead, most of the ASes which were not detected by Deltacom Multiresolution belong to the core of the Internet: in Figure we plot the recall score of the ASes grouped according to theirAS rank. The AS rank is a ranking of ASes designed by CAIDA and based on the customer cone size (the set of ASes that an AS can reach using customer links []). We observe that low ranked ASes have very good recall scores typically (above .). Instead, most of the ASes found with a low recall have a high AS rank and belong to large carriers. Regarding the points with low AS Rank and low recall, many of them could be identified as IXPs and CDNs, which also belong to the Internet backbone but have a small customer cone.
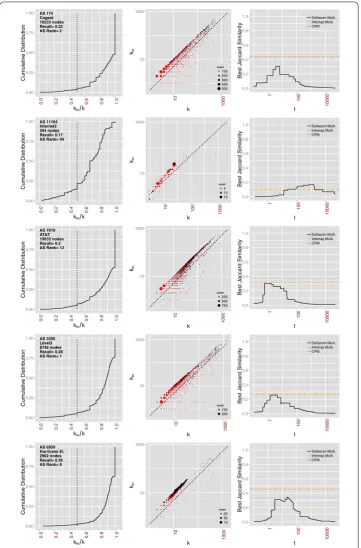
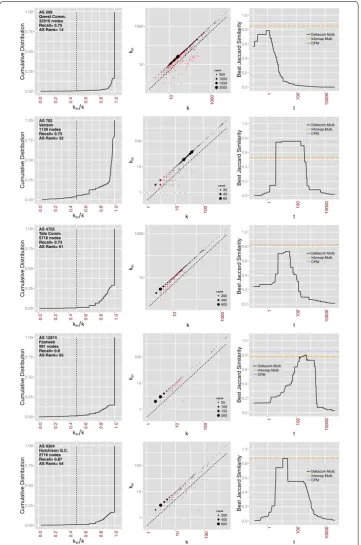
In Figures , and we analyse some particular cases of (a)well-detected, high-ranked ASes, (b)bad-detected, high-ranked ASesand (c)very well-detected, mean-ranked ASes. Each row represents an AS, and the three columns represent (i)the internal node degree distribution(normalized by the node degree), (ii)the internal node degree vs. node degree
and (iii)the evolution of the best Jaccard similarity at different resolutions of the Multires-olution Deltacom algorithm(its maximum corresponds to the AS recall score).
In the central pictures of Figure we plot the number of internal edges as a function of node degree for some ASes which were not well-detected. The diagonal dashed line corresponds tokin/k; the nodes under this line have more external connections than
Figure 6 High-ranked ASes with good recall score.Normalized internal degree distribution (left-column),
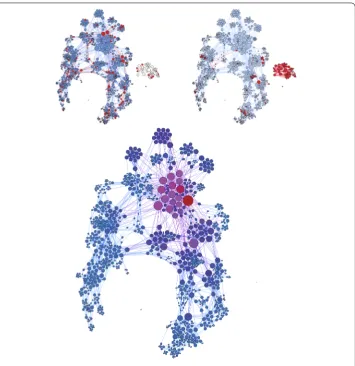
Figure 8 The AS 15169 (Google).In the upper left picture, Google’s AS 15169 with a sample of 15% of the nodes coloured in red. The gray nodes correspond toCˆAS(2), the community found by the Multiresolution Deltacom algorithm using that sample and the AS size. Lower, the detected community,CˆAS(2). In the upper right picture, all the AS with the frontier nodes coloured in red. The recall score for this AS isR3= 0.93. (Image generated with Gephi.)
These types of ASes lay in the backbone of the Internet and they are densely connected among them, so that their nodes may not respect the classical notions of community. It is possible that we should think in an overlapping community structure for the core of the Internet, following the ideas in [] regarding the core-periphery structure of networks and its relation with community structure. In this network, highly overlapping communi-ties might be related with the presence of IXPs or nodes which do not satisfy the strong community definition, for example.
Figure 9 The AS 17506 (Ucom Corporation, Japan).The structure of this Japanese AS with 4,739 nodes is organized into different clusters. Many of these clusters have a redundancy structure formed by 4 routers, which is a typical configuration in many ASes. Though the clusters can be clearly distinguished, they also constitute one large community which the Multiresolution Deltacom algorithm retrieves with a recall score of
R2= 0.78. Some nodes play a special role into this cohesion by acting as hubs. We can identify them by computing the eigenvector centrality, which is shown as the colour of the nodes in a light
blue/blue/violet/red scale: the red nodes have the highest centrality values, and they are the main hubs. The classical modularity optimization throws a recall of 0.19 instead, because the AS is already combined with others att= 1. On the other hand, Infomap obtains a recall of 0.13. (Image generated with Gephi.)
radius represents their degree in the full graph. The upper left picture shows the % sam-ple in red, and the upper right figure shows the nodes in the frontier of the AS, also in red. Those nodes from the AS which were not detected by our algorithm are shown in white in the upper left picture. We observe an interesting modular structure, with sev-eral small modules strongly connected among them, and with a tree-like structure. Some high-degree nodes act as hubs inside the AS; however, they are not connected to other ASes usually. The AS has also a small connected component, probably due to a bias in the exploration or to the limitations of the AS affiliation algorithm; this small component was not detected. However, the reconstruction of the main component was excellent; the only difference being some small degree nodes not belonging to the AS, but to carrier ASes like AT&T and Level. Almost all the nodes in the frontier of the main component have small degree and small centrality values. The role of hubs is also visualized in Figure for the UCom Corporation AS.
The limitations of our algorithm for correctly recovering some of the ASes might also be related to the detectability threshold of community detection [–] and to the com-munity detection paradox []: even when there are more average internal connections than external ones, algorithms might not succeed to retrieve a community if the differ-ence between these quantities is not above a certain threshold. This limitation not only affects modularity-based methods but is quite general.
Hric et al. [] have recently used the Jaccard similarity for identifying communities with ground-truth groups as we did. They also observed that community detection algorithms perform very poorly according to this measure and they proposed some conjectures, as the need to change the notion of community or to introduce some non-topological infor-mation. In [], for example, Darst et al. analyse how an a priori knowledge of the number of communities improves the performance by helping to set the resolution level. But, in many complex networks like the Internet there might not be one single resolution at which all the communities can be discovered. Here we have seen that knowing the community sizes and some of their nodes, multiresolution algorithms might increase their perfor-mance significantly.
The use of some additional information for the identification of communities may be a trade-off solution considering the complexity and limitations of the community detec-tion problem. Our last experiment, in which we use a sample of nodes for matching the community in the hierarchical structure, is related to the seed set expansion problem (i.e., extracting a community by expanding a local seed set of nodes), which has been recently explored in [–].
Thus, our work may shed some light into the problem of improving the performance of community detection algorithms: in the Internet router-level graph, we have shown that the coexistence of communities with multiple resolutions is the main difficulty for the detection algorithms. So, when proposing new conceptions of community structure, we should take into account that very heterogeneous communities must coexist. Regard-ing the detection of ground-truth communities in real networks, the followRegard-ing question remains open: Can the ground-truth communities be retrieved without additional infor-mation, e.g., as significant communities at the right resolution level?
5 Conclusions
We analysed the internal community structure of the Internet Autonomous Systems by us-ing Deltacom, a multiresolution algorithm. Deltacom performs hierarchical partitionus-ing through modularity optimization at different resolution levels in one single run, and with a low computational cost. The algorithm was made available to the scientific community as an open-source software through SourceForge.
We applied Deltacom to the router-level graph of the Internet obtained from CAIDA, and we observed that most of the ASes which are not in the Internet backbone can be identified as communities if the correct resolution level is used in the community discov-ery process. However, we showed that several optimization algorithms fail to detect these Autonomous Systems due to their largely variable sizes and structures. With our results, we show that the use of proper additional information can significantly improve the per-formance of community identification.
due to the presence of high degree nodes with more external connections than internal ones, violating one of the main notions of community structure. Instead, stub ASes and ISP’s have high-degree nodes which act as hubs and provide internal connectivity, while the external connectivity is usually provided by lower-degree nodes. These ASes were well detected as communities.
By correlating the resolution of each AS with its size and using a small fraction of the AS affiliation data, we showed that most of the ASes which do have a community structure can be retrieved. In this way we provide a method for identifying Autonomous Systems with scarce information: a short sample of their nodes and their size.
Finally, we discussed the limitations of the community detection methods for detect-ing ground-truth communities. These difficulties had been previously observed for many large networks and we also observed it here for the Internet Autonomous Systems. Based on our results, we consider that the use of some local information might arise as a trade-off solution for identifying communities in these cases.
We think that these results on the Internet structure at the router level can also be used for improving Internet topology models and the estimation of properties as node central-ity or clustering. The work shall also lead to new discussions regarding the hierarchical structure of the Internet and the detection of significant communities in large heteroge-neous networks.
Competing interests
The authors declare that they have no competing interests.
Authors’ contributions
MGB and JIAH designed the research; MGB and SPG developed the multiresolution Deltacom algorithm for modularity maximization; MGB wrote the manuscript; all the authors analysed the data and discussed the results.
Author details
1ISI Foundation, Turin, Italy.2Facultad de Ingeniería, Universidad de Buenos Aires, Buenos Aires, Argentina.3INTECIN (CONICET), Buenos Aires, Argentina. 4ITBA, Buenos Aires, Argentina.
Acknowledgements
The authors thank Jorge R. Busch for his discussions on the Deltacom algorithm, and the anonymous reviewers who contributed to the paper with their suggestions. MGB acknowledges support from the ‘Lagrange Project’ of the ISI Foundation funded by the Fondazione CRT and from the ‘S3 Project’ funded by the Compagnia di San Paolo. This work was also funded by an UBACyT 2012-2015 grant (20020110200181) and a PICT-Bicentenario 2010-01108. MGB acknowledges a CONICET fellowship.
Received: 4 June 2015 Accepted: 17 July 2015
References
1. Caldarelli G, Vespignani A (2007) Large scale structure and dynamics of complex networks: from information technology to finance and natural science. World Scientific, River Edge
2. Ravasz E, Barabási A-L (2003) Hierarchical organization in complex networks. Phys Rev E 67(2):026112 3. Pastor-Satorras R, Vespignani A (2007) Evolution and structure of the Internet: a statistical physics approach.
Cambridge University Press, Cambridge
4. Gregori E, Lenzini L, Orsini C (2013)k-Dense communities in the Internet AS-level topology graph. Comput Netw 57(1):213-227
5. Gregori E, Lenzini L, Orsini C (2011)k-Clique communities in the Internet AS-level topology graph. In: 31st international conference on distributed computing systems workshops (ICDCSW 2011), pp 134-139 6. Ge X, Wang H (2012) Community overlays upon real-world complex networks. Eur Phys J B 85(1):1-10 7. Rossi RA, Fahmy S, Talukder N (2013) A multi-level approach for evaluating Internet topology generators. In: IFIP
networking conference, pp 1-9
8. Hirayama T, Arakawa S, Arai K, Murata M (2012) Modularity structure and traffic dynamics of ISP router-level topologies. In: The 2012 international symposium on nonlinear theory and its applications (NOLTA 2012), Palma, Mallorca, pp 856-859
9. Fortunato S (2010) Community detection in graphs. Phys Rep 486(3-5):75-174 10. CAIDA: the Cooperative Association for Internet Data Analysis. http://www.caida.org/
12. Dall’Asta L, Alvarez-Hamelin JI, Barrat A, Vázquez A, Vespignani A (2006) Exploring networks with traceroute-like probes: theory and simulations. Theor Comput Sci 355(1):6-24
13. Pastor-Satorras R, Vázquez A, Vespignani A (2004) Topology, hierarchy, and correlations in Internet graphs. In: Complex networks. Lecture notes in physics, vol 650. Springer, Berlin, pp 425-440
14. Chang H, Jamin S, Willinger W (2001) Inferring AS-level Internet topology from router-level path traces. In: Proceedings of SPIE ITCom
15. Tangmunarunkit H, Govindan R, Shenker S, Estrin D (2001) The impact of routing policy on Internet paths. In: Proceedings of the 20th IEEE international conference on computer communications (INFOCOM), pp 736-742 16. The CAIDA UCSD IPv4 routed /24 topology dataset - 2011-10.
http://www.caida.org/data/active/ipv4_routed_24_topology_dataset.xml
17. Huffaker B, Dhamdhere A, Fomenkov M, Claffy K (2010) Toward topology dualism: improving the accuracy of AS annotations for routers. In: 9th passive and active measurement conference (PAM 2010), Zurich, Switzerland 18. The CAIDA macroscopic Internet Topology Data Kit (ITDK) - 2011-10.
http://www.caida.org/data/internet-topology-data-kit/release-2011-10.xml
19. Batagelj V, Zaveršnik M (2011) Fast algorithms for determining (generalized) core groups in social networks. Adv Data Anal Classif 5(2):129-145. doi:10.1007/s11634-010-0079-y
20. Donnet B, Luckie M, Mérindol P, Pansiot J-J (2012) Revealing MPLS tunnels obscured from traceroute. Comput Commun Rev 42(2):87-93
21. Rosvall M, Bergstrom CT (2007) An information-theoretic framework for resolving community structure in complex networks. Proc Natl Acad Sci USA 104(18):7327-7331
22. Raghavan UN, Albert R, Kumara S (2007) Near linear time algorithm to detect community structures in large-scale networks. Phys Rev E 76(3):036106
23. Blondel VD, Guillaume J-L, Lambiotte R, Lefebvre E (2008) Fast unfolding of communities in large networks. J Stat Mech Theory Exp 2008(10):P10008
24. Beiró MG, Busch JR, Grynberg SP, Alvarez-Hamelin JI (2013) Obtaining communities with a fitness growth process. Physica A 392(9):2278-2293
25. Newman MEJ, Girvan M (2004) Finding and evaluating community structure in networks. Phys Rev E 69(2):026113 26. Clauset A, Newman MEJ, Moore C (2004) Finding community structure in very large networks. Phys Rev E
70(6):066111
27. Guimerà R, Amaral LAN (2005) Cartography of complex networks: modules and universal roles. J Stat Mech Theory Exp 2:02001
28. Duch J, Arenas A (2005) Community detection in complex networks using extremal optimization. Phys Rev E 72(2):027104
29. Noack A, Rotta R (2009) Multi-level algorithms for modularity clustering. In: Proceedings of the 8th international symposium on experimental algorithms (SEA 2009). Springer, Berlin, pp 257-268
30. Fortunato S, Barthélemy M (2007) Resolution limit in community detection. Proc Natl Acad Sci USA 104(1):36-41 31. Reichardt J, Bornholdt S (2006) Statistical mechanics of community detection. Phys Rev E 74(1):016110 32. Lancichinetti A, Fortunato S (2011) Limits of modularity maximization in community detection. Phys Rev E
84(6):066122. http://pre.aps.org/abstract/PRE/v84/i6/e066122
33. Busch JR, Beiró MG, Alvarez-Hamelin JI (2010) On weakly optimal partitions in modular networks. arXiv:1008.3443 34. DeltaCom (2015) http://sourceforge.net/projects/deltacom/
35. Hric D, Darst RK, Fortunato S (2014) Community detection in networks: structural communities versus ground truth. Phys Rev E 90:062805
36. Rosvall M, Bergstrom CT (2011) Multilevel compression of random walks on networks reveals hierarchical organization in large integrated systems. PLoS ONE 6(4):e18209
37. Traag VA, Van Dooren P, Nesterov Y (2011) Narrow scope for resolution-limit-free community detection. Phys Rev E 84(1):016114
38. Kumpula JM, Saramaki J, Kaski K, Kertész J (2007) Limited resolution in complex network community detection with Potts model approach. Eur Phys J B 56(1):41-45
39. Kawamoto T, Rosvall M (2015) Estimating the resolution limit of the map equation in community detection. Phys Rev E 91(1):012809
40. Xiang J, Hu K (2012) Limitation of multi-resolution methods in community detection. Physica A 391(20):4995-5003 41. Luckie M, Huffaker B, Dhamdhere A, Giotsas V, Claffy K (2013) AS relationships, customer cones, and validation. In:
Proceedings of the 2013 Internet measurement conference (IMC’13). ACM, New York, pp 243-256
42. Yang J, Leskovec J (2014) Overlapping communities explain core-periphery organization of networks. Proc IEEE 102(12):1892-1902
43. Radicchi F, Castellano C, Cecconi F, Loreto V, Parisi D (2004) Defining and identifying communities in networks. Proc Natl Acad Sci USA 101(9):2658
44. Hu Y, Chen H, Zhang P, Li M, Di Z, Fan Y (2008) Comparative definition of community and corresponding identifying algorithm. Phys Rev E 78(2):026121
45. Decelle A, Krzakala F, Moore C, Zdeborová L (2011) Inference and phase transitions in the detection of modules in sparse networks. Phys Rev Lett 107:065701
46. Nadakuditi RR, Newman MEJ (2012) Graph spectra and the detectability of community structure in networks. Phys Rev Lett 108:188701
47. Radicchi F (2013) Detectability of communities in heterogeneous networks. Phys Rev E 88:010801 48. Radicchi F (2014) A paradox in community detection. Europhys Lett 106(3):38001
49. Darst RK, Nussinov Z, Fortunato S (2014) Improving the performance of algorithms to find communities in networks. Phys Rev E 89:032809
50. Whang JJ, Gleich DF, Dhillon IS (2013) Overlapping community detection using seed set expansion. In: Proceedings of the 22nd ACM international conference on information & knowledge management. ACM, New York,
51. Kloumann IM, Kleinberg JM (2014) Community membership identification from small seed sets. In: Proceedings of the 20th ACM SIGKDD international conference on knowledge discovery and data mining. ACM, New York, pp 1366-1375