R E S E A R C H
Open Access
Health-related quality of life for pre-diabetic states
and type 2 diabetes mellitus: a cross-sectional
study in Västerbotten Sweden
Anne Neumann
1,2*, Olaf Schoffer
2, Fredrik Norström
1, Margareta Norberg
1, Stefanie J Klug
2and Lars Lindholm
1Abstract
Background:Type 2 diabetes (T2D) decreases health-related quality of life, but there is a lack of information about the health status of people in pre-diabetic states. However, information on health utility weights (HUWs) for pre-diabetic states and T2D are essential to estimate the effect of prevention initiatives. We estimated and compared HUWs for healthy individuals, those with pre-diabetes and those with T2D in a Swedish population and evaluated the influence of age, sex, education and body mass index on HUWs.
Methods:Participants of the Västerbotten Intervention Program, Sweden, between 2002 and 2012, who underwent an oral glucose tolerance test or indicated they had T2D and who filled in the Short Form-36 questionnaire (SF-36) were included. Individuals were categorized as healthy, being in any of three different pre-diabetic states, or as T2D. The pre-diabetic states are impaired fasting glucose (IFG), impaired glucose tolerance (IGT) or a combination of both (IFG&IGT). The SF-6D index was used to convert SF-36 responses to HUWs. HUWs were stratified by age, sex, education and body mass index. Beta regression analyses were conducted to estimate the effect of multiple risk factors on the HUWs.
Results:In total, 55 882 individuals were included in the analysis. The overall mean HUW was 0.764. The mean HUW of healthy individuals was 0.768, 0.759 for those with IFG, 0.746 for those with IGT, 0.745 for those with IFG&IGT, and 0.738 for those with T2D. In the overall model, all variables except underweight vs. normal weight were significantly associated with HUW. Younger age, male sex, and higher education were associated with increased HUW. Normal weight, or being overweight was associated with elevated HUW, while obesity was associated with lower HUW.
Conclusions:Healthy individuals had higher HUWs than participants with T2D, while individuals with IFG, IGT or IFG&IGT had HUWs that ranged between those for NGT and T2D. Therefore, preventing the development of pre-diabetic states would improve health-related quality of life in addition to lowering the risk of developing T2D.
Keywords:Health utility, Normal glucose tolerance, Impaired fasting glucose, Impaired glucose tolerance, Type 2 diabetes mellitus, Sweden, SF-36, SF-6D, Health-related quality of life, Beta regression
Background
Type 2 diabetes mellitus (T2D) is a severe disease with an estimated number of cases exceeding 370 million glo-bally and 390 000 in Sweden in 2012 [1]. These numbers are expected to increase to over 550 million and 432 000 by 2030, respectively [1]. Several studies have shown that prevention of T2D is possible by changing behavior, such
as through physical activity and diet [2-4]. However, prevention does not start with the onset of the disease, but needs to address the early stages of T2D. Therefore, the best scenario involves preventing the development of pre-diabetic states among healthy individuals.
T2D and pre-diabetic states can be detected using a stan-dardized oral glucose tolerance test and medical classifica-tions, such as those of the World Health Organization [5]. According to this classification of blood glucose levels, a person can be categorized as normal glucose tolerant (NGT), i.e. healthy, being in a pre-diabetic state, or as * Correspondence:anne.neumann@uniklinikum-dresden.de
1Epidemiology and Global Health, Department of Public Health and Clinical Medicine, Umeå University, SE-901 87, Umeå, Sweden
2Cancer Epidemiology, University Cancer Center, University Hospital, Technische Universität Dresden, Fetscherstr. 74, 01307 Dresden, Germany
having T2D. The pre-diabetic states are impaired fasting glucose (IFG), impaired glucose tolerance (IGT), and a combination of both (IFG&IGT). Subjects in any of these three pre-diabetic states have moderate to severe insulin resistance, impaired insulin secretion and/or insulin sensi-tivity, and each state has distinct pathophysiologic etiolo-gies and risks of developing into T2D [6,7].
Disease, such as T2D, is assumed to reduce the health-related quality of life (HRQoL) of those affected. The estimation of HRQoL to assess either health status or the benefit of an intervention is a cornerstone in health economic evaluation. Quality-adjusted life years (QALYs) quantify HRQoL and combine the length of life and the preference weight for a particular health state into a single measure [8]. The intensity in the preference weight is measured as a “health utility weight” (HUW). A HUW of 1.0 indicates “perfect health” while a HUW of 0.0 represents being dead.
Models have been developed to estimate the cost-effectiveness of diabetes prevention initiatives which focus on lifestyle change by calculating the cost per QALY gained [9]. However, the validity of such models can be challenged, as not all necessary data are avail-able. One important gap is information about HUWs from the same population to allow comparability be-tween all health states in such models [9]. No prior research has extracted HUW from NGT, IFG and/or IGT and T2D from the same source population in a Swedish population. A recent study in Finland is, ac-cording to our knowledge, the only investigation that examined HUWs for NGT, IFG, IGT and T2D [10].
In this study, we aim to estimate and compare HUWs for individuals with NGT, IFG, IGT and T2D in a Swedish population, and to evaluate the influence on HUWs of age, sex, education and body mass index (BMI), factors known to independently influence HRQoL.
Methods Study population
Participants of the Västerbotten Intervention Program (VIP) who underwent an oral glucose tolerance test or indicated that they had T2D and who filled in the Short Form-36 questionnaire (SF-36) were included in this cross-sectional study. As the SF-36 questionnaire was not included in the VIP before 2003, inclusion in the study was limited to individuals with examination dates between January 2003 and February 2012. The VIP was initiated in 1985 with the aim of reducing morbidity and mortality from cardiovascular disease and diabetes [11]. All people at ages 40, 50 and 60 living in the Swedish county of Västerbotten are eligible for inclusion in the VIP, and are invited to screening and health counseling conducted by their primary care provider [11]. Thirty-year olds were also invited until 1996. Part of this screening is
an oral glucose tolerance test with a 75 g oral glucose load conducted according to standards of the World Health Organization [5]. Based on this test, VIP partic-ipants were categorized into one of the following glu-cose groups NGT, IFG, IGT, IFG&IGT, or T2D according to the 1999 WHO classification [5]. Further, height, weight, blood pressure and plasma lipids are measured, and each VIP participant is asked to complete a set of questionnaires, including questions about physical ac-tivity, tobacco use and dietary habits. It has been shown that the participants of VIP are representative of the county of Västerbotten [12]. The VIP is described in more detail elsewhere [11].
Health utility weights
The SF-36 is a standardized generic questionnaire com-prising 36 questions designed to assess self-perceived health status. It is a psychometric measure that produces a profile of eight dimensions [13]. The scoring of the SF-36 is not preference-based and assumes that the items are of equal importance [14]. The SF-36 has been reported as valid and reliable in healthy populations and diabetes patients [15-18]. However, for the estimation of HUW, preference-based estimates are necessary. There-fore, the SF-36 must be converted to preference-based items for the development of the HUW. The Short Form-6D (SF-6D) questionnaire was developed to obtain HUWs from the SF-36 questionnaire for use in health economic evaluations and links between psychometric and preference/utility-based measures [19]. A subset of 11 questions from the SF-36 is included in the SF-6D and weighted according to Brazier and Roberts (2004) [14]. The eight dimensions of the SF-36 were reduced to six SF-6D dimensions: physical functioning, role limita-tions, social function, bodily pain, mental health, and vitality [19]. No limitation in any of the dimensions means no subtraction from the baseline value of 1.0, i.e. perfect health. The higher the limitation in each domain, the higher the subtraction from the baseline [14]. The summation of the six dimensions constitutes the HUW. The SF-36 and its conversion to SF-6D for HUWs are widely used in health economic and epi-demiological studies [19]. The SF-6D valuation was shown to be representative for the population of the United Kingdom [20].
Risk factors
The HUWs were stratified by four potential risk factors (age, sex, education and BMI), which are known to inde-pendently influence HUWs and which are easy to meas-ure. Box plots were used to illustrate stratified HUWs. Outliers were not displayed, as they would distort the boxplots. Education was classified as basic (only compul-sory school or <10 years of formal education), middle (10–12 years of formal education) or high (university or≥13 years of formal education). BMI was classified as underweight (<18.5), normal weight (18.5-24.9), over-weight (25.0-29.9) or obese (≥30.0).
Statistical analyses
Chi-square tests were conducted to test the significance of the count data of the description of the study population (Table 1). The differences of the mean HUWs between the glucose groups were tested using the Kruskal-Wallis test. To identify for which glucose groups there were differences, the post-hoc Mann–Whitney tests with the Bonferroni-Holm procedure to adjust for multiple comparisons was used [21].
Beta regression as introduced by Ferrari and Cribari-Neto [22] was used to estimate the effect of multiple risk factors on the HUW, as the distribution of the HUWs fitted well with a beta distribution [23]. Beta regression
can be expressed as gð Þ ¼μt Xk
i¼1
xtiβi which follows the
beta distribution with mean (E(y) =μ) and variance
var yð Þ ¼μð1−μÞ
1þϕ
where g(.) is the logit link function, xti represents the t-th observation andβi the unknown re-gression parameter of the i-th covariate [22]. Beta re-gression has been applied to analyze HRQoL [24-27]. It presents the most flexible way to simultaneously esti-mate the structure of dependence and the distribution parameters, as the dependent variable is beta distributed. As covariates were present, the alternative parameterization with location parameter and scale parameter was used [27]. This is important for the interpretation of the regression parameters and thus the model equation. The mean HUW is represented by μ (alternative parameterization). In the conventional parameterization, the shape parameters need to be transformed for an equivalent statement.
Table 1 Study population, total, by age, sex, education and body mass index1
Healthy Pre-Diabetes Diabetes
Characteristics NGT IFG IGT IFG & IGT T2D Total
n % n % n % n % n % n %
Total number 43 586 100.0 5 629 100.0 2 440 100.0 1 232 100.0 2 995 100.0 55 882 100.0
Age in years
40 15 652 35.9 1 339 23.8 418 17.1 168 13.6 350 11.7 17 927 32.1
50 14 707 33.7 1 846 32.8 706 28.9 358 29.1 798 26.6 18 415 33.0
60 13 227 30.4 2 444 43.4 1 316 53.9 706 57.3 1 847 61.7 19 540 35.0
Sex
Male 21 076 48.4 2 973 52.8 1 050 43.0 638 51.8 1 844 61.6 27 581 49.4
Female 22 510 51.7 2 656 47.2 1 390 57.0 594 48.2 1 151 38.4 28 301 50.6
Education
Basic2 5 655 13.0 1 052 18.7 508 20.8 279 22.7 753 25.1 8 247 14.8
Middle3 22 606 51.9 2 938 52.2 1 275 52.3 654 53.1 1 568 52.4 29 041 52.0
High4 15 053 34.5 1 596 28.4 634 26.0 286 23.2 639 21.3 18 208 32.6
Missing 272 0.6 43 0.8 23 0.9 13 1.1 35 1.2 386 0.7
Body mass index, BMI5
Underweight, <18.5 524 1.2 45 0.8 31 1.3 1 0.1 14 0.5 615 1.1
Normal, 18.5 - 24.9 18 917 43.4 1 735 30.8 688 28.2 221 17.9 462 15.4 22 023 39.4
Overweight, 25.0–29.9 17 669 40.5 2 420 43.0 1 070 43.9 521 42.3 1 173 39.2 22 853 40.9
Obesity,≥30.0 6 293 14.4 1 403 24.9 637 26.1 486 39.5 1 320 44.1 10 139 18.1
Missing 183 0.5 26 0.5 14 0.6 3 0.2 26 0.9 252 0.5
1
Chi-square test was used to test for dependencies between glucose tolerance groups and age, sex, education level and body mass index respectively. All comparisons were significant (p < 0.001).
2
“compulsory school”or“less than 10 years of education in school”. 3
“10-12 years of education in school”. 4“
university”or“education of more than 12 years in school”. 5
The significance of the beta regression models was tested with the Wald test. The McFadden’s pseudo-R2 was estimated as goodness-of-fit-criterion using the fol-lowing formula: McFadden’s pseudo-R2= 1–ln Lnull/ ln Lfit, where Lnull is the log-likelihood of the null model, and Lfitis the log-likelihood of the fitted model [27].
The variable age was used as a continuous variable, even though only three ages, i.e. 40, 50, 60, were pos-sible. As the variables education and BMI were ordinal and not interval scaled, dummy variables were created to evaluate the differences between basic vs. middle and basic vs. high education as well as normal weight vs. underweight, normal weight vs. overweight and normal weight vs. obese. Basic education and normal weight were used as reference categories.
Conversion from SF-36 to SF-6D was conducted with SAS 9.22. For all other statistical analyses STATA/SE 11.0 was used. The significance level for all statistical tests was 0.05.
Ethical approval for this study was received from the Regional Ethics Board Dnr 08-131 M at Umeå Univer-sity, Sweden. All subjects gave informed consent to future research before their VIP-examination.
Results
Study population
The total number of individuals in our analysis was 55 882 (Table 1). The age distribution of study participants was relatively equally distributed among 40, 50 and 60 year olds (32.1, 33.0 and 35.0%, respectively), with a mean age of 49, 52, 54, 54 and 55 years among individuals with NGT, IFG, IGT, IFG&IGT and T2D, respectively. Approximately half
(49.4%) of the study population was male. Most study par-ticipants had middle education (52.0%), followed by high (32.6%) and basic (14.8%). The majority of the participants was either overweight (40.9%) or had normal weight (39.4%) while 18.1% were obese and 1.1% was under-weight (Table 1). In total, the majority was categorized as NGT (n = 43 586, 78.0%), while 5 629 individuals had IFG (10.1%), 2 440 IGT (4.4%), 1 232 IFG&IGT (2.2%) and 2 995 T2D (5.4%).
People in the older age group tended to have more severe glucose group (NGT: 30.4% vs. T2D: 61.7% among 60-year olds compared to NGT: 35.9% vs. T2D: 11.7% among 40-year olds). Further, participants with T2D had higher BMI (83.3% obese or overweight) comparing par-ticipants with NGT (54.9% obese or overweight) (Table 1). All comparisons for dependencies between glucose toler-ance groups and age, sex, education level and body mass index respectively were significant (p < 0.001).
Health utility weights
The total number of individuals with estimated HUW was 52 606. There were 3 276 individuals (5.9%) in the data set which could not contribute to the HUW calcu-lations (Table 2) due to missing values in the answers of the SF-36. The overall mean HUW was 0.764. The mean HUW of healthy individuals was 0.768, 0.759 for those with IFG, 0.746 for those with IGT, 0.745 for those with IFG&IGT, and 0.738 for those with T2D. The HUWs de-pend on the glucose groups (p <0.001). Multiple pairwise comparisons indicated differences for all glucose groups besides comparing IGT with T2D, IFG&IGT with T2D and IGT with IFG&IGT.
Table 2 SF-6D domains and health utility weights
SF-6D domains
Mean (SD)1 NGT IFG IGT IFG&IGT T2D Total
n 41 208 5 275 2 261 1 122 2 740 5 2606
Physical functioning 1.840 (1.12) 2.013 (1.23) 2.245 (1.32) 2.276 (1.34) 2.393 (1.40) 1.914 (1.18)
Role limitations 1.535 (1.26) 1.621 (1.41) 1.747 (1.54) 1.825 (1.69) 1.830 (1.58) 1.574 (1.32)
Social function 2.446 (1.03) 2.491 (1.07) 2.602 (1.23) 2.568 (1.16) 2.606 (1.24) 2.468 (1.06)
Bodily pain 2.416 (1.44) 2.503 (1.46) 2.668 (1.50) 2.726 (1.52) 2.758 (1.59) 2.460 (1.46)
Mental health 1.753 (1.08) 1.767 (1.09) 1.807 (1.14) 1.836 (1.22) 1.870 (1.27) 1.770 (1.10)
Vitality 2.666 (1.19) 2.713 (1.25) 2.789 (1.28) 2.800 (1.34) 2.860 (1.40) 2.689 (1.22)
Health utility weight2
Mean (SD)1 0.768 (0.10) 0.759 (0.11) 0.746 (0.11) 0.745 (0.11) 0.738 (0.12) 0.764 (0.10)
Median 0.793 0.788 0.772 0.772 0.765 0.789
1st-3rdquartile 0.713-0.830 0.681-0.830 0.669-0.830 0.667-0.830 0.639-0.830 0.700-0.830
Min-Max3 0.301-0.943 0.334-0.943 0.301-0.943 0.383-0.943 0.381-0.943 0.301-0.943
1
SD = standard deviation. 2
Kruskal-Wallis equality-of-populations rank test, p < 0.001. 3
Univariate analysis
In all age groups, we observed the highest median HUW among individuals with NGT, followed by HUWs among pre-diabetic individuals, and lowest HUWs among indi-viduals with T2D (Figure 1). Older age was associated with lower HUW. Women had lower median HUW than men (Figure 2). We observed a decreasing HUW with decreasing glucose group, with highest HUW among indi-viduals with NGT, followed by HUW among indiindi-viduals with pre-diabetic states, and lowest among individuals with T2D. Higher level of education was associated with higher HUW (Figure 3). BMI was associated with HUW, such that the higher the BMI, the lower the HUW (Figure 4). Underweight individuals had almost equivalent HUW as obese individuals. Underweight individuals with T2D re-ported lower HUW than obese individuals with T2D.
Multivariate analysis
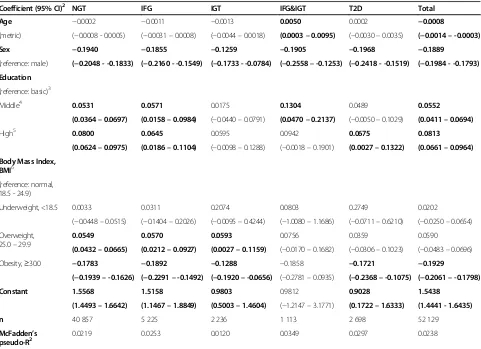
52 129 individuals were included in the multivariate re-gression analyses. Among them, 40 857 had NGT, 5 225 had IFG, 2 236 had IGT, 1 113 had IFG&IGT and 2 698 had T2D. The results of the beta regression showed that all significant factors displayed the same direction, either positive or negative, regardless of glucose group, except for age in the IFG&IGT model (Table 3). However, the McFadden’s pseudo-R2 was low for all models, ranging from 0.0120 to 0.0349 (Table 3).
Using the results of the multivariate regression (Table 3), the mean HUWs (Table 2) can be adjusted for specific sex, age, education and BMI values. For example, the
HUW for a women with NGT, aged 40 years with“middle education” and classified as obese would be estimated as the following: 1.5568 (constant) 0.0002 * 40 (age 40) -0.1940 (female sex) +0.0531 (middle education) - 0.1783 (obese) =1.2296. Using the inverse logit function on the predicted value 1.2296, one gets exp(1.2296)/(1+ exp (1.2296)) =0.7737. This result is very close to the observed mean value for individuals with NGT (0.768).
In the overall model, all but underweight vs. normal weight were significant factors. Being overweight in com-parison to normal weight was associated with increased, whereas being obese was associated with decreased, HUWs. Younger age, male sex, and higher education were associated with higher HUW.
The models including those with NGT or IFG only showed the same pattern as the overall model, except age, which was not significant in both models. For individuals with IGT, age and education were not significant. The model for individuals with IFG&IGT only estimated that an increasing age lead to increasing HUWs. High vs. basic edu-cation and overweight vs. normal weight were not signifi-cantly associated with HUW. Among individuals with T2D, age, middle vs. basic education, and overweight vs. normal weight were not significantly associated with HUW. All other factors were comparable to the overall model.
Discussion Principal findings
We found that participants with NGT had higher HUWs than those with T2D, while those with IFG, IGT or a
combination of both had HUWs that ranged between those for NGT and T2D. All risk factors investigated were associated with HUW, except underweight vs. nor-mal weight. Younger age, nor-male sex, and higher education were associated with increased HUW. Normal weight, or being overweight was associated with elevated HUW,
while obesity was associated with lower HUW. However, the McFadden’s pseudo-R2indicated that the model does not explain much variance. It is recognized by Smithson and Verkuilen that the McFadden’s pseudo-R2 is often disappointingly small and may not attain the theoretical maximum value of one [27]. The McFadden’s pseudo-R2 Figure 2Health utility weights by sex and glucose groups.
is not to be interpreted as conventional R2 in multiple linear regressions and different definitions of pseudo R2 can arrive at very different values.
Limitations and strengths
Even though the SF-36–SF-6D converter has only been validated for the UK population, it was used here to draw conclusions about the Swedish population. SF-36 and SF-6D have been widely adopted in Sweden. Still, the responses to the instruments have not yet been translated to HUWs for the Swedish population [28]. Any such bias arising from this would apply to all states and would not influence comparability between states. Therefore, we judged this converter as appropriate for describing HUW in this Swedish population. In addition, our dataset only includes individuals with 40, 50 or 60 years of age. We have, however, used age as continu-ous instead of categorical variable as we aimed to esti-mate the effect for all ages in order to make the results applicable to other settings as well. The extrapolation of age far from 40 to 60 years is not recommended, as the variation of estimates will increase according to the distance from the considered age range 40–60 years. In addition, our dataset could not distinguish between T2D cases that were categorized by the oral glucose tolerance test of VIP compared to those who indicated that they had T2D at the time of VIP participation.
The VIP is a population-based longitudinal program from which valid information can be drawn about the whole population of the county of Västerbotten. Every
eligible man and woman was invited to the program, thereby minimizing potential selection bias. While no additional attempt was made to encourage populations that are hard to reach, no major differences were found between participants and non-participants in the VIP [12]. One important strength of this study was the large number of participants included in the analyses.
Other studies
HUWs measured with SF-6D
The mean overall HUW was 0.764, which is comparable with results from other studies: the mean baseline SF-6D HUW of participants in the Diabetes Prevention Program in the United States was 0.800 [29], while the HUW calculated for a general Greek population was 0.759 [30]. A study among middle-aged and older Finns revealed very similar mean health utility values among individuals with NGT (0.777), IFG (0.771), IGT (0.759) and newly diagnosed T2D (0.742) [10]. Our estimated HUW for T2D was 0.738 ranging well in the results of other studies [10,31,32].
Risk factors
associated with lower HUW, a finding that has been reported elsewhere [30,33]. Our results confirm those of previous studies which reported that obesity is associated with lower HUW [30,33,36]. However, our results contra-dict with studies indicating that being underweight [36,37] or overweight decreased HUW [19] compared to normal weight. In our study, individuals with underweight and overweight had higher HUW compared to individuals with normal weight.
Implications for policy makers
We used standardized cost-effectiveness measures for modeling T2D disease interventions, which allow com-parison with other published findings and HRQoL of other diseases [38]. Our results allow conclusions to be made about the value of preference for a certain state versus another state enabling cost-effectiveness and cost-utility estimations using cost per QALY gained. Our
findings show that early prevention of T2D, i.e.
prevent-ing IFG and IGT, could improve the population’s
HRQoL, as the HRQoL has already diminished once a person has developed IFG or IGT. The early initiation of healthy lifestyle interventions is encouraged. Our results could motivate individuals with pre-diabetes to partici-pate in prevention initiatives, mainly lifestyle modifica-tion. Further, policy makers and health care providers could consider to screen for pre-diabetes and to support programs to prevent T2D among those with pre-diabetes.
We encourage further evaluations of HUW instru-ments for the Swedish population. While we decided to only consider a small number of predictors for HUWs, estimations of the influence of other risk factors on HUWs are needed.
This analysis is part of health economics research to investigate the cost-effectiveness of diabetes prevention Table 3 Regression coefficients for health utility weight by age, sex, education, BMI and glucose group, beta regression1
Coefficient (95% CI)2 NGT IFG IGT IFG&IGT T2D Total
Age −0.0002 −0.0011 −0.0013 0.0050 0.0002 −0.0008
(metric) (−0.0008 - 0.0005) (−0.0031–0.0008) (−0.0044–0.0018) (0.0003–0.0095) (−0.0030–0.0035) (−0.0014–-0.0003)
Sex −0.1940 −0.1855 −0.1259 −0.1905 −0.1968 −0.1889
(reference: male) (−0.2048 - -0.1833) (−0.2160 - -0.1549) (−0.1733 - -0.0784) (−0.2558–-0.1253) (−0.2418 - -0.1519) (−0.1984 - -0.1793)
Education
(reference: basic)3
Middle4 0.0531 0.0571 0.0175 0.1304 0.0489 0.0552
(0.0364–0.0697) (0.0158–0.0984) (−0.0440–0.0791) (0.0470–0.2137) (−0.0050–0.1029) (0.0411–0.0694)
High5 0.0800 0.0645 0.0595 0.0942 0.0675 0.0813
(0.0624–0.0975) (0.0186–0.1104) (−0.0098–0.1288) (−0.0018–0.1901) (0.0027–0.1322) (0.0661–0.0964)
Body Mass Index, BMI6
(reference: normal, 18.5 - 24.9)
Underweight, <18.5 0.0033 0.0311 0.2074 0.0803 0.2749 0.0202
(−0.0448–0.0515) (−0.1404–0.2026) (−0.0095–0.4244) (−1.0080–1.1686) (−0.0711–0.6210) (−0.0250–0.0654)
Overweight, 25.0–29.9
0.0549 0.0570 0.0593 0.0756 0.0359 0.0590
(0.0432–0.0665) (0.0212–0.0927) (0.0027–0.1159) (−0.0170–0.1682) (−0.0306–0.1023) (−0.0483–0.0696)
Obesity,≥30.0 −0.1783 −0.1892 −0.1288 −0.1858 −0.1721 −0.1929
(−0.1939–-0.1626) (−0.2291–-0.1492) (−0.1920–-0.0656) (−0.2781–0.0935) (−0.2368–-0.1075) (−0.2061–-0.1798)
Constant 1.5568 1.5158 0.9803 0.9812 0.9028 1.5438
(1.4493–1.6642) (1.1467–1.8849) (0.5003–1.4604) (−1.2147–3.1771) (0.1722–1.6333) (1.4441 - 1.6435)
n 40 857 5 225 2 236 1 113 2 698 52 129
McFadden’s
pseudo-R2 0.0219 0.0253 0.0120 0.0349 0.0297 0.0238
Significant coefficients are in bold print with significance at a 5% level. 1
Wald chi2: all five models are significant, p <0.001. 2
CI = confidence interval. 3
“compulsory school”or“less than 10 years of education in school”. 4“
10-12 years of education in school”. 5“
university”or“education of more than 12 years in school”. 6
initiatives. Previous analyses revealed that data was miss-ing for this broad aim [9], with information on HUWs lacking for people with T2D, pre-diabetes and NGT from one source population. Our research adds important in-formation for a T2D prevention cost-effectiveness model using cost per QALY gained as measurement.
Conclusions
This is the first study that estimated the HUW for NGT, IFG, IGT, IFG&IGT and T2D within the Swedish popu-lation. We found that, depending upon defined risk fac-tors, the worse the glucose group, the lower the HUWs. We found that pre-diabetic states decrease the HRQoL compared to healthy individuals. This shows that, add-itionally to lowering the risk of developing T2D, prevent-ing pre-diabetes would also improve the HRQoL. HUWs can be compared across states that define the natural history of T2D and allow the establishment of a T2D prevention model.
Abbreviations
BMI:Body mass index; HRQoL: Health-related quality of life; HUW: Health utility weight; IFG: Impaired fasting glucose; IGT: Impaired glucose tolerance; NGT: Normal glucose tolerance; QALY: Quality adjusted life year; T2D: Type 2 diabetes mellitus; VIP: Västerbotten Intervention Program.
Competing interest
The authors declare that they have no competing interests.
Authors’contributions
AN drafted the study, did all statistical analyses, drafted and revised the manuscript. OS gave substantial advice for the design of the study and for the statistical analyses. FN contributed to the design and statistics of the study and revised the manuscript critically. MN contributed to the data collection, the design of the study and revised the manuscript critically. SJK discussed the statistical analyses and revised the manuscript critically. LL gave substantial advice for the conception of the study and revised the manuscript critically. All authors read and approved the final manuscript.
Received: 8 January 2014 Accepted: 3 October 2014
References
1. Diabetes Atlas Update 2012.In [http://www.idf.org/sites/default/files/ 5E_IDFAtlasPoster_2012_EN.pdf]
2. Tuomilehto J, Lindstrom J, Eriksson JG, Valle TT, Hamalainen H, Ilanne-Parikka P, Keinanen-Kiukaanniemi S, Laakso M, Louheranta A, Rastas M, Salminen V, Uusitupa M:Prevention of type 2 diabetes mellitus by changes in lifestyle among subjects with impaired glucose tolerance.N Engl J Med2001, 344:1343–1350.
3. Lindstrom J, Neumann A, Sheppard KE, Gilis-Januszewska A, Greaves CJ, Handke U, Pajunen P, Puhl S, Polonen A, Rissanen A, Roden M, Stemper T, Telle-Hjellset V, Tuomilehto J, Velickiene D, Schwarz PE, Acosta T, Adler M, AlKerwi A, Barengo N, Barengo R, Boavida JM, Charlesworth K, Christov V, Claussen B, Cos X, Cosson E, Deceukelier S, Dimitrijevic-Sreckovic V, Djordjevic P,et al:Take Action to Prevent Diabetes - A Toolkit for the Prevention of Type 2 Diabetes in Europe.Exeter: Brightsea Press; 2010.
4. TDPRG:Reduction in the incidence of type 2 diabetes with lifestyle intervention or metformin.N Eng J Med2001,346:393–403.
5. WHO:Definition, diagnosis and classification of diabetes mellitus and its complications, Part 1: Diagnosis and classification of diabetes mellitus.In Volume 99.2. Geneva: World Health Organization; 1999:1–59.
6. DeFronzo RA, Abdul-Ghani M:Assessment and treatment of cardiovascular risk in prediabetes: impaired glucose tolerance and impaired fasting glucose.Am J Cardiol2011,108:3B–24B.
7. Neumann A, Norberg M, Schoffer O, Norström F, Johansson I, Klug SJ, Lindholm L:Risk equations for the development of worsened glucose status and type 2 diabetes mellitus in a Swedish intervention program.
BMC Public Health2013,13:1034.
8. Drummond M, Sculpher MJ, Torrance GW, O'Brien BJ, Stoddart GL:Methods for the Economic Evaluation of Health Care Programmes.New York: Oxford University Press; 2005.
9. Neumann A, Schwarz P, Lindholm L:Estimating the cost-effectiveness of lifestyle intervention programmes to prevent diabetes based on an example from Germany: Markov modelling.Cost Eff Resour Alloc2011, 9:17.
10. Vaatainen S, Keinanen-Kiukaanniemi S, Saramies J, Uusitalo H, Tuomilehto J, Martikainen J:Quality of life along the diabetes continuum: a cross-sectional view of health-related quality of life and general health status in middle-aged and older Finns.Qual Life Res2014,7:1935.
11. Norberg M, Wall S, Boman K, Weinehall L:The Vasterbotten Intervention Programme: background, design and implications.Global Health Action
2010,3:4643.
12. Norberg M, Blomstedt Y, Lonnberg G, Nystrom L, Stenlund H, Wall S, Weinehall L:Community participation and sustainability–evidence over 25 years in the Vasterbotten Intervention Programme.Global Health Action
2012,5:1–9.
13. Ware JE Jr, Sherbourne CD:The MOS 36-item short-form health survey (SF-36). I. Conceptual framework and item selection.Med Care1992, 30:473–483.
14. Brazier JE, Roberts J:The estimation of a preference-based measure of health from the SF-12.Med Care2004,42:851–859.
15. Lindsay G, Inverarity K, McDowell JR:Quality of life in people with type 2 diabetes in relation to deprivation, gender, and age in a new community-based model of care.Nurs Res Pract2011,2011:613589. 16. Jenkinson C, Coulter A, Wright L:Short form 36 (SF36) health survey
questionnaire: normative data for adults of working age.BMJ1993, 306:1437–1440.
17. Jacobson AM, de Groot M, Samson JA:The evaluation of two measures of quality of life in patients with type I and type II diabetes.Diabetes Care
1994,17:267–274.
18. Polonsky WH, Anderson BJ, Lohrer PA, Welch G, Jacobson AM, Aponte JE, Schwartz CE:Assessment of diabetes-related distress.Diabetes Care1995, 18:754–760.
19. Quercioli C, Messina G, Barbini E, Carriero G, Fani M, Nante N:Importance of sociodemographic and morbidity aspects in measuring health-related quality of life: performances of three tools: comparison of three questionnaire scores.Eur J Health Econ2009,10:389–397. 20. Kharroubi SA, Brazier JE, Roberts J, O'Hagan A:Modelling SF-6D health
state preference data using a nonparametric Bayesian method.
J Health Econ2007,26:597–612.
21. Holm S:A simple sequentially rejective multiple test procedure.Scand J Stat
1979,6:65–70.
22. Ferrari SLP, Cribari-Neto F:Beta regression for modelling rates and proportions.J Appl Stat2004,31:799–815.
23. Buis MLC, Nicolas J, Stephen P:BETAFIT: Stata module to fit a two-parameter beta distribution.In http://econpapers.repec.org/software/bocbocode/ s435303.htm 2012, Accessed: 18 May 2014.
24. Hunger M, Baumert J, Holle R:Analysis of SF-6D index data: is beta regression appropriate?Value Health2011,14:759–767.
25. Basu A, Manca A:Regression estimators for generic health-related quality of life and quality-adjusted life years.Med Decis Making2012, 32:56–69.
26. Hunger M, Doring A, Holle R:Longitudinal beta regression models for analyzing health-related quality of life scores over time.BMC Med Res Methodol2012,12:144.
27. Smithson M, Verkuilen J:A better lemon squeezer? Maximum-likelihood regression with beta-distributed dependent variables.Psychol Methods
2006,11:54–71.
28. Burstrom K, Sun S, Gerdtham UG, Henriksson M, Johannesson M, Levin LA, Zethraeus N:Swedish experience-based value sets for EQ-5D health states.Qual Life Res2013,2:431.
30. Kontodimopoulos N, Pappa E, Papadopoulos AA, Tountas Y, Niakas D: Comparing SF-6D and EQ-5D utilities across groups differing in health status.Qual Life Res2009,18:87–97.
31. Dukes JL, Seelam S, Lentine KL, Schnitzler MA, Neri L:Health-related quality of life in kidney transplant patients with diabetes.Clin Transpl
2013,27:E554–E562.
32. Eriksson MK, Hagberg L, Lindholm L, Malmgren-Olsson EB, Osterlind J, Eliasson M: Quality of life and cost-effectiveness of a 3-year trial of lifestyle intervention in primary health care.Arch Intern Med2010,170:1470–1479.
33. Gentile S, Beauger D, Speyer E, Jouve E, Dussol B, Jacquelinet C, Briancon S: Factors associated with health-related quality of life in renal transplant recipients: results of a national survey in France.Health Qual Life Outcomes
2013,11:88.
34. van den Berg B:Sf-6d population norms.Health Econ2012,21:1508–1512. 35. Wong CK, Lo YY, Wong WH, Fung CS:The associations of body mass
index with physical and mental aspects of health-related quality of life in Chinese patients with type 2 diabetes mellitus: results from a cross-sectional survey.Health Qual Life Outcomes2013,11:142. 36. Sach TH, Barton GR, Doherty M, Muir KR, Jenkinson C, Avery AJ:The
relationship between body mass index and health-related quality of life: comparing the EQ-5D, EuroQol VAS and SF-6D.Int J Obes2007,31:189–196. 37. Kortt MA, Clarke PM:Estimating utility values for health states of
overweight and obese individuals using the SF-36.Qual Life Res2005, 14:2177–2185.
38. Currie CJ, Poole CD, Woehl A, Morgan CL, Cawley S, Rousculp MD, Covington MT, Peters JR:The health-related utility and health-related quality of life of hospital-treated subjects with type 1 or type 2 diabetes with particular reference to differing severity of peripheral neuropathy.
Diabetologia2006,49:2272–2280.
doi:10.1186/s12955-014-0150-z
Cite this article as:Neumannet al.:Health-related quality of life for pre-diabetic states and type 2 diabetes mellitus: a cross-sectional study in Västerbotten Sweden.Health and Quality of Life Outcomes201412:150.
Submit your next manuscript to BioMed Central and take full advantage of:
• Convenient online submission
• Thorough peer review
• No space constraints or color figure charges
• Immediate publication on acceptance
• Inclusion in PubMed, CAS, Scopus and Google Scholar
• Research which is freely available for redistribution