R E S E A R C H
Open Access
Reliability analysis of the Chinese version of
the Functional Assessment of Cancer
Therapy
–
Leukemia (FACT-Leu) scale based
on multivariate generalizability theory
Qiong Meng
1,2†, Zheng Yang
3†, Yang Wu
4, Yuanyuan Xiao
2, Xuezhong Gu
5, Meixia Zhang
1, Chonghua Wan
6*and Xiaosong Li
1*Abstract
Background:The Functional Assessment of Cancer Therapy–Leukemia (FACT-Leu) scale, a leukemia-specific instrument for determining the health-related quality of life (HRQOL) in patients with leukemia, had been developed and validated, but there have been no reports on the development of a simplified Chinese version of this scale. This is a new exploration to analyze the reliability of the HRQOL measurement using multivariate generalizability theory (MGT). This study aimed to develop a Chinese version of the FACT-Leu scale and evaluate its reliability using MGT to provide evidence to support the revision and improvement of this scale.
Methods:The Chinese version of the FACT-Leu scale was developed by four steps: forward translation, backward translation, cultural adaptation and pilot-testing. The HRQOL was measured for eligible inpatients with leukemia using this scale to provide data. A single-facet multivariate Generalizability Study (G-study) design was demonstrated to estimate the variance–covariance components and then several Decision Studies (D-studies) with varying numbers of items were analyzed to obtain reliability coefficients and to understand how much the measurement reliability could be vary as the number of items in MGT changes.
Results:One-hundred and one eligible inpatients diagnosed with leukemia were recruited and completed the HRQOL measurement at the time of admission to the hospital. In the G-study, the variation component of the patient-item interaction was largest while the variation component of the item was the smallest for the four of five domains, except for the leukemia-specific (LEUS) domain. In the D-study, at the level of domain, the generalizability coefficients (G) and the indexes of dependability (Ф) for four of the five domains were approximately equal to or greater than 0.80 except for the Emotional Well-being (EWB) domain (>0.70 but <0.80). For the overall scale, the compositeGand compositeФ coefficients were greater than 0.90. Based on theGcoefficient andФcoefficient, two decision options for revising this scale considering the number of items were obtained: one is a 37-item version while the other is a 45-item version. Conclusion:The Chinese version of the FACT-Leu scale has good reliability as a whole based on the results of MGT and the implementation of MGT could lead to more informed decisions in complex questionnaire design and improvement.
Keywords: Acute leukemia, Chronic leukemia, Quality of life, Evaluation studies, Multivariate generalizability theory, Reliability
* Correspondence:[email protected];[email protected] †Equal contributors
6
School of Humanities and Management, Guangdong Medical University, Dongguan 523808, Guangdong Province, China
1West China School of Public Health, Sichuan University, Chengdu, Sichuan
610041, China
Full list of author information is available at the end of the article
Background
Leukemia, the first major cause of cancer-related deaths for children and adults under 35 years old, is an increas-ingly common health care problem in the world. It can be divided into two categories, i.e., acute leukemia and chronic leukemia, based on the natural course and the cellular differentiation degree. In China, it has been esti-mated that there were 75,300 new cases of leukemia and 53,400 deaths in 2015 [1]. The treatment can mitigate the clinical symptoms and improve the 1- and 5-year overall survival rates but also introduces toxicity that can offset the clinical benefit. For patients with cancer, the primary concerns include the disease symptoms, treatment toxicity, increased risk of second malignancy, long-term and late effects of treatment (e.g., fatigue), de-pressive mood and anxiety, reduced work efficiency and family dysfunction. These concerns can be reflected by a comprehensive and multidimensional index: the health-related quality of life (HRQOL). There is an increasing recognition of the need to assess the HRQOL when doc-tors administer certain types of clinical treatment [2]. However, the measurement of the HRQOL for patients with leukemia needs specific, reliable and effective instruments.
Consequently, several leukemia-specific instruments have been developed and used, which include the Life Ingredient Profile for hematologic malignancies [3], the Medical Research Council/EORTC Quality of Life Questionnaire-Leukaemia Module (MRC/EORTC QLQ-LEU [4]), an HRQOL scale for individuals with leukemia in long-term remission, the EORTC for Chronic Myeloid Leukaemia (EORTC QLQ-CML24), which contains an additional EORTC leukemia-specific module [5], and the Functional Assessment of Cancer Therapy-Leukemia (FACT-Leu) scale [6]. Among these instruments, the FACT-Leu scale was created by combining the Functional Assessment of Cancer Therapy-General module (FACT-G) [7] and a sub-scale made up of 17 leukemia-specific items. The original English version was developed by Northwestern University in the USA which has been working with us. The use of the FACT scale system has been officially sanctioned. To the best of our understanding, there have been no reports of the development of a simplified Chinese version of the FACT-Leu scale. Therefore, the major objective of this study was to develop a sound simplified Chinese version of the FACT-Leu scale.
Although the original English FACT-Leu scale has been tested and determined to be a valid, reliable, and efficient instrument for evaluating the leukemia-specific HRQOL in both acute and chronic disease [6], it is ne-cessary to test the reliability and validity of the simplified Chinese version before its expanded use in the clinic, in consideration of the possible culture-sensitive character-istics of the HRQOL. Usually, researchers evaluate the
in assessing the reliability of HRQOL, none considered MGT. Therefore, the secondary objective of the current study was to evaluate the reliability of the Chinese version of the FACT-Leu scale by using MGT. The current study is expected to answer the following questions:
(1)What is the reliability of the Chinese version of the FACT-Leu scale?
(2)What impact does the test length (number of items) have on the reliability of the Chinese version of the FACT-Leu scale?
(3)How should the number of items for every domain in the Chinese version of the FACT-Leu scale be changed to obtain better reliability in the future?
Methods
Translation of the simplified Chinese version of the FACT-Leu scale
The FACT-Leu scale was translated from the original English version into simplified Chinese. In the translation procedures four steps were carried out: forward transla-tion, backward translatransla-tion, cultural adaptatransla-tion, and pilot-testing. In the first step, the original English version was independently translated into simplified Chinese by two translators (one an epidemiologist and the other an on-cologist who specializes in leukemia) whose native lan-guage is Chinese but who are proficient in English. Then the two forward translated versions were compared by a research coordinator to find any differences. When the differences were identified, the research coordinator dis-cussed them with the two translators until they all agreed on a reconciled Chinese version. In the second step, the reconciled Chinese version was translated into English by two back-translators who had never read the original English version. The two back-translators are both on-cologist who are proficient in English. Then, the back-ward translation and the original English version were compared, and the reconciled Chinese version was fur-ther modified accordingly by the same coordinator. The process was repeated until the backward translation was identical or nearly identical to the original English version. After that, the items that were likely to lead to confusion or misunderstanding due to cultural differences were modified based on the results from an in-depth interview of oncologists and a focus group discussion. In the final step, a pilot test was carried out among 15 pa-tients diagnosed with leukemia and who satisfied the eligibility criteria. They were asked to independently complete the scale acquired in the third step and then were interviewed using a questionnaire. Any item that was upsetting or difficult to understand should be marked and given appropriate suggestions during the interview. Based on the suggestions from the patients, necessary modifications were made and a final Chinese version
for use in the formal measurement of the HRQOL was obtained.
Structure of the Chinese versions of the FACT-Leu scale
The structure of the Chinese version of the FACT-Leu scale is the same as that of the original English version; it is composed of two subscales (the 27-item FACT-G and the 17-item leukemia-specific subscale). The FACT-G consists of four domains: the 7-item Physical Well-being (PWB) domain, the 7-item Social/Family Well-being (SWB) domain, the 6-item Emotional Well-being (EWB) domain and the 6-item Functional Well-being (FWB) domain. For ease of description, the leukemia-specific subscale is called the LEUS domain in this article. Each item of the FACT-Leu scale was rated on a five-level scoring system, namely, not at all, a little bit, somewhat, quite a bit, and very much. The positive items received scores from 0 to 4 points, while the negative items were designed with scoring in the reverse order.
Study subjects
This study recruited inpatients diagnosed with leukemia at the First Affiliated Hospital of Kunming Medical Uni-versity and the First People’s Hospital of Yunnan Prov-ince during October 2013 to March 2014. Eligible participants were aged 18 years or older, at least 2 months post diagnosis of any type or stage of leukemia, had a life expectancy of more than 3 months, and were able to read and understand the questionnaires. Exclu-sion criteria included a diagnosis of psychosis or demen-tia and illiteracy.
Measurement process
The investigators (doctors, nurses and medical post-graduate students) obtained informed consents from the patients who agreed to participate in the study and met the inclusion criteria. The Chinese version of the FACT-Leu scale was used to measure the HRQOL of the in-cluded leukemia patients after the investigators explained the study and the scale. The HRQOL is a self-report measurement, so each patient was asked to answer the scale by himself or herself. The answers were immediately checked by the investigators to verify completeness. If missing items were found, the scale was returned to the patients immediately to fill in the missing items. The pa-tients completed the 44-item FACT-Leu scale at the time of admission to the hospital.
A multivariate generalizability theory approach
measurement facets based on the data collected and using analysis of variance (ANOVA) or multiple analysis of vari-ance (MANOVA). In the D-study, the information from the G-study is used for the planning of an“optimal” meas-urement protocol so that the best possible reliability can be achieved while balancing other factors.
In generalizability theory, a latent trait is defined by sets of conditions under which it may be observed; each set of conditions is called a facet. Usually, the latent trait is the object of measurement [31]. In this study, the HRQOL of patients is defined as the measurement goal and may be measured with different items and at differ-ent times; the items and times may be conceived as two different facets. Two or more facets can be combined in various ways, along with the definition of the objects of measurement (the persons), to define a set of observa-tions, called the universe of assessable observations (UAO) for a given latent trait [31]. In a D study, a uni-verse of generalization (UG), which contains those facets and conditions that a study was willing to generalize with a particular measurement procedure, is specified. Along with the specification of the UG, universe scores for the objects of measurement are defined. A universe score is defined as the expected value of the observed scores for a measurement goal over all conditions in the UG [31]. Usually, it is defined that the UG and the UAO have the same structure.
Multivariate G-study design
As the first step, the G-study includes design, data col-lection, and estimation of the relevant variance-covariance components under the design conditions. In the current study, the measurement goal is the HRQOL of patients with leukemia, which is abbreviated as“p” in the design and the items facet (abbreviated as“i”) is the only facet of measurement because the HRQOL is a self-report measurement and there is no rater. The items facet is a random facet because a different set of items can be involved in each replication. The HRQOL data are unbalanced because there are unequal numbers of items within each domain. The domains facet (abbreviated as“h”) is treated as the fixed facet because every replica-tion of the measurement of the HRQOL involved the same domains. It is defined that the facet i was nested within the facet h. In addition, facet p is completely crossed with facet i because every patient answers every item in the FACT-Leu scale. In the univariate G-study sense, this design is expressed asp× (i:h), wherep,i, and
h represent patients, items, and domains facets, re-spectively. The fixed domains facet and the random ef-fect variance component design associated with each fixed domain level yield a multivariate G study design,
p•×i∘, with the number of levels for the fixed domains facet being nh. The solid circle, ·, indicates that the
patients facet is crossed with the fixed multivariate vari-able (i.e., domain) whereas the empty circle,∘, indicates that the items facet is nested within the fixed multivari-ate variable. In other words, there is a random effect
p•×i∘design within each of the five fixed domains and any single item is only associated with a single domain [32]. The mathematical models of thep•×i∘design can be defined as
Xpih¼μhþμpheþμi:heþμpi:h;ee ð1Þ
or
Xpih¼μhþ μph−μh
þðμi:h−μhÞ þ Xpih−μph−μi:hþμh
ð2Þ
In Equation 1, Xpih is the observed score that results from a single observation in the hth domain and this score may be decomposed into an overall mean and sev-eral effects according to the analysis of variance model. In the right-hand side of Equation 1,μhmeans the over-all mean in thehthdomain;μph∼(μph∼=μph−μh) means the patient effect in the hthdomain because μph is the average score of all items for patient “p” in the hth do-main; μi:h∼(μi:h∼=μi:h−μh) means the item effect on the observed score in thehthdomain becauseμi:his the average score per person for item“i” in the hthdomain; andμpi:h,e~ means the residual effects in thehthdomain, including the patient-item interaction effect and other ef-fects. The FACT-Leu scale has five domains (nh= 5), and the model equations for the different domains can be pre-sented as follows:
1
ð ÞXpi¼ð Þ1μþð Þ1μpe þð Þ1μieþð Þ1μpi;e e 2
ð ÞXpi¼ð Þ2μþð Þ2μpeþð Þ2μieþð Þ2μpi;ee
3
ð ÞXpi¼ð Þ3μþð Þ3μpeþð Þ3μieþð Þ3μpi;ee
4
ð ÞXpi¼ð Þ4μþð Þ4μpeþð Þ4μieþð Þ4μpi;ee
5
ð ÞXpi¼ð Þ5μþð Þ5μpeþð Þ5μieþð Þ5μpi;ee
g
ð3Þ
It follows that the variance and covariance compo-nents for the population and the UAO can be grouped into three symmetric matrices:∑p, ∑iand ∑pi. Note that ∑pis the variance–covariance component matrix among patients, ∑i is the variance–covariance component matrix for items within a domain, and∑piis the patient-item interaction within a domain. As all patients con-tribute data to all levels of domains facet but the items are nested in different levels of domains facet,∑pis a full matrix while∑iand∑piare diagonal [32].
Multivariate D-study designs
the D-study to estimate the variance components of the universe score and the variance components of the corresponding error to calculate the two reliabil-ity coefficients: the generalizabilreliabil-ity coefficients (G) and the index of dependability (Ф) for every domain and the overall scale. Several D-studies under the original measurement protocol and the new measurement proto-cols modified by changing the number of items were ana-lyzed to understand how the measurement reliability could vary with a changing number of items.
Original measurement protocol
Following the method in a univariateP×Idesign (letters should be capitalized in the D-study) and the definition of the variance for the composite, we could define ∑P=∑p, ∑I=∑i/nih′ and ∑PI=∑pi/∑nih in the multivariate D-study. Note that∑i/nih′ means theh
th
diagonal element in∑idivided by the corresponding number of items (nih′), and∑pi/∑nihmeans thehthdiagonal element in∑pidivided bynih′, because∑nihwas designed to be a diagonal matrix containing the numbers of items within the levels of h
(e.g.,∑nih=diag(7, 7, 6, 7, 17) in this study).
In thep•×i∘design, the patient-item interaction within domain (pi:h) component alone constitutes the variation of the relative error, while the variation of the absolute error contains both the patient-item interaction within domain (pi:h) component and the item within domain (i:h) component. Therefore, the variance component of the relative error for every domain (σδh2) and the variance component of the absolute error for every domain (σΔh2 ) can be calculated using Equation 4 and Equation 5.
σ2
δh ¼σ2PI:h¼σ2pi:h=n′ih ð4Þ
σ2
Δh ¼σ2I:hþσ2PI:h ¼σ2i:h=n′ihþσ2pi:h=n′ih ð5Þ
Actually, in thep•×i∘design,σ2δhequals to ∑PIand σΔ2h equals to the direct sum of diagonal matrices∑PIand∑I. The G coefficient and the Ф coefficient are calculated using Equation 6 and Equation 7, respectively. In Equa-tion 6 and 7,σh2(P) is the variance component of the pa-tients in the D-study, which is the diagonal elements in matrix∑P(∑P=∑p).
Gh ¼σ2hð ÞP = σ2hð Þ þP σ2δh
ð6Þ
Φh¼σ2hð ÞP = σ2hð Þ þP σ2Δh
ð7Þ
In the MGT framework, not only these indexes for every domain of scale but also the corresponding com-posite values of these indexes for the overall scale ob-tained by defining a weight coefficient are important. The weight coefficient (wh) reflects the proportion of the total number of items in the measurement procedure that were associated with eachhin the overall scale. It is
commonly defined aswh=nih/ni·, wherenihis the num-ber of items in the hth domain and ni· designates the
total number of items in all domains of the overall scale, that is, ni·=nih(1)+nih(2)+nih(3)+nih(4)+nih(5). The
weight coefficient is applied to the corresponding vari-ance (σh2) or covariance (σhh′) to calculate the composite
values of those indexes. For example, the composite uni-verse score variance for overall scale (σc2(P)) can be cal-culated by Equation 8, while the composite variance of the relative error (σδ2c) and the absolute error (σΔ2c) for the overall scale can be calculated by Equations 9 and 10, respectively.
σ2
cð Þ ¼P
Xnh
h¼1
w2hσ2hð Þ þP X nh
h
Xnh
≠h′
whwh′σhh′ð ÞP w2h ð8Þ
σ2 δc¼
Xnh
h¼1
w2hσ2PI:h ð9Þ
σ2 Δc¼
Xnh
h¼1
w2hσ2I:hþX nh
h¼1
w2hσ2PI:h ð10Þ
Afterσc2(P),σδc2 andσΔc2 are obtained by Equations 8 ~ 10, the composite G coefficient and the composite Ф coeffi-cient for the overall scale can be calculated by making use of the same principles as used in Equation 6 and 7. The estimated variance-covariance component matrices and all indexes used to reflect the measurement error and reliability in MGT can be calculated using a specialized software, mGENOVA. The software and the manual for mGENOVA [33, 34] can be downloaded from the website http://www.uiowa.edu/~itp or http://www.uiowa.edu/ ~casma. mGENOVA can process an almost unlimited number of observations very rapidly.
filename of the code file (for example, FACTLEU.txt) and a return were typed, mGENOVA completed its execution.
New measurement protocols
To understand how the numbers of items would affect the measurement reliability of the Chinese version of the FACT-Leu scale and provide some suggestion for the modification of the scale, several multivariate D studies were conducted using a three-step process.
In the first step, the test length (the number of items) was varied proportionally to three test lengths: the ori-ginal test length and half and double test lengths. For ex-ample, the “half” test length had a total of 24 items, where nih′(PWB)=nih′(SWB)=nih′(FWB)= 4, nih′(EWB)= 3 and nih′(LEUS)= 9 because the number of items was rounded
off. It was assumed that there were 4 random parallel items each of the PWB domain, SWB domain, and FWB domain, 3 items in the EWB domain and 9 items in the LEUS domain. Based on the results of previous D stud-ies and the criteria that an optimal reliability coefficient is usually defined as greater than 0.80, we could deter-mine which domain should be increased and which do-main should be decreased based on the number of items. Then, the range in which the number of items of every domain should be changed in the next D-study analysis was defined.
In the second step, five scenarios were designed. In each scenario, only the number of items in one domain was changed, while the other four domains kept their original test lengths. In the first scenario, scenario A, the number of items in the PWB domain was changed in the range defined in the first step, while the other four domains kept their original test lengths; the same steps were followed for scenario B, C, D and E by changing the number of items in domains SWB, EWB, FWB and LEUS, respectively. Several multivariate D-studies were conducted for each scenario to find the appropriate number of items for each domain, deemed to be the number that made either the G coefficient or Ф coeffi-cient just above 0.8 with simultaneously observed large composite G and composite Ф coefficients (>0.90). To describe the results of every scenario more concisely, the “appropriate number of items” that made the G coeffi-cient just larger than 0.8 was defined asniG, and the “ ap-propriate number of items” that made the Ф coefficient just larger than 0.8 was defined asniϕ.
In the third step, the numbers of items for the five domains were reallocated based on theniGfor each do-main and the niϕfor each domain found in the second step to provide two decision options for the further modification of the scale, and two multivariate D-studies were then conducted for the two decision options.
Results
General characteristics of the patients
After excluding the patients who were not willing or un-able to participate, 101 eligible inpatients diagnosed with leukemia were included. The patients were aged 18 ~ 80 years old (the mean age was 40.46 ± 15.12 years old); 55.4% were males and most (80.2%) were of the Han ethnicity. For their education level, 60.4% completed high school. 76.2% were married and most (92.1%) had public insurance. Only 10.9% thought their economic status was well-off. 69 patients (68.3%) were diagnosed with acute leukemia, and 32 (31.7%) were diagnosed with chronic leukemia. The characteristics of the pa-tients are provided in Additional file 3: Table S1.
Reliability based on MGT G study results
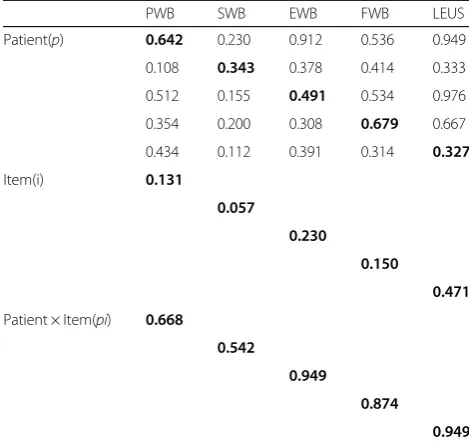
As discussed previously, the MGT applications include the G-study and D-study. Table 1 presents the G-study results for all variance components (the diagonal ele-ments) and covariance components (covariation among the domains) of the five domains of the Chinese version of the FACT-Leu scale based on the current design (7 items in PWB domain, 7 items in SWB domain, 6 items in EWB domain, 7 items in FWB domain, and 17 items in LEUS domain; 44 items in total).
Each of the variance components of the patients (σp2) represented the estimated “true score” variance across the patients on the specific domain of the scale. Based on the results, this variance component was the largest (0.679) for the FWB domain, followed by the PWB do-main (0.642) and the EWB dodo-main (0.491). The variance component of the LEUS domain was the lowest (0.327). Such information suggested that, relatively speaking, the HRQOL of the patients with leukemia differed most on the FWB domain and least on the LEUS domain. The correlation coefficients between the five domains were relatively large, those between the PWB domain and EWB domain, PWB domain and LEUS domain, and EWB domain and LEUS domain, with values of 0.912, 0.949 and 0.976, respectively. These results further cor-roborated that it was very suitable to use MGT methods to evaluate the reliability of the FACT-Leu scale.
variation in a domain score was from the person-item interaction, we can assume that different subjects might react to the same item in different ways, despite having the same total score on the scale.
D study results
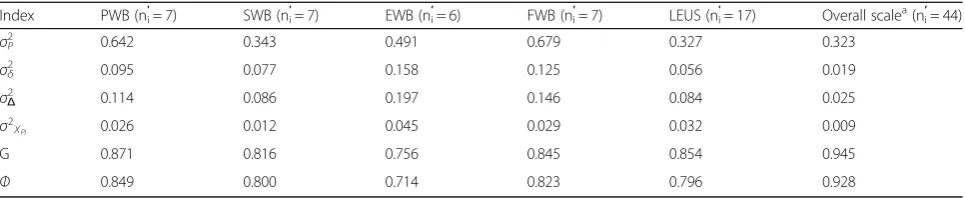
(a)D-study results under the original measurement
protocol The D-study results under the original
meas-urement protocol are presented in Table 2. It shows that the G and Ф coefficients for four of the five domains were approximately equal to or greater than 0.80, except for the EWB domain based on original test length. These two reliability coefficients for the EWB domain were greater than 0.70 but smaller than 0.80. The variance components of error when estimating the universe score by using the sample mean for all domains were smaller than 0.05. Additionally, it is clear that the G coefficient was larger thanФfor every domain.
Based on the weight coefficients (listed in Table 3), the variance components of the universe score and of the corresponding errors for the five domains were inte-grated, and then the composite Gand the compositeФ were computed for the overall scale, with the results presented in Table 2. The last column in Table 2 shows that the compositeGand composite Фcoefficients were both greater than 0.90 and the composite variance com-ponent of error when estimating the universe score using the sample mean was 0.009 based on the original test length.
Further analyses (in Table 3) indicate that the contri-bution rate for composite universe score (CRCUS) approached the proportion of the domain score (PDS) of the original design for most domains. The greatest dif-ference between the contributioin rate for the composite universe score and the proportion of the domain score was seen in the SWB domain (the absolute and relative differences were −7.64% and −48.02%, respectively), while the difference between these two indexes for the LEUS domain was the smallest (absolute and relative dif-ferences of 0.75% and 1.94%, respectively).
(b)D-study results under New measurement protocols
As mentioned in the methodology section, to provide guidance in the modification of the scale, several multi-variate D-studies were conducted using a three-step process.
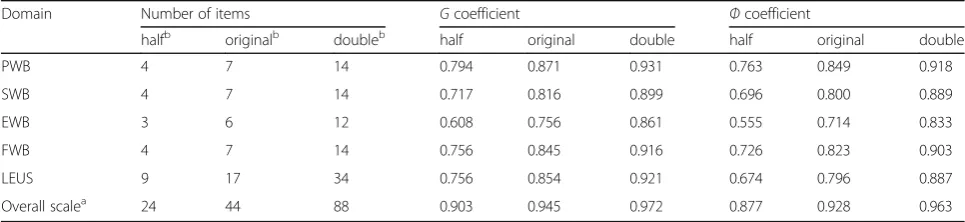
Firstly, Fig. 1 provides a graphical representation of the effect on the two reliability coefficients (G and Ф) when the test length was changed. Figure 1 implies that a longer test length led to a larger reliability coefficient in every domain and in the overall scale. The increment speed of the two reliability coefficients from “half” to “original” was faster than that from “original” to “double”. Even though the number of items was reduced by half, the compositeGcoefficient was still greater than 0.90 and the composite Ф coefficient was still greater than 0.85.
As described in Table 4, among the five domains, under the original test length, both the Gand Ф coeffi-cients were the largest for the PWB domain whereas they were the smallest for the EWB domain. After the test length was reduced to a half, the G and Ф coeffi-cients for the EWB domain were both smaller than 0.70. Given that an optimal reliability coefficient is usually de-fined as one that is greater than 0.80, the number of items of the EWB domain needs to be increased from the original test length, and the changing range of the number of items in the next D-study analysis was de-fined as from 6 to 12. In the same way, the numbers of items of the PWB domain, FWB domain, FWB domain and LEUS domain could be slightly decreased from the original test length, and the changing ranges of the num-bers of items for three of the domains (PWB, SWB and FWB) were defined as from 4 to 7, while the changing ranges of the number of items for the LEUS domain was defined as from 9 to 17. Information on the reallocation of the numbers of items in the five scenarios is provided in Additional file 3: Table S2.
Several multivariate D-studies were conducted for each scenario designed in the second step, and the re-sults are presented in Fig. 2. It is clear from the five panels of Fig. 2 that both the G and Ф coefficients in-creased with the number of items. As shown in the first
Table 1Estimated variance and covariance components for
p•×i∘design in G-study for the five domains of FACT-Leu (n= 101)
PWB SWB EWB FWB LEUS
Patient(p) 0.642 0.230 0.912 0.536 0.949
0.108 0.343 0.378 0.414 0.333
0.512 0.155 0.491 0.534 0.976
0.354 0.200 0.308 0.679 0.667
0.434 0.112 0.391 0.314 0.327
Item(i) 0.131
0.057
0.230
0.150
0.471
Patient × Item(pi) 0.668
0.542
0.949
0.874
0.949
Diagonal elements are estimated variance components and are presented in bold type
panel (Scenario A) of Fig. 2,niGandniϕfor the PWB do-main were both 5, and the composite G and Ф coeffi-cients were both greater than 0.90. Similar results were presented in the second panel (Scenario B) except that
niGand niϕfor the SWB domain were both 7. In turn, it could be seen thatni
G
for the EWB domain was 8 andniϕ was 10 in Scenario C of Fig. 2,niGfor the FWB domain was 5 andniϕwas 6 in Scenario D, andniGfor LEUS do-main was 12 andniϕwas 17 in Scenario E.
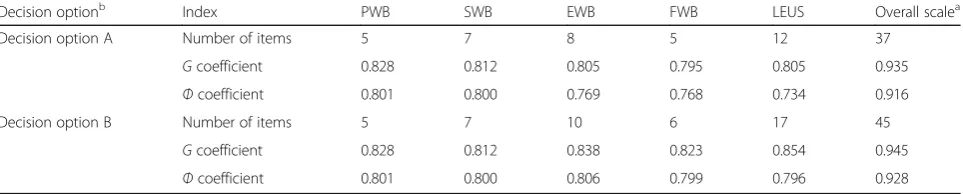
The results of the two multivariate D-studies for the two decision options designed based on these above-mentioned ni
G
and niϕ for each domain are shown in Table 5. The total number of items for the overall scale in decision option A, where the numbers of items for the five domains were reallocated based on ni
G
, could be decreased from 44 to 37, while the total number of items for the overall scale in decision option B, where the numbers of items for five domains were reallocated based onniϕ, would be slightly increased from 44 to 45. It is clear that the composite Gand Ф coefficients were both greater than 0.90 for both decision option A and decision option B. In decision option A,the G coeffi-cients for all domains were greater than or approxi-mately equal to 0.80, but only Ф coefficients for the PWB and SWB domains were greater than or equal to 0.80. In decision option B, theGandФcoefficients for all domains were greater than or approximately equal to 0.80.
Discussion
Reliability of the Chinese version of the FACT-Leu
The reliability is the extent of variation reflected by the measured results that is the result of accidental errors in the system. In other words, the reliability refers to the dependability, reproducibility, stability, and consistency of the measurement. In GT, theGandФ coefficients are two important reliability coefficients that are used to de-pict the reliability for the “relative decision” and “ abso-lute decision”, respectively. Within the GT framework, the “relative decision” depends on the norm-referenced score interpretation, which considers the consistency of the relative standings of the individuals rather than the consistency of the actual scores, while the“absolute de-cision” depends on criterion-referenced score interpret-ation which considers both the consistency of the relative standings of the individuals and the consistency of the actual scores [16]. The coefficients are selected depending on the researchers’ interests. In HRQOL re-search, if one’s interest lies in conducting a norm-referenced measurement to compare the HRQOL of dif-ferent patients (relative decision), the G coefficient should be selected to specifically determine the HRQOL and quantify the dependability of the score. If one’s goal is to perform a criterion-referenced test to investigate the HRQOL of patients (absolute decision), theФ coeffi-cient should be used to inform about how dependable a score is. It is clear that the Ф coefficient is typically
Table 2D-study results for the five domains and the overall scale forP•×I∘design based on original test length
Index PWB (ni′= 7) SWB (ni′= 7) EWB (n′i= 6) FWB (ni′= 7) LEUS (ni′= 17) Overall scale a
(ni′= 44)
σ2
P 0.642 0.343 0.491 0.679 0.327 0.323
σ2
δ 0.095 0.077 0.158 0.125 0.056 0.019
σ2
Δ 0.114 0.086 0.197 0.146 0.084 0.025
σ2
XPI 0.026 0.012 0.045 0.029 0.032 0.009
G 0.871 0.816 0.756 0.845 0.854 0.945
Ф 0.849 0.800 0.714 0.823 0.796 0.928
σ2
PUniverse score variance,σ 2
δRelative error variance,σ2ΔAbsolute error variance,σ2XPIError variance for mean,Ggeneralizability coefficient,Фindex of dependability
a
For the overall scale, all indexes are the corresponding composite values
Table 3Comparison between the CRCUS and the PDS for every domain
Index PWB SWB EWB FWB LEUS
Number of items 7 7 6 7 17
PDS/Weight Coefficient (%) 15.91 15.91 13.64 15.91 38.63
CRCUS (%) 20.37 8.27 15.76 17.72 37.88
Absolute difference between PDS and CRCUS (%) 4.46 −7.64 2.12 1.81 −0.75
Relative difference between PDS and CRCUS (%) 28.03 −48.02 15.54 11.38 −1.94
lower than the G coefficient for every domain because the variance component of item within domain (i:h) is factored into the absolute error variance and Ф coeffi-cient but not the relative error variance orGcoefficient.
Some researchers [31, 35, 36] suggested that the ability of an instrument is generally good when the reli-ability coefficients (G coefficient or Ф coefficient) are greater 0.8 in GT. The composite G and Ф coefficients were greater than 0.90 for the Chinese version of the FACT-Leu scale with the two indexes for four of the five domains all approximately equal to or greater than 0.80 except for the EWB domain (greater than 0.70 but smaller than 0.80) based on the original test length. Even though the number of items was reduced to a half, the composite G coefficient was still greater than 0.90 and the composite Ф coefficient was still greater than 0.85. These results indicated a very high level of measurement reliability for the Chinese version of the FACT-Leu scale as a whole, and the measurement reliability was also good at the domain levels. Additionally, the results that the contributioin rate for the composite universe score approached the proportion of the domain score in the original design for most domains (except for the SWB domain) exemplified that the allocation of the scale items was reasonable in general. However, it is worth
paying attention to the quality of the items in the SWB domain in the future because the relative difference be-tween these two indexes in the SWB domain was the greatest and the difference value was negative.
Influence of the number of items and suggestions for revision
The G andФ coefficients increased with the number of items and were both greater than 0.8 in the double test length design. However, doubling the test length might not be realistic in practice, because it is possible that the reliability would conversely decrease with the inclusion of too many items due to an excessive consumption of time. An interesting finding in Fig. 1 was that the incre-ment speed of the two reliability coefficients from “ ori-ginal”to“double”gradually slowed down. It was expected that the reliability can be increased without increasing testing time by reallocating the items to different domains. Therefore, we provided two decision options in which the best allocation of the number of items for the overall scale could be designed. Similar to the discussion above, the two decision options for further modifying the Chinese version of the FACT-Leu would be selected from depend-ing on the researcher’s interest. If one’s interest lies in ranking (relative decision), a good consideration would be
0.5 0.55 0.6 0.65 0.7 0.75 0.8 0.85 0.9 0.95 1
Half Original Doubled
P
hi
Coef
fi
ci
en
t
Test Length B A
Overall Scale
PWB
FWB
LEUS
SWB
EWB
Fig. 1Effect on the two reliability coefficients when the test length changed.a:Gcoefficientb:Фcoefficient
Table 4Comparison of the two reliability coefficients for every domain and the overall scale for various test lengths
Domain Number of items Gcoefficient Фcoefficient
halfb originalb doubleb half original double half original double
PWB 4 7 14 0.794 0.871 0.931 0.763 0.849 0.918
SWB 4 7 14 0.717 0.816 0.899 0.696 0.800 0.889
EWB 3 6 12 0.608 0.756 0.861 0.555 0.714 0.833
FWB 4 7 14 0.756 0.845 0.916 0.726 0.823 0.903
LEUS 9 17 34 0.756 0.854 0.921 0.674 0.796 0.887
Overall scalea 24 44 88 0.903 0.945 0.972 0.877 0.928 0.963
a
For the overall scale, theGcoefficient is the compositeGcoefficient and theФcoefficient is the compositeФcoefficient
b
decision option A, in which the number of items in the EWB domain would increase from 6 to 8, the number of items of the SWB domain would remain the same, the numbers of items of the other three domains would be slightly reduced, and the total number of items for the scale would be 37. If one’s interest lies in the absolute standings (absolute decision), a better selection would be decision option B, in which the number of items of the EWB domain would increase from 6 to 10, the numbers of items of the SWB domain and LEUS domain would re-main unchanged, the numbers of items of the other two domains would be slightly reduced, and the total number of items for the scale would be 45.
Limitations
It is worth noting that the sample size of the study is not very large, which may affect the findings to some extent. In addition, the study subjects were from the in-patient population at hospitals, which may affect the generalizability of the scale. Therefore, larger and
additional studies in which the study subjects are ex-panded to other populations such as outpatients are needed to validate the scale. Using MGT analysis, we put forward the suggestions about varying the number of items for every domain from the macroscopic point of view. However, we cannot answer which items would be removed by using MGT analysis. In the follow-up study, we should screen and select the items through the item response theory (IRT) methods.
Conclusion
To sum up, the Chinese version of the FACT-Leu scale has good reliability as a whole based on the results of MGT, and the implementation of MGT could lead to more informed decisions in complex questionnaire design and improvement. If the Chinese version of the FACT-Leu scale will be modified in the future, there will be two available choices depending on the decision needed (rela-tive decision or absolute decision) based on our analytical results: a 37-item version and a 45-item version.
Fig. 2Effects on the reliability coefficients when varying the numbers of items under five scenarios. Note: The corresponding coefficients ofniG andniϕfor every domain are indicated by solid triangles
Table 5Allocation of the numbers of items and theGandФcoefficients for every domain and the overall scale for the two decision options
Decision optionb Index PWB SWB EWB FWB LEUS Overall scalea
Decision option A Number of items 5 7 8 5 12 37
Gcoefficient 0.828 0.812 0.805 0.795 0.805 0.935
Фcoefficient 0.801 0.800 0.769 0.768 0.734 0.916
Decision option B Number of items 5 7 10 6 17 45
Gcoefficient 0.828 0.812 0.838 0.823 0.854 0.945
Фcoefficient 0.801 0.800 0.806 0.799 0.796 0.928
a
For the overall scale,Gcoefficient is the compositeGcoefficient andФcoefficient is the compositeФcoefficient
b
Additional files
Additional file 1:Data Structure and a Screenshot. (DOC 365 kb)
Additional file 2:Example Code of mGENOVA. (DOC 23 kb)
Additional file 3:Supplementary Results.Table S1. General characteristics of the patients included.Table S2.Allocation of the numbers of items per domain for the five scenarios. (DOC 53 kb)
Abbreviations
ALL:Acute lymphoblastic leukemia; AML: Acute myeloid leukemia; ANOVA: Analysis of variance; CLL: Chronic lymphocytic leukemia; CML: Chronic myelogenous leukemia; CRCUS: Contribution rate for composite Universe score; CTT: Classical test theory; D-study: Decision study; EORTC QLQ-CML24: EORTC for Chronic Myeloid Leukaemia; EWB: Emotional Well-being (FACT-Leu); FACT-G: Functional Assessment of Cancer Therapy-General module; FACT-Leu: Functional Assessment of Cancer Therapy– Leukemia; FWB: Functional Well-being (FACT-Leu); G: Generalizability coefficients; G-study: Generalizability study; GT: Generalizability theory; HRQOL: Health-related quality of life; ICC: Intra-class correlation coefficients; IRT: Item response theory; LEUS: Leukemia-specific subscale (FACT-Leu); MANOVA: Multiple analysis of variance; MGT: Multivariate generalizability theory; MRC/EORTC QLQ-LEU: Medical Research Council/EORTC Quality of Life Questionnaire-Leukaemia Module; PDS: Proportion of domain score; PWB: Physical Well-being (FACT-Leu); QLICP-LE: Quality of Life Instrument for Cancer Patients-Leukemia; SWB: Social/Family Well-being (FACT-Leu); UAO: Universe of assessable observations; UG: Universe of generalization; UGT: Univariate generalizability theory;Ф: Indexes of dependability
Acknowledgements
While carrying out this research project, we received substantial assistance from the staffs of the First People’s Hospital of Yunnan Province and the First Affiliated Hospital of Kunming Medical University. We sincerely acknowledge this support.
Funding
Supported by the National Natural Science Foundation of China (81273185, 81302510).
Availability of data and materials
Please contact the authors for data requests.
Authors’contributions
MQ and YZ analyzed and interpreted the data and drafted the manuscript, which was critically revised by all others. WC and LX contributed to the design of the study and supervised statistical analysis. WY and XG were involved in the data collection. XG, as a major clinical expert, validated the clinical aspects of the article. YX was a major contributor in revising the manuscript. ZM carried out the data analysis and literature review. All authors have read and approved the final manuscript.
Competing interests
The authors declare that they have no competing interests.
Consent for publication
No individual’s personal data has been included.
Ethics approval and consent to participate
The study protocol was approved by the Institutional Review Board (IRB) of the investigators’institutions and the hospital. The respondents were anonymous, voluntary and provided consent for participation.
Publisher’s Note
Springer Nature remains neutral with regard to jurisdictional claims in published maps and institutional affiliations.
Author details
1West China School of Public Health, Sichuan University, Chengdu, Sichuan
610041, China.2School of Public Health, Kunming Medical University,
Kunming 650500, Yunnan Province, China.3School of Public Health,
Guangdong Medical University, Dongguan 523808, Guangdong Province, China.4Department of Health Education and Basic Public Health, Kunming
Health Education Institute, Kunming 650034, Yunnan Province, China.
5
Department of Hematology, The First People’s Hospital of Yunnan Province, Kunming 650032, Yunnan Province, China.6School of Humanities and
Management, Guangdong Medical University, Dongguan 523808, Guangdong Province, China.
Received: 29 January 2017 Accepted: 21 April 2017
References
1. Chen W, Zheng R, Baade P, Zhang S, Zeng H, Bray F, Jemal A, Yu X, He J. Cancer Statistics in China, 2015. CA Cancer J Clin. 2016;66:115–32. 2. Redaelli A, Stephens JM, Laskin BL, Pashos CL, Botteman MF. The burden
and outcomes associated with four leukemias: AML, ALL, CLL and CML. Expert Rev Anticancer Ther. 2003;3:311–29.
3. Stalfelt AM, Wadman B. Assessing quality of life in leukemia: presentation of an instrument for assessing quality of life in patients with blood malignancies. Qual Assur Health Care. 1993;5:201–11.
4. Watson M, Zittoun R, Hall E, Solbu G, Wheatley K. A modular questionnaire for the assessment of longterm quality of life in leukaemia patients: the MRC/EORTC QLQ-LEU. Qual Life Res. 1996;5:15–9.
5. Efficace F, Baccarani M, Breccia M, Saussele S, Abel G, Caocci G, Guilhot F, Cocks K, Naeem A, Sprangers M, et al. International development of an EORTC questionnaire for assessing health-related quality of life in chronic myeloid leukemia patients: the EORTC QLQ-CML24. Qual Life Res. 2014;23:825–36.
6. Cella D, Jensen SE, Webster K, Hongyan D, Lai JS, Rosen S, Tallman MS, Yount S. Measuring health-related quality of life in leukemia: the Functional Assessment of Cancer Therapy–Leukemia (FACT-Leu) questionnaire. Value Health. 2012;15:1051–8.
7. Cella DF, Tulsky DS, Gray G, Sarafian B, Linn E, Bonomi A, Silberman M, Yellen SB, Winicour P, Brannon J. The functional assessment of cancer therapy scale: development and validation of the general measure. J Clin Oncol. 1993;11:570–9.
8. Gage NA, Debra P, Hirn R. Increasing reliability of direct observation measurement approaches in emotional and/or behavioral disorders research using generalizability theory. Behav Disord. 2014;39:228–44. 9. Berggraf L, Ulvenes PG, Wampold BE, Hoffart A, McCullough L. Properties of
the Achievement of Therapeutic Objectives Scale (ATOS): a generalizability theory study. Psychother Res. 2012;22:327–47.
10. Hall C. Comment: Generalizability theory and assessment in medical training. Neurology. 2015;85:1628.
11. Iramaneerat C, Yudkowsky R, Myford CM, Downing SM. Quality control of an OSCE using generalizability theory and many-faceted Rasch measurement. Adv Health Sci Educ Theory Pract. 2008;13:479–93.
12. Kang M, Kim Y, Rowe D. Reliability of peak stepping cadences using generalizability theory. Med Sci Sports Exerc. 2013;45:327. 13. Preuss R. Using generalizability theory to develop clinical assessment
protocols. Phys Ther. 2013;93:562–9.
14. Prion S, Gilbert G, Haerling K. Generalizability theory: an introduction with application to simulation evaluation. Clin Simul Nurs. 2016;12:546–54. 15. Ragan BG, Kang M, Marquez T, Bell GW, Zhu W. Graphic pain rating scale
reliability using generalizability theory. Med Sci Sports Exerc. 2004;36:S295. 16. Schünemann HJ, Norman G, Puhan MA, Ståhl E, Griffith L, Heels-Ansdell D, Montori VM, Wiklund I, Goldstein R, Mador MJ, Guyatt GH. Application of generalizability theory confirmed lower reliability of the standard gamble than the feeling thermometer. J Clin Epidemiol. 2007;60:1256–62. 17. Stegner A, Cook D. Evaluating reliability and response bias in
computer-administered pain rating scales: a generalizability theory analysis. J Pain. 2013;14:S22.
18. Vangeneugden T, Laenen A, Geys H, Renard D, Molenberghs G. Applying concepts of generalizability theory on clinical trial data to investigate sources of variation and their impact on reliability. Biometrics. 2005;61:295–304. 19. Volpe RJ, Briesch AM, Gadow KD. The efficiency of behavior rating scales to
assess inattentive-overactive and oppositional defiant behaviors: Applying generalizability theory to streamline assessment. J Sch Psychol. 2011;49:131–55. 20. Wasserman RH, Levy KN, Loken E. Generalizability theory in psychotherapy
21. Paul CC, Jennifer J, Robert G, Mart Beth CG, Connolly G, Sarah RK, Jessica LH, Xin T. A generalizability theory analysis of group process ratings in the treatment of cocaine dependence. Psychother Res. 2011;21:252–66. 22. Yang ZM, Zhang L. Generalizability theory and its applications. Beijing:
Educational science Publishing House; 2003. p. 2–53.
23. Chen D, Hu BY, Fan X, Li K. Measurement quality of the chinese early childhood program rating scale: an investigation using multivariate generalizability theory. J Psychoeduc Assess. 2014;32:236–48. 24. Chavez LM, Garcia P, Ortiz N, Shrout PE. Applying generalizability theory
methods to assess continuity and change on the Adolescent Quality of Life-Mental Health Scale (AQOL-MHS). Qual Life Res. 2016;25:3191–6. 25. Wan C, Li H, Fan X, Yang R, Pan J, Chen W, Zhao R. Development and
validation of the coronary heart disease scale under the system of quality of life instruments for chronic diseases QLICD-CHD: combinations of classical test theory and Generalizability theory. Health Qual Life Outcomes. 2014;12:82.
26. Lei P, Lei G, Tian J, Zhou Z, Zhao M, Wan C. Development and validation of the irritable bowel syndrome scale under the system of quality of life instruments for chronic diseases QLICD-IBS: combinations of classical test theory and generalizability theory. Int J Color Dis. 2014;29:1245–55. 27. Wu J, Hu L, Zhang G, Liang Q, Meng Q, Wan C. Development and validation
of the nasopharyngeal cancer scale among the system of quality of life instruments for cancer patients (QLICP-NA V2.0): combined classical test theory and generalizability theory. Qual Life Res. 2016;25:2087–100. 28. Meng Q, Yang Z, Wan C, Luo J, Dai Y, Cun Y. Reliability analysis of quality of
life instruments for cancer patients-gastric cancer (QLICP-GA) based on generalizability theory. Tumor. 2013;33:428–33.
29. Li W, Luo J, Wan C, Li G, Lu Y, Yang H, Meng Q. Evaluation on reliability of the chinese version of functional assessment of cancer therapy - ovary cancer by classical test theory and generalizability theory. Chin Gen Pract. 2013;16:749–54.
30. Bravo G, Sene M, Arcand M. Reliability of health-related quality-of-life assessments made by older adults and significant others for health states of increasing cognitive impairment. Health Qual Life Outcomes. 2017;15:4. 31. Nussbaum A. Multivariate generalizability theory in
educational-measurement - an empirical-study. Appl Psychol Meas. 1984;8:219–30. 32. Wu Y-F, Tzou H. A multivariate generalizability theory approach to standard
setting. Appl Psychol Meas. 2015;39:507–24.
33. Brennan RL. Generalizability theory. New York: Springer-Verlag New York Inc; 2001.
34. Brennan RL. Manual for mGENOVA (Version 2.1). Iowa City: Iowa Testing Programs; 2001. p. 50.
35. Winterstein BP, Willse JT, Kwapil TR, Silvia PJ. Assessment of Score Dependability of the Wisconsin Schizotypy Scales Using Generalizability Analysis. J Psychopathol Behav Assess. 2010;32:575–85.
36. Keller LA, Clauser BE, Swanson DB. Using multivariate generalizability theory to assess the effect of content stratification on the reliability of a performance assessment. Adv Health Sci Educ. 2010;15:717–33.
• We accept pre-submission inquiries
• Our selector tool helps you to find the most relevant journal • We provide round the clock customer support
• Convenient online submission • Thorough peer review
• Inclusion in PubMed and all major indexing services • Maximum visibility for your research
Submit your manuscript at www.biomedcentral.com/submit