R E S E A R C H
Open Access
Importance of physical health and
health-behaviors in adolescence for risk of
dropout from secondary education in
young adulthood: an 8-year prospective
study
Erla Svansdottir
1,4*, Sigurbjorn A. Arngrimsson
1,2, Thorarinn Sveinsson
3and Erlingur Johannsson
1,2Abstract
Background:Education and health constitute two interlinked assets that are highly important to individuals. In Iceland, prevalence of dropout from secondary education poses a considerable problem. This 8-year prospective study assesses to what extent poor physical health and negative health-behaviors of Icelandic adolescents predict increased odds of dropout from secondary education.
Methods:The sample includedn= 201 Icelandic children who participated at age 15 (baseline) and again at age 23 (follow-up). Data included objective measurements of physical health and questionnaires assessing health-behaviors, education status, parental education, neighborhood characteristics, self-esteem, and depression. Independent t-tests and chi-square were used to assess differences in physical health and health-behaviors at follow-up stratified by education status. Ordinal regression models were conducted to assess whether physical health and health-behaviors at age 15 predicted increased odds of dropout from secondary education at age 23, independent of gender, parental education and psychological factors.
Results:At age 23, 78 % of girls and 71 % of boys had completed a secondary education. Completion of a secondary education was associated with significant health benefits, especially among women. Women without a secondary education had lower fitness, more somatic complaints, higher diastolic blood pressure, less sports
participation, and poorer sleep, whilst men without a secondary education watched more television. In logistic regression models somatic complaints during adolescence were associated with 1.09
(95 % CI: 1.02-1.18) higher odds of dropout from secondary education in young adulthood, independent of covariates. Health-behaviors associated with higher dropout odds included smoking (3.67, 95 % CI: 1.50-9.00), alcohol drinking (2.57, 95 % CI: 1.15-5.75), and time spent watching television (1.27, 95 % CI:1.03-1.56), which were independent of most covariates. Finally, mother’s higher education was strongly associated with significantly lower dropout odds (OR 0.54, 95 % CI: 0.34-0.88) independent of father’s education and psychological factors, whilst high self-esteem was
independently associated with lower dropout odds (OR 0.91, 95 % CI: 0.85-0.98).
Conclusions:Completion of a secondary education yields substantial physical health benefits for young women, but not for men. Importantly, somatic complaints and negative health-behaviors among adolescent boys and girls adversely impact their educational outcomes later in life, and may have widespread consequences for their future prospects.
Keywords:Adolescence, Health Inequalities, Education, Gender, Health-behaviors
* Correspondence:erlas@hi.is
1School of Education, University of Iceland, Stakkahlíð, 105 Reykjavík, Iceland 4
Landspitali-University Hospital, Eiríksgötu 5, 101, Reykjavík, Iceland Full list of author information is available at the end of the article
Background
Education is an important asset for individuals in today’s society. Completion of secondary education provides young adults with the technical and vocational skills needed to secure good jobs and/or the rights to progress to university [1]. Hence, not completing a secondary education can lead to considerable costs to individ-uals, through lower earnings or unemployment, and the society, via lower tax revenue and higher spend-ing on public assistance [2].
Education is considered of high importance in Iceland, as all children and young adults are given an equal right to education, free of charge, in both compulsory and upper secondary school. In the Icelandic Education Sys-tem students attend compulsory school from ages 6–15, whilst secondary education is typically planned from ages 16–19 [3]. However, dropout from secondary edu-cation in the Icelandic setting is a considerable problem, with a prevalence of 30 %, and only 45 % of students graduate on time [4]. In light of this, the Ministry of Education, Science and Culture has put forward the goal to increase completion of secondary education in Iceland on time to 60 % by 2018 [5].
One way to prevent dropout from secondary education could be through health promotion, focusing on stu-dents’ physical and mental health within secondary schools. An inquiry made by the Ministry of Education, Science and Culture among Icelandic secondary schools in 2013 has noted that 17 % of dropout students cited health-related reasons for their dropout, including phys-ical and mental health problems (with other main rea-sons comprising for example failed attendance (25 %), started working (11 %), transferred to another school (12 %), lack of interest (4 %), and financial difficulties (3 %) [6]. Large longitudinal studies have likewise linked low general health status, obesity, and health problems with higher odds of dropout from secondary education [7, 8], indicating that poor health may be an influential factor for lower educational attainment among youths.
Importantly, a report from the World Health Organization (WHO) has specifically criticized how little emphasis western countries have given the influence of health and health-behaviors of children and adolescents on their educational attainment. In the report they ques-tion the one direcques-tionality in research on this topic, that is why the vast majority of studies have only investigated how lower educational attainment is associated with poorer health (i.e. the educational gradient in health [9]), but not how health factors may affect educational attain-ment [10]. Notably, very few studies have investigated this topic in Europe [11], and the ones that have are moreover limited to a certain extent as they have mostly been based on infant or self-report health data [12], or short-term academic outcomes [13]. Data regarding how
psychological factors affect this association are also scarce, particularly concerning depression [10]. Lastly, few studies have adjusted for the possible confound-ing effects of parental education, an important index of socioeconomic status [13, 14], and neighborhood characteristics. Although Iceland contains a largely homogeneous population, with a low unemployment rate and an education and healthcare system similar to the other Nordic countries [15] there is some evi-dence that socio-economic and neighborhood differ-ences in health and well-being are present within the country. Recent findings have for instance reported that socioeconomic inequalities are largest in Iceland of all the Nordic countries [16], and linked certain neighborhood characteristics with more substance abuse among adolescents [17]. Importantly, these fac-tors might influence risk of dropout from secondary school as well, which would directly conflict with the fundamental principle of the Icelandic Education Sys-tem concerning equal rights for acquiring an educa-tion regardless of gender, social status, cultural background, or residential location [18].
Thus, the objective of the current study is to inves-tigate prospectively the relationship between health and education among Icelandic adolescents, with a specific focus on how physical health and health-behaviors during adolescence influence educational at-tainment in young adulthood. More specifically, the aims are: 1) to evaluate differences in the physical health, health-behaviors, and psychological factors of young adults who have or have not completed a sec-ondary education; 2) to examine how physical health and negative health-behaviors of adolescents affect their odds of dropout from secondary education; and 3) to examine if such associations remain after con-trolling for parental education and psychological fac-tors. We hypothesize that young adults who have completed a secondary education will report better physical health, more positive health-behaviors, and a better standing on psychological factors, and that poorer standing on physical health and health-behaviors will be linked with a higher risk of dropout from secondary education, independent of covariates.
Methods
Participants
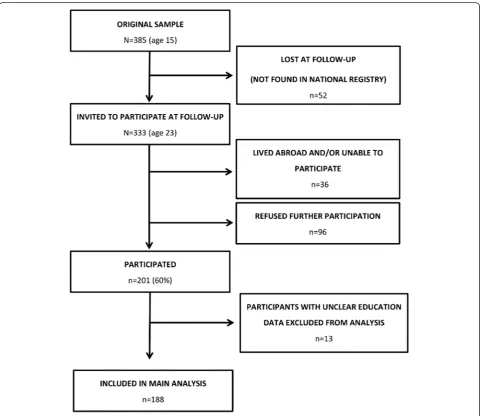
when they attended 10th grade (age 15) of primary school, and a written informed consent was obtained from parents and participants. For the current study, a follow-up was conducted eight years later when partici-pants were 23-years old. At the follow - up,n= 333 (86 %) of the original sample was successfully located and invited to partake in the study. The n= 52 individuals lost at follow - up were subjects who were not found in the National Registry and had most likely moved abroad with their parents or for studies. The scheme for participation in the follow-up study is displayed in detail in Fig. 1. The Icelandic Bioethics Committee approved the study and it was conducted according to the ethical tenets of the Declaration of Helsinki. The study design and mea-surements were conducted in line with the protocol of the European Youth Heart Study [19].
Measures
Demographics: socio-economic status and neighborhood characteristics
Information regarding parental education (what level of education participants’ mothers and fathers had com-pleted (i.e. primary education, vocational education, matriculation examination, university degree)) was col-lected from participants at follow-up, and used as a proxy measure for socio- economic status. Participant’s occupa-tion status and child-rearing responsibilities (whether they had children) were assessed with self-report at follow-up. Neighborhood characteristics of participants were defined by the local-area their respective schools resided in. These were categorized into two areas: a) metropolis (Reykjavik capital area (six schools), and urban/rural (12 schools from smaller towns and rural areas).
Physical health
Objective measures of physical health were conducted at both baseline and follow-up. Of note, due to limited funding resources at baseline, objective measures of fit-ness (with a bicycle ergometer) and physical activity (with accelerometers) were only conducted among half of the participant sample at baseline. Thus, half of par-ticipants from each student class were invited to undergo fitness and physical activity measures at base-line. Conversely, these two measures were conducted among all participants at follow-up. Fitness was assessed with performance on a maximal graded bicycle ergom-eter (Monark 839E) test [20, 21]. A description of the test was given, and the importance of maximal effort was stressed, but participants were also told they could stop cycling at any time. The test has been validated in adolescents [20]. Physical activity was objectively mea-sured with Actigraph activity monitors (model GT3X). Participants carried activity monitors secured by waist belt at their right hip for six consecutive days including both weekend days. These monitors have been validated in youths [22, 23], and the measurement used was counts per minute. Standing height was measured with a transportable stadiometer to the nearest millimeter, and body weight was determined to the nearest 0.1 kg on a scale. Body Mass Index (BMI) was calculated as body mass (kg) divided by height (m) squared. Waist-circumference and skinfold thickness were assessed using standardized procedures. Blood pressure was mea-sured at follow-up using a validated, semi-automated de-vice (ADC Advantage) after participants had rested for ten minutes. Measures were taken over the brachial ar-tery three times. The average of the last two recordings was used. The Somatization subscale of the Symptom Checklist 90 (SCL-90) [24] was used to assess occur-rences of subjective and psychological health complaints (e.g. stomach ache and headache) in the past seven days. The subscale contains eight items scored on a five-point Likert scale.
Health - behaviors
Health-behavior measures included the following at baseline and follow-up: a) smoking in the past 30 days (no, yes); b) alcohol consumption in the past 30 days (no, yes); c) number of hours spent watching television each weekday (almost never, 30–60 min, ≈1 h, ≈2 h, ≈3 h, ≈4 h,≈5 h,≥6 h); and d) how often participants engaged in moderate/vigorous physical activity (d.1) or sports (d.2) (never/rarely, 1–3 times a week, ≥4 times a week). The following health-behaviors were only assessed at follow-up: a) “How many hours do you spend sleeping on weekdays?”(≤7 h per night,≥8 h); and b)“How often do you get enough sleep?”(very seldom, about half of the time, most nights, sleep too much). Prior to analyses,
categories for b) were combined into a binary variable indicating“I don’t get enough sleep”(very seldom/half of the time) versus “I get enough sleep” (most nights/sleep too much).
Psychological factors
Measures of psychological factors included self-esteem and depression, which were measured at baseline and follow-up, and life satisfaction and social support, which were assessed at follow-up only. Self-esteem was assessed using the Rosenberg Self - Esteem Scale [25]. The scale includes ten statements with four response op-tions. Total scores range from 0–30 with higher scores reflecting greater self-esteem. The psychometric proper-ties of the Icelandic version have been deemed sufficient [26]. The Depression subscale of the SCL-90 [24] was used to assess symptoms of depression in the preceding week. The ten-item subscale is scored on a five-point Likert scale asking about feelings the last seven days. Life satisfaction was assessed with Dieners’ Satisfaction with Life Scale [27], a five-item scale measuring global cognitive judgment of one’s life satisfaction. Participants indicate on a seven-point scale how much they agree or disagree with each item. Finally, the Multidimensional Scale of Perceived Social Support [28] was used to meas-ure social support. Psychometric evaluations have veri-fied the reliability and validity of the scale among adolescents [29].
Education completion
Statistical analyses
Independent t-tests, chi-square, and tau-c rank correla-tions were used to a) assess gender differences in demo-graphics and covariates at baseline (i.e. parental education, neighborhood characteristics, and psychological factors); and b) examine differences in physical health measures, health-behaviors and socio-demographics at follow-up by educational status, across the whole sample and stratified by gender (i.e. among girls and boys separately).
A logistic regression was conducted to assess the influ-ence of physical health, health-behaviors and covariates at baseline on odds of dropout from secondary educa-tion. Three different hierarchal models were executed in the whole sample, using the stepwise method and con-trolling for different covariates per model. In all models a single independent variable (one physical health or health-behavior measure) was inserted at the 1st step and gender at the 2nd step. The models differed how-ever at the 3rd step, with Model 1 containing no further adjustment, while Model 2 was adjusted for mother’s and father’s education status and neighborhood charac-teristics; and Model 3 adjusted for baseline self-esteem and depression. These models were subsequently re-peated for each covariate (i.e. gender, mother’s higher education, father’s higher education, neighborhood characteristics, self-esteem, and depression) to assess their independent effects. In these models, each co-variate was inserted at the 1st step, with steps 2–3 run as described above except that the relevant covar-iate was excluded from later steps.
Results
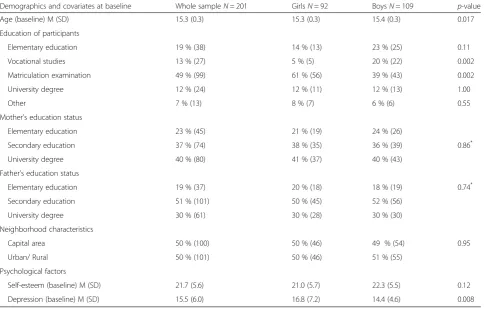
Demographics are presented in Table 1. Participants education status differed by gender (Tau-c (N= 201) =
−0.19, p= 0.01). More boys had completed vocational studies (χ2
(1,201) = 9.333,p= 0.002), while more girls had completed a matriculation examination (χ2
(1,201) = 9.158, p= 0.002). Using the aforementioned definition of secondary education, 78 % of girls (n= 72) and 71 % of boys (n= 78) had completed a secondary education by age 23.
Health differences in young adulthood by education status
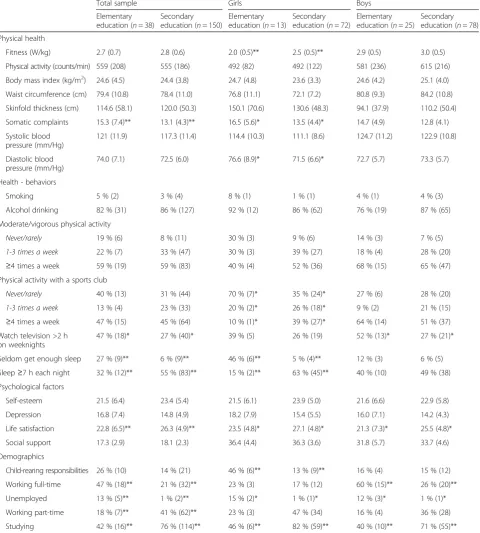
Differences in physical health, health-behaviors, and psy-chological factors at follow-up by education status are presented in Table 2. Across the whole sample, individ-uals who had completed a secondary education reported higher life satisfaction, less somatic complaints, less tele-vision watching, and more sleep. No differences were found in physical health measures. In gender stratified analyses differences in life satisfaction by education remained among both genders, but specific gender differ-ences emerged for physical health measures. That is,
women without a secondary education had lower fitness, more somatic complaints and higher diastolic blood pressure, as well as marginally higher waist-circumference compared with women with a secondary education. No differences were seen in men, aside from a trend towards more somatic complaints (p= 0.07). Regarding health-behaviors, men without a sec-ondary education reported more time spent watching television, while women without a secondary educa-tion reported less sports participaeduca-tion and worse sleep. Notably, 70 % of women with elementary education never/rarely exercised, compared with 35 % of women with a secondary education (p= 0.023). Moreover, 46 % of women with elementary education versus 5 % of women with a secondary education reported seldom getting enough sleep (p< 0.001), with 15 % vs. 63 % of these women (respectively) stating they slept≥7 h each night (p
< 0.002). Elementary educated women were also more likely to have child-raising responsibilities, as 46 % of them reported having children as compared with 13 % of women with a secondary education (p< 0.01). Lastly, oc-cupational status differed by education status across the whole sample, with a higher prevalence of unemployment and working full-time among elementary educated partici-pants, and a higher prevalence of current studying and working part-time among participants with a secondary education.
Influence of adolescents’physical health and health-behaviors on dropout odds
In logistic regression analyses across the sample (see Table 3) somatic complaints, smoking, alcohol drink-ing and time spent watchdrink-ing television were associated with higher odds of dropout, while self-esteem and mothers’ education were associated with lower odds of dropout from secondary education. No association emerged however between objective physical health measures, consisting of fitness, physical activity and body composition measures, and odds of dropout.
factors (OR 2.90, 95 % CI:1.14-7.40). Alcohol drinking was likewise associated with approximately 2.5 higher odds of dropout, independent of gender (2.57, 95 % CI:1.15-5.75) and psychological factors (2.36, 95 % CI:1.03-5.40), but the association lost significance when parental education status and neighborhood characteris-tics was taken into account. Time spent watching televi-sion also emerged as an independent predictor, where a one unit increase in television watching was linked with 1.3 higher odds of dropout in young adulthood across all models (e.g. OR 1.27, 95 % CI:1.03-1.56 in Model 1).
Among covariates, self-esteem was associated with lower odds of dropout at age 23, independent of other co-variates in models 1–3 (e.g. OR 0.91, 95 % CI: 0.85-0.98 for Model 1). Finally, mother’s higher education status at follow-up was also strongly associated with lower dropout odds, independent of gender (OR 0.54, 95 % CI: 0.34-0.88), father’s education and neighborhood characteristics (OR 0.57, 95 % CI: 0.33-0.98), and psychological factors (OR 0.53, 95 % CI: 0.31-0.91). No association was found however with fathers’education and neighborhood char-acteristics (see Table 3).
Discussion
This prospective study spanning eight years reports on the interrelationship between adolescent’s health and educational attainment in young adulthood, focusing on how physical health and health-behaviors of youths affect their odds of dropout from secondary education. A completion of secondary education in young adult-hood was associated with less somatic complaints, more sports participation, less television watching, poorer sleep, higher life satisfaction, and occupational status. This is consistent with the well-established educational/ social gradient in health, where lower education has con-sistently been associated with poor health, including negative health-behaviors, morbidity and mortality [9]. These findings strongly suggest that an educational health gradient does exist in Iceland, but according to a report of the OECD it is only very recently that Icelandic authorities have started acknowledging the existence of health inequalities among its inhabitants [30]. Recent data from Sweden have likewise indicated a presence of social inequalities in mental health of adolescents in a country with small social differences [31]. In the current
Table 1Demographics and covariates at baseline for the whole sample and across gender
Demographics and covariates at baseline Whole sampleN= 201 GirlsN= 92 BoysN= 109 p-value
Age (baseline) M (SD) 15.3 (0.3) 15.3 (0.3) 15.4 (0.3) 0.017
Education of participants
Elementary education 19 % (38) 14 % (13) 23 % (25) 0.11
Vocational studies 13 % (27) 5 % (5) 20 % (22) 0.002
Matriculation examination 49 % (99) 61 % (56) 39 % (43) 0.002
University degree 12 % (24) 12 % (11) 12 % (13) 1.00
Other 7 % (13) 8 % (7) 6 % (6) 0.55
Mother’s education status
Elementary education 23 % (45) 21 % (19) 24 % (26)
Secondary education 37 % (74) 38 % (35) 36 % (39) 0.86*
University degree 40 % (80) 41 % (37) 40 % (43)
Father’s education status
Elementary education 19 % (37) 20 % (18) 18 % (19) 0.74*
Secondary education 51 % (101) 50 % (45) 52 % (56)
University degree 30 % (61) 30 % (28) 30 % (30)
Neighborhood characteristics
Capital area 50 % (100) 50 % (46) 49 % (54) 0.95
Urban/ Rural 50 % (101) 50 % (46) 51 % (55)
Psychological factors
Self-esteem (baseline) M (SD) 21.7 (5.6) 21.0 (5.7) 22.3 (5.5) 0.12
Depression (baseline) M (SD) 15.5 (6.0) 16.8 (7.2) 14.4 (4.6) 0.008
Numbers in the table represent percentage (number of participants) unless other specified Mmean,SDstandard deviation
*
study, girls especially displayed substantial health bene-fits from gaining a secondary education, as compared with boys. Of specific interest were the low fitness, poorer bodily health, higher blood-pressure, lack of
sleep, and more child-rearing responsibilities among women without a secondary education. Perhaps second-ary education is more vital for the well-being of Ice-landic women as they may be less likely than men to be
Table 2Differences in physical health, health - behaviors and psychological factors at follow-up by education status
Total sample Girls Boys
Elementary education (n= 38)
Secondary education (n= 150)
Elementary education (n= 13)
Secondary education (n= 72)
Elementary education (n= 25)
Secondary education (n= 78)
Physical health
Fitness (W/kg) 2.7 (0.7) 2.8 (0.6) 2.0 (0.5)** 2.5 (0.5)** 2.9 (0.5) 3.0 (0.5)
Physical activity (counts/min) 559 (208) 555 (186) 492 (82) 492 (122) 581 (236) 615 (216)
Body mass index (kg/m2) 24.6 (4.5) 24.4 (3.8) 24.7 (4.8) 23.6 (3.3) 24.6 (4.2) 25.1 (4.0)
Waist circumference (cm) 79.4 (10.8) 78.4 (11.0) 76.8 (11.1) 72.1 (7.2) 80.8 (9.3) 84.2 (10.8)
Skinfold thickness (cm) 114.6 (58.1) 120.0 (50.3) 150.1 (70.6) 130.6 (48.3) 94.1 (37.9) 110.2 (50.4)
Somatic complaints 15.3 (7.4)** 13.1 (4.3)** 16.5 (5.6)* 13.5 (4.4)* 14.7 (4.9) 12.8 (4.1)
Systolic blood pressure (mm/Hg)
121 (11.9) 117.3 (11.4) 114.4 (10.3) 111.1 (8.6) 124.7 (11.2) 122.9 (10.8)
Diastolic blood pressure (mm/Hg)
74.0 (7.1) 72.5 (6.0) 76.6 (8.9)* 71.5 (6.6)* 72.7 (5.7) 73.3 (5.7)
Health - behaviors
Smoking 5 % (2) 3 % (4) 8 % (1) 1 % (1) 4 % (1) 4 % (3)
Alcohol drinking 82 % (31) 86 % (127) 92 % (12) 86 % (62) 76 % (19) 87 % (65)
Moderate/vigorous physical activity
Never/rarely 19 % (6) 8 % (11) 30 % (3) 9 % (6) 14 % (3) 7 % (5)
1-3 times a week 22 % (7) 33 % (47) 30 % (3) 39 % (27) 18 % (4) 28 % (20)
≥4 times a week 59 % (19) 59 % (83) 40 % (4) 52 % (36) 68 % (15) 65 % (47)
Physical activity with a sports club
Never/rarely 40 % (13) 31 % (44) 70 % (7)* 35 % (24)* 27 % (6) 28 % (20)
1-3 times a week 13 % (4) 23 % (33) 20 % (2)* 26 % (18)* 9 % (2) 21 % (15)
≥4 times a week 47 % (15) 45 % (64) 10 % (1)* 39 % (27)* 64 % (14) 51 % (37)
Watch television >2 h on weeknights
47 % (18)* 27 % (40)* 39 % (5) 26 % (19) 52 % (13)* 27 % (21)*
Seldom get enough sleep 27 % (9)** 6 % (9)** 46 % (6)** 5 % (4)** 12 % (3) 6 % (5)
Sleep≥7 h each night 32 % (12)** 55 % (83)** 15 % (2)** 63 % (45)** 40 % (10) 49 % (38)
Psychological factors
Self-esteem 21.5 (6.4) 23.4 (5.4) 21.5 (6.1) 23.9 (5.0) 21.6 (6.6) 22.9 (5.8)
Depression 16.8 (7.4) 14.8 (4.9) 18.2 (7.9) 15.4 (5.5) 16.0 (7.1) 14.2 (4.3)
Life satisfaction 22.8 (6.5)** 26.3 (4.9)** 23.5 (4.8)* 27.1 (4.8)* 21.3 (7.3)* 25.5 (4.8)*
Social support 17.3 (2.9) 18.1 (2.3) 36.4 (4.4) 36.3 (3.6) 31.8 (5.7) 33.7 (4.6)
Demographics
Child-rearing responsibilities 26 % (10) 14 % (21) 46 % (6)** 13 % (9)** 16 % (4) 15 % (12)
Working full-time 47 % (18)** 21 % (32)** 23 % (3) 17 % (12) 60 % (15)** 26 % (20)**
Unemployed 13 % (5)** 1 % (2)** 15 % (2)* 1 % (1)* 12 % (3)* 1 % (1)*
Working part-time 18 % (7)** 41 % (62)** 23 % (3) 47 % (34) 16 % (4) 36 % (28)
Studying 42 % (16)** 76 % (114)** 46 % (6)** 82 % (59)** 40 % (10)** 71 % (55)**
Numbers in the table represent: Mean (Standard Deviation) for continuous variables (all Physical health and Psychological factors variables) and % (number of participants) for categorical variables (all Health -behavior and Demographic variables)
able to secure a well-paying job without an educational degree. Moreover, it can be hypothesized that getting pregnant at a young age may hinder these women in completing their secondary education, and that more support is needed for young mothers in Iceland.
Regarding the prognostic importance of physical health for education outcomes, somatic complaints, negative health - behaviors, self-esteem and mothers education status emerged as significant risk factors for dropout from secondary education. Somatic complaints were linked with higher odds of dropout from secondary education, independent of both psychological factors and the socioeconomic status of students. This concurs with recent large scale studies which have linked self-reported poor health with lower odds of completing high school independent of socioeconomic status [8, 32]. No association emerged however between objective mea-sures of physical activity or fitness with dropout, con-trary to a large longitudinal study which found a relationship between academic achievement and object-ive measures of physical activity [33]. This may be due
to lower power based on the smaller sample in the current study. Among health-behaviors, smoking and more television watching predicted higher odds of drop-out from secondary education regardless of all covari-ates, while alcohol drinking predicted dropout independent of gender and psychological factors, but not when parental education was taken into account. Ac-cording to this, parental influences may reduce the ef-fects of adolescent drinking on lower educational attainment, but review findings have suggested that negative health-behaviors have a more complex relation-ship with academic achievement, and may be mediated by socioeconomic status and psychosocial problems [34]. In-deed, data from Norway, Sweden, Denmark, Finland, and the United Kingdom have found social inequalities in daily smoking among adolescents, and that this association was partially mediated by academic achievement [35].
Importantly, mother’s higher education emerged as a protective factor against dropout, but no association was found with father’s education or neighborhood charac-teristics. It is well established that parental education
Table 3Association of physical health, health-behaviors and covariates with dropout odds from secondary education
Model 1a Model 2b Model 3c
Adjusted for gender Adjusted for gender, parental education and neighborhood characteristics
Adjusted for gender and psychological factors
Baseline measures N OR (95 % CI) N OR (95 % CI) N OR (95 % CI)
Physical health
Fitness (W/kg) 114 0.68 (0.33-1.41) 110 0.55 (0.25-1.19) 107 0.84 (0.34-2.09)
Physical activity (counts/min) 80 1.00 (1.00-1.00) 77 1.00 (0.99-1.00) 76 1.00 (1.00-1.00)
Body mass index (kg/m2) 188 1.05 (0.93-1.18) 184 1.07 (0.94-1.20) 172 1.10 (0.94-1.27)
Waist circumference (cm) 188 1.02 (0.98-1.06) 184 1.03 (0.98-1.07) 172 1.03 (0.97-1.08)
Skinfold thickness (mm) 188 1.01 (0.99-1.02) 184 1.01 (0.99-1.02) 172 1.00 (0.99-1.02)
Somatic complaints 170 1.09 (1.02-1.18)* 167 1.09 (1.01-1.18)* 168 1.10 (1.00-1.20)*
Health - behaviors
Smoking 173 3.67 (1.50-9.00)** 170 3.64 (1.42-9.33)** 171 2.90 (1.14-7.40)*
Alcohol drinking 163 2.57 (1.15-5.75)* 160 2.14 (0.93-4.93) 161 2.36 (1.03-5.40)*
Time spent watching television 173 1.27 (1.03-1.56)* 170 1.28 (1.03-1.60)* 171 1.25 (1.01-1.55)*
Frequency of sports participation 173 0.84 (0.54-1.30) 170 0.82 (0.52-1.30) 171 0.94 (0.59-1.49)
Frequency of moderate/vigorous physical activity 173 0.74 (0.42-1.92) 170 0.81 (0.46-1.45) 171 0.87 (0.49-1.57)
Covariates
Gender (female) 188 1.78 (0.85-3.73) 184 1.51 (0.70-3.27) 172 2.42 (1.02-5.75)*
Mothers higher education 186 0.54 (0.34-0.88)* 184 0.57 (0.33-0.98)*d 170 0.53 (0.31-0.91)*
Fathers higher education 186 0.70 (0.42-1.19) 184 0.86 (0.47-1.58)e 171 0.78 (0.43-1.39)
Neighborhood characteristics (rural/urban) 188 1.10 (0.54-2.26) 184 0.80 (0.37-1.74)f 172 1.15 (0.52-2.56)
Self-esteem 174 0.91 (0.85-0.98)* 171 0.90 (0.84-0.97)** 172 0.92 (0.85-0.99)*g
Depression 172 1.06 (0.99-1.13) 169 1.06 (1.00-1.14) 172 1.02 (0.95-1.10)h
*p< 0.05; **p< 0.01.a
Model adjusted for gender;b
Model adjusted for gender, parental education and neighborhood characteristics ;c
Model adjusted for gender, self-esteem and depression;d
Only adjusted for fathers education status and neighborhood characteristics;e
Only adjusted for mothers education status and neigh-borhood characteristics;
f
Only adjusted for mothers and fathers education status;g
Only adjusted for depression at age 15;h
denotes socio-economic status and is an important pre-dictor of children’s educational outcomes [14]. Contrary to these findings, the Icelandic Ministry of Education, Science and Culture has recently claimed that socio-economic status has a relatively little impact on the edu-cation achievement of Icelandic students [5]. A higher level of parental education is thought to contribute to better academic achievement via a more supportive home learning environment, encouragement for higher achievement and psychological support [36]. It is unclear why no association was found with fathers’higher edu-cation, but very few studies have investigated the indi-vidual contribution of mothers and fathers on the educational outcomes of their children [37]. One Ameri-can study has though marked fathers education as more important for boys advancement to higher education, as compared with girls [38]. It may be that the supporting role provided by educated mothers is more vital for the educational attainment of Icelandic students. The unex-pected lack of association between neighborhood charac-teristics and dropout risk possibly results from low power due to the relatively low number of participants in the current study. Published numbers from the Statis-tics Iceland for all students starting secondary school in Iceland in the year 2004 indicate that 25 % of students living in the Reykjavik capital area dropout from second-ary education within four years compared with 32 % of students living in urban or rural areas. Likewise, based on their numbers around 49 % of students in the capital area complete their secondary education within the allo-cated four years compared with 37 % of students living in the countryside [39]. Yet, a report from the OECD states that the socio-economic background of Icelandic students has less of an effect on their academic achieve-ment compared to other OECD countries [4]. Hence, it seems that Icelandic authorities and further research projects need to ascertain to what extent socio-economic inequalities in health and education exist within the Icelandic society.
The strength of this study resides in the longitudinal design, objective measures of physical health, and taking into account the effects of psychological and socio-economic status. The main limitations of the current study include the presence of some participant dropout from baseline to follow-up, which may increase risk of selection bias. Of note, non-responders may represent a group with higher dropout rates from secondary educa-tion, and this possible selection bias might thus yield at-tenuated associations in the study findings [8]. Secondly, objective measures of fitness and physical activity were only conducted among half of the sample at baseline, which reduces statistical power for analyses including those variables. Finally, measurements of education com-pletion were based on self-report, limiting the robustness of the measurements.
Conclusions
This study yields important information regarding di-verse health-benefits associated with obtaining a second-ary education degree in a European country, and how physical health and health-behaviors of adolescents affect their likelihood of gaining such a degree. The find-ings suggest that somatic complaints and negative health-behaviors among adolescents increase their chances of dropout from secondary education, and that securing a secondary education degree yields numerous health-benefits, specifically among women. The potential path-ways behind this association are believed to range across many health factors. Poor health in adolescents may for in-stance lead to lower levels of schooling by means of more days missed at school [40], and lower capability to learn in school [32]. Of specific concern in this regard are the lower levels of fitness and physical activity seen among ad-olescents today [41], which can result in poorer health sta-tus accompanied by more somatic complaints, headaches, and bodily discomfort, that can impede students capacity and productivity in school. In line with this are study find-ings which have linked migraine headaches with lower educational attainment [42] and frequent primary care visits with more days absent from school [43] and higher odds of dropout [40]. Accordingly, it seems poor physical health during adolescence can have wide - ranging conse-quences for the future prospects of youths [32]. Leading educational organizations and policy makers in the United States are increasingly recognizing the important role schools play for addressing health issues among youths [44], and this view should be incorporated into public health policies worldwide.
Abbreviations
BMI:Body mass index; OECD: Organization for Economic Co-operation and Development; OR: Odds ratio; SCL-90: Symptom checklist 90.
Competing interest
The author(s) declare that they have no conflict of interest.
Authors’contributions
ES designed the overall concept of the manuscript, conducted statistical analyses and interpretation of data, and wrote the first draft of the manuscript. SAA and TS participated in the design of the study and conducted data acquisition, as well as providing feedback and revision of the manuscript for important intellectual content. EJ was involved in designing the concept of the manuscript, planning analyses and drafting of the manuscript. All authors have given their final approval of the manuscript, and agree to be accountable for all aspects of accuracy and integrity of the work. No author received honorarium, grant, of other form of payment to produce the manuscript.
Acknowledgements
Author details 1
School of Education, University of Iceland, Stakkahlíð, 105 Reykjavík, Iceland.
2Center for Sport and Health Sciences, University of Iceland, Lindarbraut 4,
840 Laugarvatn, Iceland.3Research Centre of Movement Science, School of Health Sciences, University of Iceland, Stapi v/Hringbraut, 101 Reykjavík, Iceland.4Landspitali-University Hospital, Eiríksgötu 5, 101, Reykjavík, Iceland.
Received: 19 January 2015 Accepted: 12 November 2015
References
1. UNESCO. Chapter 5: Secondary education - paving the way to work. Youth and skills: Putting Education to Work. In: EFA Global Monitoring Report. Paris: UNESCO; 2012. p. 226–53.
2. Tyler JH, Lofstrom M. Finishing high school: alternative pathways and dropout recovery. Future Child. 2009;19(1):77–103.
3. Blondal KS, Jonasson JT, Tannhauser AC. Dropout in a small society: is the Icelandic case somehow different? In: Lamb S, Markussen E, Teese R, Sandberg N, Polesel J, editors. School Dropout and Completion: International Comparative Studies in Theory and Policy. London: Springer; 2011. p. 233–51.
4. OECD. Towards a strategy to prevent dropout in Iceland, Preventing dropout in upper secondary schools in Iceland. 2012. http://www.oecd.org/ iceland/49451462.pdf. Accessed 7 march 2014.
5. Ministry of Education Science and Culture. [White book about reforms in education]. 2014. http://www.menntamalaraduneyti.is/media/frettir/Hvitbik_ Umbaetur_i_menntun.pdf. Accessed 3 Nov 2014.
6. Birgisdóttir K. [Drop-out in secondary education: Spring 2013]. 2013. Ministry of Education, Science and Culture. http://brunnur.stjr.is/mrn/utgafuskra/ utgafa.nsf/xsp/.ibmmodres/domino/OpenAttachment/mrn/utgafuskra/ utgafa.nsf/B249B4FD1491ED2700257C22004C69A5/Attachment/brotthv_ frsk_2013.pdf Assessed 19 Aug 2014.
7. Winding TN, Nohr EA, Labriola M, Biering K, Andersen JH. Personal predictors of educational attainment after compulsory school: influence of measures of vulnerability, health, and school performance. Scand J Public Health. 2013;41(1):92–101. doi:10.1177/1403494812467713.
8. De Ridder KA, Pape K, Johnsen R, Holmen TL, Westin S, Bjorngaard JH. Adolescent health and high school dropout: a prospective cohort study of 9000 Norwegian adolescents (the young-HUNT). PLoS One. 2013;8(9): e74954. doi:10.1371/journal.pone.0074954.
9. Mackenbach JP, Stirbu I, Roskam A-JR, Schaap MM, Menvielle G, Leinsalu M, et al. Socioeconomic inequalities in health in 22 European Countries. N England J Med. 2008;358(23):2468–81. doi:10.1056/NEJMsa0707519. 10. Suhrcke M, de Paz Nieves C. The impact of health and health behaviors on
educational outcomes in high-income countries: A review of the evidence. Copenhagen, WHO Regional Office for Europe; 2011
11. Ansari WE, Stock C. Is the health and wellbeing of university studetns associated with their academic performance? Cross sectional findings from the United Kingdom. Int J Environ Res Public Health. 2010;7:509–27. 12. Cutler DM, Lleras-Muney A. Education and health: evaluating theories and
evidence. In: Schoeni RF, House JS, Kaplan GA, Pollack H, editors. Making Americans Healthier: Social and Economic Polisy as Health Policy. New York: Russel Sage Foundation; 2008.
13. Koivusilta LK, Nupponen H, Rimpelä AH. Adolescent physical activity predicts high education and socio-economic position in adulthood. Eur J Public Health. 2011;22(2):203–9. doi:10.1093/eurpub/ckr037.
14. Dubow EF, Boxer P, Huesmann LR. Long-term Effects of Parents’Education on Children’s Educational and Occupational Success: Mediation by Family Interactions, Child Aggression, and Teenage Aspirations. Merrill Palmer Q (Wayne State Univ Press). 2009;55(3):224–49. doi:10.1353/mpq.0.0030. 15. Halldórsson M, Cavelaars AEJM, Kunst AE, Mackenbach JP. Socioeconomic
differences in health and well-being of children and adolescents in Iceland. Scand J Public Health. 1999;27(1):43–7. doi:10.1177/14034948990270011501. 16. Nielsen L, Damsgaard MT, Meilstrup C, Due P, Madsen KR, Koushede V, et al.
Socioeconomic differences in emotional symptoms among adolescents in the Nordic countries: Recommendations on how to present inequality. Scand J Public Health. 2015;43(1):83–90. doi:10.1177/1403494814557885. 17. Bernburg JG, Thorlindsson T, Sigfusdottir ID. The neighborhood effects of
disrupted family processes on adolescent substance use. Soc Sci Med. 2009; 69(1):129–37. http://dx.doi.org/10.1016/j.socscimed.2009.04.025.
18. Ministry of Education Science and Culture. The Educational System of Iceland. Reykjavik: Ministry of Education Science and Culture; 2002. 19. Riddoch CJ, Bo Andersen L, Wedderkopp N, Harro M, Klasson-Heggebø L,
Sardinha LB, et al. Physical activity levels and patterns of 9- and 15-yr-old European children. Med Sci Sports Exerc. 2004;36(1):86–92.
20. Arngrimsson SA, Sveinsson T, Johannsson E. Peak oxygen uptake in children: evaluation of an older prediction method and development of a new one. Pediatr Exerc Sci. 2008;20(1):62–73.
21. Wedderkopp N, Froberg K, Hansen HS, Andersen LB. Secular trends in physical fitness and obesity in Danish 9-year-old girls and boys: Odense School Child Study and Danish substudy of the European Youth Heart Study. Scand J Med Sci Sports. 2004;14(3):150–5. doi:10.1046/j.1600-0838. 2003.00365.x.
22. Ekelund U, Anderssen SA, Froberg K, Sardinha LB, Andersen LB, Brage S. Independent associations of physical activity and cardiorespiratory fitness with metabolic risk factors in children: the European youth heart study. Diabetologia. 2007;50(9):1832–40. doi:10.1007/s00125-007-0762-5. 23. Ekelund U, Sjostrom M, Yngve A, Poortvliet E, Nilsson A, Froberg K, et al.
Physical activity assessed by activity monitor and doubly labeled water in children. Med Sci Sports Exerc. 2001;33(2):275–81.
24. Derogatis LR, Lipman RS, Rickels K, Uhlenhuth EH, Covi L. The Hopkins Symptom Checklist (HSCL): a self-report symptom inventory. Behav Sci. 1974;19(1):1–15. 25. Rosenberg M. Society and the Adolescent Self-image. Princeton, N.J.:
Princeton University Press; 1965.
26. Sigurjónsdóttir ED. Psychometric Properties of the Icelandic version of the Rosenberg Self-Esteem Scale. Reykjavík: University of Iceland; 2012. 27. Diener E, Emmons RA, Larsen RJ, Griffin S. The satisfaction with life scale.
J Pers Assess. 1985;49(1):71–5. doi:10.1207/s15327752jpa4901_13. 28. Zimet GD, Dahlem NW, Zimet SG, Farley GK. The multidimensional scale of
perceived social support. J Pers Assess. 1988;52(1):30–41.
29. Zimet GD, Powell SS, Farley GK, Werkman S, Berkoff KA. Psychometric characteristics of the multidimensional scale of perceived social support. J Pers Assess. 1990;55(3–4):610–7. doi:10.1080/00223891.1990.9674095. 30. European-Union. Health inequalities in the EU: Final report of a consortium.
Consortium lead: Sir Michael Marmot. 2013. http://www.thehealthwell.info/ node/681223: Assessed 29 september 2014.
31. Wirback T, Moller J, Larsson J-O, Galanti M, Engstrom K. Social factors in childhood and risk of depressive symptoms among adolescents - a longitudinal study in Stockholm, Sweden. Int J Equity Health. 2014;13(1):96. 32. Jackson MI. Understanding links between adolescent health ad educational
attainment. Demography. 2009;46(4):671–94.
33. Booth JN, Leary SD, Joinson C, Ness AR, Tomporowski PD, Boyle JM, et al. Associations between objectively measured physical activity and academic attainment in adolescents from a UK cohort. Br J Sports Med. 2014;48(3): 265–70. doi:10.1136/bjsports-2013-092334.
34. Busch V, Loyen A, Lodder M, Schrijvers AJP, van Yperen TA, de Leeuw JRJ. The effects of adolescent health-related behavior on academic performance: a systematic review of the longitudinal evidence. Rev Educ Res. 2014;84(2):245–74. doi:10.3102/0034654313518441.
35. Schnohr C, Kreiner S, Rasmussen M, Due P, Diderichsen F. School-related mediators in social inequalities in smoking: a comparative cross-sectional study of 20,399 adolescents. Int J Equity Health. 2009;8(1):17.
36. Kantomaa MT, Tammelin TH, Demakakos P, Ebeling HE, Taanila AM. Physical activity, emotional and behavioural problems, maternal education and self-reported educational performance of adolescents. Health Educ Res. 2009;25(2):368–79. doi:10.1093/her/cyp048.
37. Flouri E, Buchanan A. Early father’s and mother’s involvement and child’s later educational outcomes. Brit J Educ Psychol. 2004;74(2):141–53. 38. Buchmann C, DiPrete TA. The growing female advantage in college
completion: the role of family background and academic achievement. Am Sociol Rev. 2006;71(4):515–41. doi:10.1177/000312240607100401. 39. Statistics_Iceland. More dropout at the upper secondary level outside of the
capital region. 2014. http://www.hagstofa.is/en/publications/newsarchive/ education/more-dropout-at-the-upper-secondary-level-outside-of-the-capital-region/. Accessed November 19, 2015.
40. Homlong L, Rosvold EO, Haavet OR. Can use of healthcare services among 15– 16-year-olds predict an increased level of high school dropout? A longitudinal community study. BMJ Open. 2013. 3(9). doi:10.1136/bmjopen-2013-003125. 41. Dumith SC, Gigante DP, Domingues MR, Kohl HW. Physical activity change
42. Rees DI, Sabia JJ. The effect of migraine headache on educational attainment. J Hum Resour. 2011;46(2):317–32.
43. Vila M, Kramer T, Obiols J, Garralda ME. Adolescents who are frequent attenders to primary care: contribution of psychosocial factors. Soc Psych Psych Epid. 2012;47(2):323–9. doi:10.1007/s00127-010-0326-8.
44. Basch CE. Healthier students are better learners: a missing link in school reforms to close the achievement gap. J School Health. 2011;81(10):593–8. doi:10.1111/j.1746-1561.2011.00632.x.
Submit your next manuscript to BioMed Central and take full advantage of:
• Convenient online submission
• Thorough peer review
• No space constraints or color figure charges
• Immediate publication on acceptance
• Inclusion in PubMed, CAS, Scopus and Google Scholar
• Research which is freely available for redistribution