Background: Early identification of severe acute pancreatitis is important for early stratification, goal directed fluid
therapy, rationalizing level of care to improve outcome. Various clinical, laboratory and imaging scoring system has
been used to identify severe acute pancreatitis with variable results. Recently a decision tree model was proposed using
serum creatinine, serum lactate dehydrogenase and oxygenation index to predict severe acute pancreatitis. This system
is easy and usable at our centre. Hence, we conducted the study to validate the decision tree model prospectively.
Methods: Patients admitted with a diagnosis of acute pancreatitis were included in the study. Decision tree model was
used to identify patients at high and low risk for severe acute pancreatitis. Sensitivity and specificity were calculated
for prediction of the decision tree model.
Results: Fifty-three patients were included in the study. Fourty-one (77.4 %) patients with mild acute pancreatitis,
five (9.4 %) patients had moderately severe pancreatitis and seven (13.2 %) patients had severe acute pancreatitis.
Sensitivity and specificity of decision tree model to predict severity of pancreatitis was 97.83%(95 % CI – 88.47% to
99.94%) and 71.43 % % (95 % CI – 29.04% to 96.33%) respectively with positive and negative predictable value of
95.74 % % (95 % CI – 87.45% to 98.64%) and 83.33 % % (95 % CI – 40.49% to 97.35%) respectively.
Conclusions: Decision tree model with serum creatinine, lactate dehydrogenase, and oxygenation index is an easy
and useful tool to predict patients at high risk of developing severe acute pancreatitis.
Keywords: Acute pancreatitis; decision tree; severe acute pancreatitis.
Prospective Validation of a Decision Tree Model for
Prediction of Severity in Acute Pancreatitis
Tanka Prasad Bohara,1 Uttam Laudari,1 Anuj Parajuli,1 Shail Rupakheti,1 Mukund Raj Joshi1 1Kathmandu Medical College Teaching Hospital, Sinamangal, Kathmandu, Nepal.
Correspondence:
Dr Tanka Prasad Bohara, Kathmandu Medical College Teaching
Hospital, Sinamangal, Kathmandu, Nepal. Email: [email protected],
Phone: +9779841352378.
ABSTRACT
J Nepal Health Res Counc 2018 Apr-Jun;16(39): 239-44
INTRODUCTION
Acute pancreatitis (AP) is an inflammation of pancreatic
and peripancreatic tissue.1 AP is usually mild and self-limiting. About 25 % of patients develop severe disease with local and systemic complications in whom mortality may reach up to 30 %. 2–4 Early identification of the patient at risk of severe acute pancreatitis(SAP) helps to provide individualized care.
The search for an ideal method for early identification of
SAP is continued. Several clinical, biochemical, imaging scores and single parameters have been evaluated with variable results.2,5–10
Recently a decision tree model comprising of serum creatinine, serum lactate dehydrogenase and oxygenation index has been proposed in a retrospective study and has suggested prospective and broader validation.11 This tool seems useful and feasible to use in our setup. Hence, we conducted a study to validate the decision tree model to predict the severity of AP in a prospective study.
METHODS
Patients admitted in Department of Surgery Kathmandu Medical College Teaching Hospital from June 2016 to May 2017 with a diagnosis of AP were included in the study. Patients less than 18 years of age, patients with chronic kidney disease, cardiac failure and respiratory dysfunction and patients referred from other centers in whom the serum creatinine, serum lactate dehydrogenase and oxygenation index at admission were not available were excluded.
AP was diagnosed based on revised Atlanta Classification
if two of the following three features were present (a) abdominal pain consistent with AP; (b) serum amylase (or lipase) more than three times normal value; (c)
characteristic findings of AP on abdominal ultrasound,
contrast enhanced computed tomography (CECT) abdomen or magnetic resonance imaging (MRI).12
Patients demographic data, history, physical examination
findings, biochemical investigations (liver function
DOI: http://dx.doi.org/10.3126/ jnhrc.v16i2.20318
Original
tests, renal function test) and findings of chest x-ray,
abdominal ultrasound, contrast enhanced computerized tomography (CECT) abdomen (if done) and magnetic resonance imaging (MRI) of the abdomen (if done) were noted in a case sheet. Presence or absence of organ
failure based on Modified Marshall scoring system for organ dysfunction and systemic inflammatory response
syndrome were noted. Arterial blood gas (ABG) analysis was done only when the patients had any sign of respiratory failures, such as the respiratory rate (RR) of more than 26 breaths per minute and the oxygen
saturation (SpO2) detected in the finger less than 90%.
Oxygenation index (OI) was calculated by dividing partial pressure of oxygen in arterial blood with a fraction of inspired oxygen (PaO2/FiO2). For patients without above signs of respiratory failure, OI was considered more than 289.
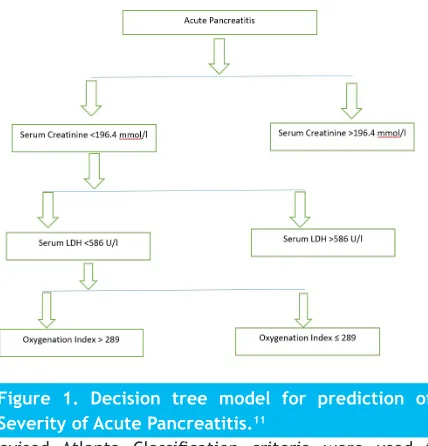
Decision tree model proposed by Yang et al was used
to identify the high-risk patients for the development of SAP (Fig. 1). Patients were categorized into high risk group when serum creatinine > 196.4 µmol/l or serum
creatinine <196.4 µmol/l and serum LDH > 536 U/l or serum creatinine < 196.4 µmol/l, serum LDH < 536 U/l and
OI < 289. Patients with serum creatinine < 196.4 µmol/l,
serum LDH < 536 U/l and OI > 289 will be categorized
as low risk for development of SAP. These investigations were obtained within 12 hours of admission.
Figure 1. Decision tree model for prediction of Severity of Acute Pancreatitis.11
Revised Atlanta Classification criteria were used to
classify mild acute pancreatitis (MAP), moderately severe acute pancreatitis (MSAP) and severe acute pancreatitis (SAP). Patients without organ failure and
local complications were classified as MAP. Patients with
transient organ failure (less than 48 hours) or with local
complications were classified as MSAP and patients with
organ failure persisting beyond 48 hours were classified
as SAP.
Continuous variables were reported as mean ± SD where
as categorical variables were reported as absolute or relative frequencies. Krusal Wallis test was used to analyze continuous variables because of non-parametric distribution of data. Chi square test or Fischer exact test were used for categorical variables whichever was appropriate. p value of < 0.05 was considered
statistically significant. SPSS version 20 was used for analysis of data. The sensitivity, specificity, positive
and negative predictive value of the decision tree model to predict development SAP among the high-risk group and predict non-severe pancreatitis in low-risk group was calculated. For calculation of sensitivity and
specificity, MAP and MSAP were combined into a
non-severe pancreatitis group and compared with SAP group.
Sensitivity and specificity were calculated for prediction
of severe and non-severe pancreatitis using two by two tables. Receiver operating characteristics (ROC) curve was plotted for prediction of SAP using decision tree model.
Ethical clearance was taken from the Research and Ethics committee of Kathmandu Medical College Teaching Hospital, Sinamangal, Kathmandu, Nepal. Informed consent was taken from the patients.
RESULTS
Sixty patients were admitted with a diagnosis of AP during the study period. Seven patients were excluded from the study. Fifty-three patients were enrolled in the study. Mean age was 43.47 years (Range - 18 -79 years). There were 35 males (66 %) and 18 females (34
%). There were 41 (77.4 %) patients with MAP, five (9.4 %)
patients with MSAP and seven (13.2 %) patients with SAP. One patient died within 24 hours of admission and was included in SAP group although persistent organ failure (for > 48 hours) could not be observed.
Table 1 shows baseline characteristics of the patients in MAP, MSAP and SAP group. The difference was statistically
significant in pulse rate at admission, temperature,
oxygen saturation, SIRS score, platelet count, direct bilirubin, lactate dehydrogenase, serum amylase and serum urea.
Table 2 shows length of intensive care unit (ICU), surgical high care unit (SHCU) and hospital stay of patients in
MAP, MSAP and SAP group. All parameters were more in MSAP and SAP than MAP group and it was statistically
Table 1. Baseline characteristics of patients in MAP, MSAP and SAP group.
Classification of Severity based on Revised Atlanta Classification
Variables PancreatitisMild Acute Moderately Severe Acute Pancreatitis Severe Acute Pancreatitis
P value*
Age (in years) 43.93 ± 15.115 43.80 ± 6.017 40.57 ± 14.386 0.908
Interval Between onset of symptoms and admission (in
hours) 47.10 ± 55.078 79.00 ± 59.523 66.86 ± 55.078 0.138
Pulse rate 90.10 ± 16.463 109.40 ± 18.995 120.75 ± 28.371 0.006
Systolic blood pressure (in mm
of Hg) 124.66 ± 24.058 122.00 ± 30.332 118.57 ± 24.785 0.510
Diastolic blood pressure (in
mm of Hg) 80.49 ± 12.031 80.00 ± 20.000 75.71 ± 17.182 0.770
Respiratory Rate 20.34 ± 2.565 20.00 ± 2.000 25.14 ± 8.552 0.118
Temperature (in Fahrenheit) 98.053 ± 0.990 99.06 ± 1.131 98.90 ±1.550 0.031 Oxygen Saturation (in
percentage) 96.20 ± 4.045 96.40 ± 1.140 90.43 ± 6.876 0.012
SIRS Score 1.20 ± 0.813 2.00 ± 0.707 2.43 ± 0.787 0.002
Haemoglobin (in gram %) 17.67 ± 20.337 12.26 ± 2.261 14.685 ± 2.551 0.125 White Blood Cells Count (per
cu. mm.) 14819.51 ± 5867.164 15060.00 ± 5205.574 14028.57 ± 5579.341 0.800 Platelets (per cu. mm) 248195.12 ± 82089.652 358200.00 ± 202909.004 162428.57 ± 36650.862 0.014 Random blood sugar (mg/dl) 133.22 ± 62.279 122.00 ± 59.245 125.29 ± 37.353 0.586 Total Bilirubin (mg/dl) 2.11 ± 1.789 1.20 ± 0.60415 3.53 ± 3.573 0.140 Direct Bilirubin (mg/dl) 1.12 ± 1.123 0.340 ± 0.260 2.37 ± 2.774 0.021
Aspartate Transaminase (U/L) 109.15 ± 112.965 46.00 ± 33.496 149.00 ± 208.207 0.289
Alanine Transaminase (U/L) 120.27 ± 115.254 53.80 ± 37.171 185.14 ± 103.296 0.299
Alkaline Phosphatase (U/L) 350.29 ± 256.923 337.80 ± 398.825 185.14 ± 103.296 0.179
Lactate Dehydrogenase (U/L) 332.51 ± 112.131 411.40 ± 171.572 538.86 ± 184.867 0.015
Serum Amylase (U/L) 1131.00 ± 1049.257 259.80 ± 195.999 2245.43 ± 4532 0.084
Urea (mg/dl) 26.7317 ± 9.162 29.20 ± 2.774 72.428 ± 70.604 0.007 Serum Creatinine (mg/dl) 0.770 ± 0.170 0.820 ± 0.238 1.928 ± 2.856 0.183 *Krusal Wallis Test
Table 2. Length of ICU, SHCU and hospital stay of patients in MAP, MSAP and SAP group.
Classification of Severity based on Revised Atlanta Classification
Variables PancreatitisMild Acute Moderately Severe Acute Pancreatitis Severe Acute Pancreatitis
P value
Length of ICU stay (in days) 0 1.00 ± 2.236 5.57 ± 4.614 <0.001
Length of SHCU stay (in days) 1.68 ± 1.350 5.60 ± 5.367 4.43 ± 4.894 0.001 Length of Hospital stay (in days) 5.44 ± 3.178 12.20 ± 11.122 14.86 ± 6.858 <0.001 Table 3. Comparison of prediction of severity based on decision tree model and diagnosis based on Revised Atlanta Classification.
Prediction based on decision tree model
Diagnosis based on Revised Atlanta Classification
Non-Severe Pancreatitis (MAP + MSAP) Frequency (Percentage within row)
Severe Acute Pancreatitis Frequency (Percentage within
row) Total Non-Severe Pancreatitis
(MAP + MSAP) 45 (95.74 %) 2 (4.26 %) 47(100 %)
Severe Acute Pancreatitis 1 (16.67 %) 5 (83.33 %) 6 (100 %)
Most common etiology was biliary, seen in 28 (45.3 %) patients, followed by alcohol in 22 (41.5 %). Three (5.7%) patients had idiopathic pancreatitis. Among patients with biliary pancreatitis, one patient had a choledochal cyst, one patient had a history of open cholecystectomy and choledochoduodonostmy and two patients had pancreatitis following cholecystectomy.
Based on the decision tree model 47 patients were predicted to be in a low risk group and to have a severe course. Among them, 45(95.74%) had a non-severe course. Among six patients predicted as high
risk for SAP, five (83.33%) had SAP, as shown in Table
3. Considering decision tree model as diagnostic test, decision tree model had sensitivity of 97.83%(95 % CI –
88.47% to 99.94%), specificity of 71.43 % % (95 % CI –
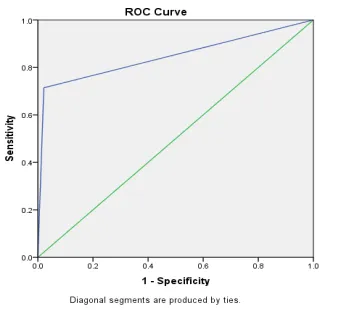
29.04% to 96.33%) with positive and negative predictable value of 95.74 % % (95 % CI – 87.45% to 98.64%) and 83.33 % % (95 % CI – 40.49% to 97.35%) respectively. Figure 2 shows receiver operating characteristic curve (ROC) for prediction of severity of acute pancreatitis based on the decision tree model. The area under the curve was 0.846, p value 0.003 with 95% CI -0.641 to 1.00.
Figure 2. Receiver operating characteristic curve for prediction of severity based on decision tree model.
There was one mortality among the study group. Two patients required endoscopic retrograde cholangiopancreatography(ERCP) and stone clearance in index admission. One patient required ultrasound guided percutaneous intervention. Two patients were readmitted within a month for pain abdomen out of which one belonged to MAP group and other to MSAP group.
DISCUSSION
AP is an acute inflammation of pancreas with both local
and systemic complications. It may present as mild
self-limiting disease to a fulminant condition. Patients with a mild form of the disease usually improve in a few days with supportive treatment. However, patients with severe form of the disease are at risk of developing life-threatening complications. In about 25 % of the patient severe form of the disease is seen with local and systemic complications in whom mortality is seen in up to 30 %.2,3,10
Revised Atlanta classification has classified AP into MAP,
MSAP and SAP.12 MAP only requires supportive treatment and observation for few days. MSAP requires goal directed
fluid resuscitation, may require fasting, better and close
monitoring to see whether the organ failure is transient or persists beyond 48 hours.1 SAP is classified if the organ failure persists beyond 48 hours.12 However, the patients with SAP are the one who actually requires intensive
care, aggressive fluid resuscitation, and close monitoring or transfer to a tertiary care center. Early identification
of patients at risk of developing a severe form of the disease is very important. Early identification allows
triage of the patients and sorting patients requiring high care and intensive care treatment. Rationalization of the level of care is very important in our context because
of limited resources. Early identification allows early aggressive treatment such as goal directed fluid therapy
which restores intravascular volume and improves peripheral circulation which prevents tissue hypoxia and further complications.1,13 Early identification also allows proper counseling of the patients and their relatives regarding the possible prognosis and hospital course.
The importance of early identification of the patient at risk of severe disease is well known but early
identification of the patient at risk of SAP is difficult.
Till now no gold standard parameter or scoring system has been developed. A number of researches have been done for decades to identify the simple, fast, reproducible, easily available and cost-effective parameter or a scoring system. There are several clinical, biochemical and imaging systems and scores to predict the severity of AP. Most commonly used methods are Ranson’s criteria, Acute Physiology and chronic health evaluation (APACHE II), Bedside index for severity in acute pancreatitis (BISAP), Computerized Tomography (CT) criteria, Japanese severity score.2,5–9 Disadvantages of these methods are that the parameters included in these scoring systems are not available at all centers and some take at least 24 to 48 hours for calculation. Single parameters such as haematocrit, C- Reactive Protein,
Interleukin, Blood urea nitrogen (BUN) have also been
evaluated with varying results.10
of serum creatinine, serum lactate dehydrogenase and
oxygenation index has been proposed by Yang et al (figure 1) in a retrospective study and has suggested
prospective and broader validation of this tool.11 This tool seems useful and feasible to use at our setup and
may be useful in risk stratification of acute pancreatitis
patients. “A decision tree is a decision support tool that uses a tree-like graph or model of decisions and their possible consequences, including chance event outcomes, resource costs, and utility”.14 Yang et al randomized 603 patients into a training group (n=402)
and test group (n=201). Revised Atlanta classification
was used to classify patients into MAP, MSAP and SAP. Prediction model was constructed using the decision tree method using univariate and multiple regression analysis and diagnostic sensitivity, specificity, and accuracy of individual parameters. The parameters creatinine, LDH, and OI were selected with the cutoff values were 196.4
μmol/L, 536 U/L, and 289 respectively, as shown in figure
1. Developed decision tree model was evaluated in the
training group. The sensitivity, specificity, and overall
accuracy of the developed model in diagnosing SAP were 80.9%, 90.0%, and 88.5% respectively. The model was again evaluated in the test group (n=201). The sensitivity
and specificity of the developed decision model in the
test group were 88.6% and 90.4% respectively. The probabilities of developing SAP in the high-risk and low-risk groups were 65.9% (31/47) and 2.6% (4/154), respectively.11 The current study used same prediction
model developed by Yang et al to predict SAP. Prediction
model predicted 47 patients to have non-severe acute pancreatitis, out of which 45 (95.74%) had a non-severe disease where as two (4.26%) developed severe disease. Out of six patients predicted to have developed SAP, five
(83.3%) developed SAP and one (16.67%) developed
non-severe pancreatitis. Sensitivity and specificity of this
prediction model in the current study were 97.83% and 71.43% respectively with a positive predictable value of 95.74% and negative predictable value of 83.33%.
These results are comparable to Yang et al. Similarly,
receiver operator characteristic analysis (ROC) showed the comparable result with Yang et al, the area under curve 0.846 in the current study compared to 0.855.
Hong et al had also developed a decision tree model using blood urea nitrogen, pleural effusion, and serum calcium as parameters to predict SAP. They tested the model in
test group showed that the sensitivity and specificity
of their model were 78.9% and 93.1% respectively.15
They have used original Atlanta classification to classify
patients into mild and severe acute pancreatitis. We
preferred model developed by Yang et al because they have used latest Revised Atlanta classification and
classified patients into MAP, MSAP and SAP.
One patient in this study presented with fulminant acute pancreatitis and died within 24 hours of admission. This patient was included in SAP group though persistent
organ failure could not be observed. This signifies the limitation of the current revised Atlanta classification
which requires persistent organ failure (for > 48 hours) to classify a patient as SAP. We agree with Huang and Windsor’s recommendation for inclusion
of this severe form of AP by modification of current classification.16 Similarly Thompson has suggested to
propose modification of revised Atlanta Classification
to include a separate subcategory (“fulminant acute pancreatitis”), to describe cases of SAP, in which death occurs so early that there has not been enough time for the organ failure to have been present for 48 hours or for a day 3 CT scan to have been performed.17
This study has certain limitations. This is a single center study with relatively small sample size. This study had a small number of patients with SAP. The results may not be generalized. Hence, a multicentre study with a large number of patients with SAP would be needed to accept the results universally.
CONCLUSIONS
Decision tree model with serum creatinine, lactate dehydrogenase, and oxygenation index is an easy and useful tool to predict patients at high risk of developing SAP.
ACKNOWLEDGEMENTS
We would like to acknowledge Dr Manish Pokhrel, Dr Mahipendra Tiwari and Dr Erena Pradhan for their help.