Soltani. World Journal of Engineering Research and Technology
SELF-ASSESSMENT PATTERN IN THE SUGGESTIONS SYSTEM
USING INTERVAL DATA ENVELOPMENT ANALYSIS
Dr. Ali Soltani*
Islamic Azad University, Tonekabon branch.
Article Received on 13/11/2018 Article Revised on 04/12/2018 Article Accepted on 25/12/2018
ABSTRACT
Diagnosis and improvement of suggestions system, quantitative targeting and survey of the goals and ultimately planning and budgeting develop the last three steps of the chain in the processes of suggestions system. Paying attention to these three processes and providing practical conditions for their implementation have been regarded as the necessary conditions for success of suggestions system within an organization. Three specific tasks are fulfilled in the diagnosis process, i.e. survey of stakeholders, benchmarking and reviewing and analyzing. With regard to the findings from these stages, targeting and planning are fulfilled. Creation of practical structure guarantees the cycle of constant improvements in this system. The present research proposes a practical rule for diagnosis using Interval Data Envelopment Analysis. In this study, Interval Data Envelopment Analysis is used to proposed practical approach for self-assessment and optimization and a development is proposed to perform this important process in the recommendation system. This pattern inspired of Business excellence model has developed from the enablers criteria which reflect the results from implementation of this system. These criteria together with the factors such as the facilities used in any organization develop the input and output data in the evaluation problem based on Interval Data Envelopment Analysis. In this study, excellence of Data Envelopment Analysis to measure performance of suggestions system with self-assessment approach for 20 organizational units has been displayed. Further, the effective capabilities of Data Envelopment Analysis in measuring the performance and identification of defects and the approaches to resolve them as well as the extent of improvement for inefficient data and outputs are taken into consideration.
World Journal of Engineering Research and Technology
WJERT
www.wjert.org
SJIF Impact Factor: 5.218*Corresponding Author
Dr. Ali Soltani
KEYWORDS: Data Envelopment Analysis, suggestions system, assessment indices, self-assessment, excellence model.
INTRODUCTION
Furthermore, doing properly monitoring as well as fault finding could be the main source of boom in an organization.
The present research intends to propose an approach to assess performance of recommendation system such that some of the reasons for lack of success of this system which are related to improper assessment are clarified. This research has been conducted in five sections; in the first section, the literature review and related works on models for assessment of suggestions system, use of Analytic Hierarchy Process and Data envelopment analysis and a variety of approaches proposed in exposure with uncertain data have been examined. In the second part of this study, research methodology has been discussed as well as performance evaluation of the suggestions system by enumerating its goals .In this section; the current model which is inspired by the EFQM European model has been reviewed. In the third section, those criteria which are called enabler have been sorted in three groups and indices which are related to the results of performing of the suggestions system have been noticed. Then by consulting with experts using analytical hierarchical process, it has been provided performance results of implementing of the suggestions system in the form of a real number between zero and one. In the following, it has been provided an overview on data envelopment analysis. And then the issue of uncertainty in DEA has been discussed. At the end of this section, “interval data envelopment analysis" has presented as a strategy to deal with the problem of the uncertainty of the data. And also application of this method for evaluating the performance of the suggestions system in 20 organizational units of one of the companies covered by the National Gas Company has been examined. In the fourth section, the proposed model and how to implement it has been explained. Finally, in Section fifth, results from the application of IDEA to assess 20 Mentioned units as well as findings of the research have been discussed.
FIRST SECTION: LITERATURE REVIEW
and outputs in the real world problems are often uncertain. Uncertain data in DEA models have been examined in the literature in different forms. Some researchers have suggested Fuzzy data envelopment analysis and interval data envelopment analysis in encounter with uncertain data. In more recent period, uncertain data have been expressed by means of two approaches. Interval data envelopment analysis was proposed for the first time by Cooper, W. W., Park, K. S., & Yu, G. (1999) and fuzzy data envelopment analysis was proposed for the first time by Sengupta. Cooper, W. W., Park, K. S., & Yu, G. (1999) have extended an interval approach which allows using a mix of uncertain and certain data by means of transformation of DEA model to an ordinary linear planning form. Assessment of lower and upper limits of DMU efficiencies has been regarded as one of the problems in interval approach.[4] Despite this problem, some researchers have proposed a variety of interval approaches.[5]
The second section-research methodology
Diagram 1: Criteria and scores related to each of them in the current assessment system.
Since assessment of organizations in the current model is made based on the scores allocated by assessors, conclusion of these views is not without mistake. Allocation of an interval of the values as the score considered for the related criteria might be a logical solution to encounter with this issue. In this state, some input and output data are specified in form of numerical intervals; since the assessments are made by different assessors, several intervals are acquired for each input or output that must be entered into the assessment model (DEA model). In the first section of this research, all the criteria and sub-criteria are listed and categorized and they are reduced in number regardless of their significance. For this, the criteria related to the enablers are qualitative; the criteria related to the results which are quantitative were examined and summarized via two separate approaches. In both approaches, point of view of the experts, specialists and practitioners of recommendation system was considered as the basis for decision making. In this research, the statistical population consists of the practitioners in recommendation system in over 20 organizational complexes in one of the organizations affiliated to National Iranian Gas Company (NIGC).
The third section-Offering model and how to operate it
Offering model for evaluating in this research is using Data Envelopment analysis (DEA) method. Since enabler criteria in proposed model are imprecise, we can use method of' Interval Data Envelopment Analysis'. In addition, this method provides the possibility of
Criteria of assessment model for suggestions system
Leadership (180 scores)
Training and synergy (60 scores)
Advertisements and notification (50 scores)
Organizing (45 scores)
Knowledge management and information system (45 scores)
Motivation (60 scores)
Processes (160 scores)
self-assessment for each organization. In this research some of the output data are imprecise and the others are certain. With regard to what mentioned, there are 20 DMUs under study with a number of inputs and outputs. Inputs of problem for jth DMU have been displayed with X1j, X2j and X3j and 3 outputs related to the enablers which are uncertain scores have been displayed with [yrj L, yrj U]. The fourth output represents score of results of performance which is calculated via hierarchical method in form of a certain value.
Diagram 2: The diagram representing inputs and outputs to assess suggestions system.
This model can be explained using EFQM model. In assessments, the elements contributed in better performance of this system in the organizations are taken into consideration in addition to the criteria considered with EFQM model. In the proposed model in this research, the weights corresponding to advantages of each of organizations mentioned as the features of DEA method are used instead of use of fixed scores for each group of defined factors and criteria which is mentioned as the most important fault of the current assessment system. The criteria related to three above enablers are assessed by different experts. Each of above criteria includes several sub-criteria to which a value ranging from 0 to 100 is given for trust on assessments.
After that, the mentioned numbers are merged and combined with the ideas of other experts. To review criteria of the first group following phases are there:
cases where more than 60 percent of respondents have considered them unimportant or very unimportant are ignored.
Step 2) At this point, the specified criteria are summarized in three general criteria as enablers of type 1, 2 and 3,which explains leadership, politics and training programs respectively.
a score is gained for each of them that are used as a one of the outputs data in Data Envelopment Analysis. The proposed model in this study has created two possibilities for organizations. One of them is the possibility of self-assessment about their performance in suggestions system and the other one is the possibility of comparing their performance with each other and finally their ranking. Proposed models are as below:
A) Self-assessment model
In this model each organization puts itself in the worst and its rivals in the best conditions. E
o (Lower)=
s.t.
-B) The Ranking Model
In this model, each organization puts itself and rival organizations in the best conditions, so the common method of Data Envelopment Analysis used for this purpose:
s.t.
E
o
=
-This model has been used for 20 organizational units involved in this research with 3 inputs and 4 outputs data.
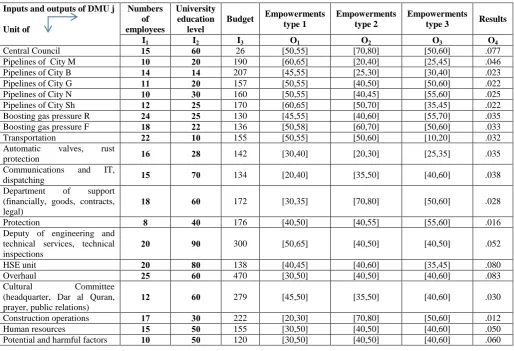
Table 1: Input and output data related to secretariats of the suggestions system in organizational units.
Inputs and outputs of DMU j
Unit of
Numbers of employees
University education
level
Budget Empowerments type 1
Empowerments type 2
Empowerments
type 3 Results
I1 I2 I3 O1 O2 O3 O4
Central Council 52 36 26 [50,55] [70,80] [50,60] .077
Pipelines of City M 56 06 190 [60,65] [20,40] [25,45] .046
Pipelines of City B 51 51 207 [45,55] [25,30] [30,40] .023
Pipelines of City G 55 06 157 [50,55] [40,50] [50,60] .022
Pipelines of City N 56 06 160 [50,55] [40,45] [55,60] .025
Pipelines of City Sh 50 02 170 [60,65] [50,70] [35,45] .022
Boosting gas pressure R 01 02 130 [45,55] [40,60] [55,70] .035
Boosting gas pressure F 55 00 136 [50,58] [60,70] [50,60] .033
Transportation 00 56 155 [50,55] [50,60] [10,20] .032
Automatic valves, rust
protection 53 05 142 [30,40] [20,30] [25,35] .035
Communications and IT,
dispatching 52 46 134 [20,40] [35,50] [40,60] .038
Department of support (financially, goods, contracts, legal)
55 36 172 [30,35] [70,80] [50,60] .028
Protection 5 16 176 [40,50] [40,55] [55,60] .016
Deputy of engineering and technical services, technical inspections
06 66 300 [50,65] [40,50] [40,50] .052
HSE unit 06 56 138 [40,45] [40,60] [35,45] .080
Overhaul 02 36 470 [30,50] [40,50] [40,60] .083
Cultural Committee
(headquarter, Dar al Quran, prayer, public relations)
50 36 279 [45,50] [35,50] [40,60] .030
Construction operations 54 06 222 [20,30] [70,80] [50,60] .012
Human resources 52 26 155 [30,50] [40,50] [40,60] .050
Potential and harmful factors 56 26 120 [30,50] [40,50] [40,60] .060
The fourth section-results and research findings
Table 2: Units’ efficiency and their reference units.
Input surplus Lack of output
S1 S2 S3 S4 S5 S6 S7 Reference units Efficiency
of CCR G* Units name Number of DMUs 0 0 0 0 0 0 0 1 1.00 Central council 5 0 0 0 0 0 0 0 2 1.00
Pipelines of M city
0 0 0 51.31 0 15.44 0 2.55 2,4,9 0.87 Pipelines of B city
0 0 0 0 0 0 0 0 4 1.00
Pipelines of G city
1 0 0 0 0 7.29 0 0.63 2,4,13,20 0.93
Pipelines of N city
2 0 0 0 0 0 19.88 14.99 1,2,4,8 0.95 Pipelines of SH city
3 6.37 0 0 14.25 24.18 0 0 1,2,8 0.93
Boosting gas pressure R
4 0 0 0 0 0 0 0 8 1.00
Boosting gas pressure F
5 0 0 0 5.00 10.00 10.00 0 9 1.00 Transportation 6 0 0 0 12.02 20.56 3.72 0 1,2,9 0.68
Automatic valves, rust protection 56 0 0 0 14.11 2.80 0 4.27 1,4,20 0.49 Communications and IT,
dispatching 55 0 0 0 27.68 0 3.06 12.84 1,6,13 0.68 Department of support
50 0 0 0 0 0 0 0 13 1.00 Protection 50 0 2.87 10.25 0 3.75 11.75 0 2,20 0.46
Deputy of engineering and technical services
51 0 0 0 26.73 36.41 34.70 0 1,2,20 0.76 HSE unit 52 0 0 12.72 79.24 31.67 41.50 0 2,20 0.69 Overhaul 53 0 12.73 32.95 0 0.58. 0 0 2,13,20 0.60 Cultural Committee 54 0 0 17.66 43.33 0 0 43.33 4,6,8 0.81 Construction operations 55 0 0 0 19.79 6.95 4.64 0 1,2,20 0.66 Human resources 56 0 0 0 0 0 0 0 20 1.00
Potential harmful factors
06
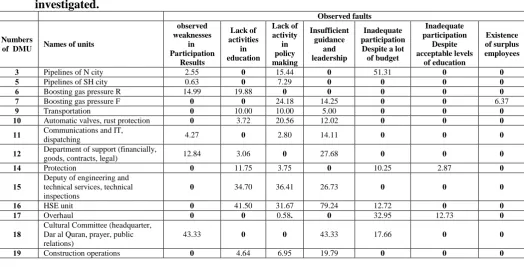
The obtained results from implementation of this model prepare the possibility of detecting faults and shortage in outputs and inefficiencies in resource consumption. Table 3 shows the result of fault finding for inefficient units among 20 units that are under analysis.
Table 3: Fault finding on the implementation of the suggestions system related to units investigated. Observed faults Existence of surplus employees Inadequate participation Despite acceptable levels of education Inadequate participation Despite a lot of budget Insufficient guidance and leadership Lack of activity in policy making Lack of activities in education observed weaknesses in Participation Results Names of units
Numbers of DMU
0 0 51.31 0 15.44 0 2.55 Pipelines of N city
0 0 0 0 0 7.29 0 0.63 Pipelines of SH city
2 0 0 0 0 0 19.88 14.99
Boosting gas pressure R
3 6.37 0 0 14.25 24.18 0 0
Boosting gas pressure F
4 0 0 0 5.00 10.00 10.00 0 Transportation 6 0 0 0 12.02 20.56 3.72 0
Automatic valves, rust protection
56 0 0 0 14.11 2.80 0 4.27 Communications and IT,
dispatching 55 0 0 0 27.68 0 3.06 12.84
Department of support (financially, goods, contracts, legal)
50 0 2.87 10.25 0 3.75 11.75 0 Protection 51 0 0 0 26.73 36.41 34.70 0
Deputy of engineering and technical services, technical inspections 52 0 0 12.72 79.24 31.67 41.50 0 HSE unit 53 0 12.73 32.95 0 0.58. 0 0 Overhaul 54 0 0 17.66 43.33 0 0 43.33 Cultural Committee (headquarter,
This table shows defects detected by each unit and also suggests ways to resolve them. For example, in unit of boosting gas pressure (unit R), the number of employees should be reduced to 6 and it should also be noted activities related to guidance and leadership such as participating senior managers in design and establishment of the suggestions system, call for topics by senior managers, managers participation in the implementation process of the suggestions system, spending enough time by managers and proceedings related to policies such as preparing administrative and financial requirements to create healthy competition for participants in the suggestions system, the existence and security of information system for the management of suggestions system and so on. As another example, the above table shows that about 10 units of save in costs, paying more attention to policies and operation processes and staff training can also resolve inefficiencies of the unit of engineering deputy and technical services.
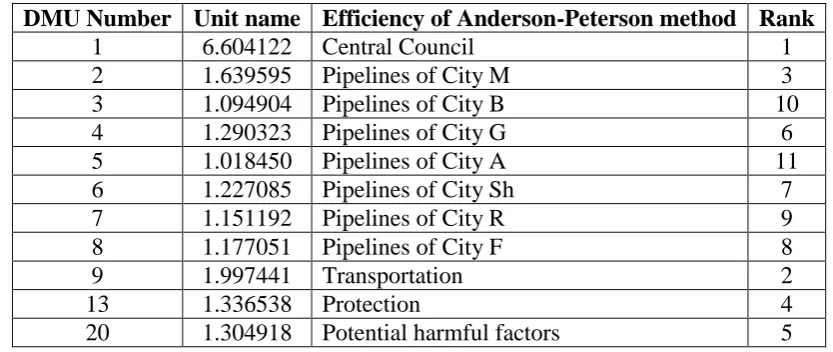
In the second step the Data Envelopment Analysis (Input oriented CCR model) was used with ranking approach to compare units. By using applied Lingo software, the units of 1, 2… 9, 13, 20 were detected as efficient units so that Anderson-Peterson method was used to determine related ranks to these five units. These are the obtained results as follow:
Table 4: Ranking of efficient units using Anderson-Peterson method.
DMU Number Unit name Efficiency of Anderson-Peterson method Rank
1 6.604122 Central Council 1
2 1.639595 Pipelines of City M 3
3 1.094904 Pipelines of City B 10
4 1.290323 Pipelines of City G 6
5 1.018450 Pipelines of City A 11
6 1.227085 Pipelines of City Sh 7
7 1.151192 Pipelines of City R 9
8 1.177051 Pipelines of City F 8
9 1.997441 Transportation 2
13 1.336538 Protection 4
20 1.304918 Potential harmful factors 5
The fifth section -conclusion and results
the best possible weight for defined criteria, considering their relative advantages in Participatory management system. An invaluable advantage that comes with the application of the method is that a set of efficient unit determine for every inefficient decision-making unit that can be used as a pattern to improve performance. According to the DEA model, a DMU is inefficient if there is a unit or combination of units that are able to produce the same output value of the under review unit with a smaller input quantity. This combination is proposed as pattern groups for inefficient decision making units. DEA can also determine the required improved value in each input and output of the inefficient unit. It seems that in future researches the two following topics can attract interested researchers attention to this topic.
First, with regard to all criteria and sub-criteria performance of organizations in suggestions system (not just results) and identifying correlations between them and doing factor analysis, determined their factor structure and possibly by reducing them can assess the performance of organizations in suggestions system more accurately. Criteria and formulas of performance measurement can be monitored and factor analysis should be used to clarify the internal correlation between significant criteria via covariance matrix approximation and detect the major criteria.
Second, in order to avoid neglect of some of the index, it might be gained weight for each of them and also it might be applied DEA method with bound coefficients. Another important issue that can be addressed in future researches is paying to the concept of uncertainty in the measuring data. While in the classic patterns of DEA, the certainty of data is one of the basic assumptions and therefore a small deviation in the data could change the results and thus lead to infeasible solutions .So the results of these evaluations and ranking regardless of the uncertainties in the data, especially when the efficiency of units is close to each other, they can be invalid in many cases. Approaches such as using interval data envelopment analysis, fuzzy data envelopment analysis and robust data envelopment analysis can resolve this problem well. So we can definitely pursue different aspects and below innovations in future researches:
2) Applying the approach uncertain data to consider difference of assessors view in initialization to some of inputs and outputs.
3) Considering unreal amounts (allocation of points) for some of inputs and outputs.
REFERENCES
1. Basadur, M. and Gelade, G.A., The Role of Knowledge Management in the Innovation Process. Journal Compilation, Blackwell Publishing, 2006; 15(1).
2. Bracket, P.L., Charnes A., Cooper w.w., Huang Z., Sun D.B., Data Transformation in DEA Con Ratio Envelopment Approaches for Monitoring Bank Performance, European Journal of Operational Research, 1997; 98: 250-268.
3. Cooper W, Seiford, L, Tone K, Data Envelopment Analysis; a Comprehensive Text with Models, Applications, References and DEA Solver Software, 2000.
4. Cooper, W. W., Park, K. S., & Yu, G., IDEA and AR-IDEA: Models for dealing with imprecise data in DEA. Management Science, 1999; 45: 597–607.
5. Despotis, D. K., & Smirlis, Y. G., Data envelopment analysis with imprecise data. European Journal of Operational Research, 2002; 140: 24–36.
6. Fairbank, J.F., and Williams, S.D., Motivating Creativity & Enhancing Innovation through Employee Suggestion System Technology, Creativity and Innovation Management, 2001; 10(2): 68-74.
7. Jafarpour, et al, Evaluation of the Suggestions System Performance Using DEA, The Case of Isfahan's.
8. Hale Judith, Performance based management: what every manager should do to get result, New York, John Wiley & Sons, 2004.
9. Hadi, et al, Performance Evaluation of the Suggestion System, DOI: 10.5455/medarh.2013.67.131-133, 2013, Mobarakeh Steel Company, J. Basic. Appl. Sci. Res., 2012; 2(11): 11717-11725.
10.Karimi, T., The novel models of organizational performance evaluation, journal of management, seventeenth Year, No. 171, 2006.
11.Marks berry. P, Church.j and Schmidt, m, The Employee Suggestion System: A New Approach Using Latent Semantic Analysis, Human Factors and Ergonomics in Manufacturing & Service Industries, Volume pages, 2014; 29–39.
13.Pluskowski, B., "Dynamic knowledge systems", WHITEPAPER- 0602- 1 Imaginatik, [online], Available: www. Imaginatik, 2002.
14.Robert Simons, Performance Control and measurement systems for implementing the strategy, Trans- Mojtaba Asadi, Ariana industrial research group, 2000.
15.Schuring, Luijten, Reinventing suggestion systems for continuous improvement, Int. J. Technology Management, 2001; 22(4).
16.Thompson R.G., Singleton F.D., Thrall R.M., Smith B. A. “Comparative SiteEvaluations for Locating a High-Energy Physics Lab in Texas,” Interfaces, 2002; 16: 35-49.