WWJMRD 2018; 4(1): 226-244 www.wwjmrd.com
International Journal Peer Reviewed Journal Refereed Journal Indexed Journal UGC Approved Journal Impact Factor MJIF: 4.25 e-ISSN: 2454-6615
Sulaimon Mutiu O.
Department of Statistics and Mathematics, Moshood Abiola Polytechnic, Abeokuta, Ogun State, Nigeria
Adewunmi Olusola A. Department of Statistics and Mathematics, Moshood Abiola Polytechnic, Abeokuta, Ogun State, Nigeria
Oyefusi Olutayo A.
Department of Statistics and Mathematics, Moshood Abiola Polytechnic, Abeokuta, Ogun State, Nigeria
Ajasa Adekunle O.
Department of Statistics and Mathematics, Moshood Abiola Polytechnic, Abeokuta, Ogun State, Nigeria
Ajayi Oluwatoyin
Heritreats Secondary School, Mowe-Ibafo, Ogun State, Nigeria
Correspondence: Sulaimon Mutiu O.
Department of Statistics and Mathematics, Moshood Abiola Polytechnic, Abeokuta, Ogun State, Nigeria
Application of Conjoint Analysis to Customers’
Preference of Soap
Sulaimon Mutiu O, Adewunmi Olusola A, Oyefusi Olutayo A, Ajasa
Adekunle O, Ajayi Oluwatoyin
Abstract
This study determines customers’ preference at the introduction of new toilet soap into the Lagos market. In doing this, the study models a toilet soap preference by consumers in Lagos State, Nigeria based on five factors - Soap Name, Soap Weight, Price Package, Package Design, and Antiseptic. There are three factor levels for Soap Name (Basel, Zenith, and Mosko); two Soap Weights (70g and 150g); three Price Package levels (N100, N200, and N250); three Package Design type (A*, B*, and C*); and two levels (either No or Yes) for Antiseptic factor. Sixteen (16) cases were generated for the orthogonal design, with three (3) holdout cases and two (2) simulation cases. The Conjoint questionnaire contains nineteen (19) product profiles (16 orthogonal cases and 3 holdout cases). Four-hundred and twenty (420) randomly selected subjects (soap users) were used for the rating of the product profiles. Conjoint analysis was thereafter run on the rated product profiles using Conjoint command syntax which was written to suit the project at hand. Analyses were done using frequency, chart and Conjoint method of analysis. From the Conjoint analysis, parameters such as Utilities Scores, Importance Values, Coefficients, Correlations, Number of Reversals, Reversal Summary, Preference Scores of Simulation, and Preference Probabilities of Simulations. From the analysis, it can be concluded that across the four-hundred and twenty subjects for this study, and average customer would most prefer a soap named Mosko, weighing 70g with package design A*, no antiseptic ingredient, and costs N250. Package design is of more importance when marketing a toilet soap followed by the soap name. Soap price and weight should take a considerable priority while the inclusion of antiseptic ingredient should take the least priority. It is however recommended that the inclusion or non-inclusion of antiseptic ingredients to the production of toilet soap should be of lesser importance as most customers seem to have little or no taste for that.
Keywords: Analysis, Application, Conjoint, Customer, Preference, Soap
Introduction
Soap is a daily need for everybody. There is no place in the society be it in the homes, schools, industries, offices etc where the making use of soap is prohibited.
The earliest recorded evidence of the production of soap-like materials dates back to around 2800 BC in Ancient Babylon. In the reign of Nabonidus (556–539 BCE) a recipe for soap consisted of uhulu [ashes], cypress [oil] and sesame [seed oil] "for washing the stones for the servant girls". A formula for soap consisting of water, alkali, and cassia oil was written on a Babylonian clay tablet around 2200 BC.
The Ebers papyrus (Egypt, 1550 BC) indicates that ancient Egyptians bathed regularly and combined animal and vegetable oils with alkaline salts to create a soap-like substance. Egyptian documents mention that a soap-like substance was used in the preparation of wool for weaving.
The industrial production of soap involves continuous processes, involving continuous addition of fat and removal of product. Smaller-scale production involves the traditional batch processes. There are three variations: the cold-process, wherein the reaction takes place substantially at room temperature, the semi-boiled or hot-process, wherein the reaction takes place at near-boiling point, and the fully boiled process, wherein the reactants are boiled at least once and the glycerol recovered. The cold-process and hot-process (semi-boiled) are the
simplest and typically used by small artisans and hobbyists producing handmade decorative soaps and similar. The glycerin remains in the soap and the reaction continues for many days after the soap is poured into moulds. In the hot-process method, also, the glycerin is left in but at the high temperature employed; the reaction is practically completed in the kettle, before the soap is poured into moulds. This process is simple and quick and is the one employed in small factories all over the world.
From studies carried out, Nigeria has great potential to produce high quality toilet and laundry soaps more than obtainable from Malaysia, Singapore, and other Asian companies. Nigeria as a country can easily produce quality laundry and toilet soaps, using local raw materials and technology that can gain international acceptance.
Soap, be it antiseptic, toilet or ordinary bar can be graded along foodstuff as essential commodity, in view of the fact that it has to be used three or more times daily. With almost every street of Nigerian towns spotting at least four restaurants each, it is estimated that each of these canteens will need an average of one bar soap daily. The home front is not left out. Nigeria with a population of over 140 million, if assumed that on the average each person uses a tablet of toilet soap fortnightly, then the demand per annum is enormously great.
Though very many brands of toilet, antiseptic and bar soaps have appeared in the market recently, it has not sufficiently affected the degree of demand for the product. The quality of soap produce determines its acceptability within and outside the boundaries of Nigerian markets.
Competition exists in this industry between various big-name corporations who have manufactured soap and bath products for extensive periods of time and soap and bath products niche markets that are become increasingly popular with consumers. Demand in the soap and bath product industry is typically driven by the evolving age composition within the general public, as well as by the personal income of the consumer. The soap and bath products industry is creating more products geared toward the aging process, and also, at the other end of the spectrum, products geared specifically towards children. The soap and bath products industry is comprised of establishments whose primary concern is the manufacturing, distribution, and retailing of soap and other bathing products (such as shower gels, bath salts, bubble bath, bath oils, etc.). Consumers in the soap and bath products industry are focusing typically on the scent and moisturizing capabilities of a product they are considering for purchase. These characteristics have been heralded as the most influential to potential consumers. However, in recent time consumers have started to become more aware of the ingredients in soap and bath products and are demanding products with natural and organic compositions. The market for traditional bar soaps is considered mature, while the markets for newer bath products and natural and antibacterial soaps presents opportunity for growth in the soap and bath products industry. As such, traditional soap and bath product companies are striving to meet the needs of this new type of consumer, and soap and bath retailers that previously resided firmly in the niche markets are rapidly moving to the forefront of the soap and bath products industry.
These situations however, initiated this research work to look at consumers’ preference at the introduction of new toilet soap into the Nigerian market.
Aim of the study
The aim of this study is to determining customers’ preference at the introduction of new toilet soap into the Lagos market. In doing this, the study models a toilet soap preference by consumers in Lagos State based on five factors - Soap Name, Soap Weight, Price Package, Package Design, and Antiseptic, using Conjoint Analysis technique.
Scope of the study
This study covers five (5) orthogonal design factors – Soap Name, Soap Weight, Price Package, Package Design, and Antiseptic.
There are three factor levels for Soap Name (Basel, Zenith, and Mosko); two Soap Weights (70g and 150g); three Price Package levels (N100, N200, and N250); three Package Design type (A*, B*, and C*); and two levels (either No or Yes) for Antiseptic factor.
Four-hundred and twenty (420) randomly selected subjects across Agege, Ikotun, Iyana-Ipaja and Oshodi area of Lagos were used for the rating of the Experimental Stimuli (Product Profiles) generated from the Conjoint orthogonal design upon which necessary analyses were done.
Analyses were done using the conjoint procedure of SPSS (Statistical Packages for Social Sciences) through the use of the conjoint command syntax- which was written to suit the research at hand.
Research questions
1. To what extent will soap users prefer a soap named Basel, Zenith or Mosko?
2. Will soap users prefer a soap weight 70g or 150g? 3. Will soap users prefer a price package of N100, N200,
or N250?
4. To what extent will soap users prefer a package design type A*, B*, or C*?
5. To what extent will soap users prefer an antiseptic soap to non-antiseptic?
Literature review
Conjoint analysis deals with central management decisions: Why consumers choose one brand or one supplier over another? How do consumers react to reformulations of the product? How price sensitive are consumers? To whom is a given product attractive? Managers and marketers always want to know how consumers make purchase decision especially when it concerns products with multiple attributes. In order to measure trade-offs between various product attributes, we need to quantify consumers’ preferences by assigning specific values to the range of options consumers consider when making a purchase decision. Armed with this knowledge, managers can focus on the most important features of products or services and design messages most likely to strike a cord with target buyers.
However, when asked outright to accurately determine the relative importance of product attributes and preference for levels of these attributes, many consumers are unable to do so. Furthermore, individual attribute levels in isolation are perceived differently from combinations of levels across attributes that are found in a product. The task is easier if the survey respondent is presented with combinations of attribute levels that can be visualized as different product offerings.
analyze how customers make trade-offs by presenting profile descriptions to survey respondents, and deriving a set of partworths for the individual attribute levels that, given some type of composition or additive rule, reflects the respondents’ overall preferences. It uses only a subset of the possible combinations of product attribute levels, and decomposes the respondents’ evaluations of the profiles into separate and compatible utility scales by which the original global judgments or others involving new combinations of attributes can be reconstituted.
Since its introduction to the marketing area, conjoint analysis has proved to have remarkable staying power in both academia and industry. The former’s interest is suggested by the continuing rise in the number of journal articles on conjoint analysis. The latter’s interest is made clear by the increasing number of conjoint applications (Green and Krieger, 1993). The technique is definitely one of the major cross-over breakthroughs between academic theory and practitioner relevance in the field of marketing research. Thousands of companies today utilize conjoint methods for decision making in product introductions, pricing, market segmentation…etc. Most of the time they spend large sums of money on employing marketing research professionals and consultants to conduct conjoint-based studies. Some major projects that involve significant use of conjoint analysis include the design of Courtyard by Marriott and the launch of EZPass. The technique has also been used for consumer and industrial products and services and for not-for-profit offerings.
Conjoint analysis is a statistical technique used in market research to determine how people value different features that make up an individual product or service. It is a tool for developing effective product design. Conjoint analysis is a tool that allows a subset of the possible combinations of product features to be used to determine the relative importance of each feature in the purchasing decision. Conjoint analysis is based on the fact that the relative values of attributes considered jointly can better be measured than when considered in isolation.
Using conjoint analysis, the researcher can answer questions such as: What product attributes are important or unimportant to the consumer? What levels of product attributes are the most or least desirable in the consumer’s mind? What is the market share of preference for leading competitors’ products versus our existing or proposed product?
In a conjoint analysis, the respondent may be asked to arrange a list of combinations of product attributes in decreasing order of preference. Once this ranking is obtained, a computer is used to find the utilities of different values of each attribute that would result in the respondent's order of preference. This method is efficient in the sense that the survey does not need to be conducted using every possible combination of attributes. The utilities can be determined using a subset of possible attribute combinations. From these results one can predict the desirability of the combinations that were not tested. The virtue of conjoint analysis is that it asks the respondent to make choices in the same fashion as the consumer presumably does—by trading off features, one against another. The objective of conjoint analysis is to determine what combination of a limited number of attributes is most influential on respondent choice or decision making. A controlled set of potential products or services is shown
to respondents and by analyzing how they make preferences between these products, the implicit valuation of the individual elements making up the product or service can be determined. These implicit valuations (utilities or part-worths) can be used to create market models that estimate market share, revenue and even profitability of new designs.
Conjoint originated in mathematical psychology and was developed by marketing professor Paul Green at the University of Pennsylvania and Data Chan. Other prominent conjoint analysis pioneers include professor V. “Seenu” Srinivasan of Stanford University who developed a linear programming (LINMAP) procedure for rank ordered data as well as a self-explicated approach, Richard Johnson (founder of Sawtooth Software) who developed the Adaptive Conjoint Analysis technique in the 1980s and Jordan Louviere (Ph.D., University of Iowa) who invented and developed Choice-based approaches to conjoint analysis and related techniques such as MaxDiff.
Today it is used in many of the social sciences and applied sciences including marketing, product management, and operations research. It is used frequently in testing customer acceptance of new product designs, in assessing the appeal of advertisements and in service design. It has been used in product positioning.
Conjoint Analysis is one of the most effective models in extracting consumer behaviour into an empirical or quantitative measurement. It evaluates products/services in a way no other method can. Traditional ratings surveys and analysis do not have the ability to place the “importance” or “value” on the different attributes, a particular product or service is composed of. Conjoint Analysis guides the end user into extrapolating his or her preference to a quantitative measurement.
One of the most important strengths of Conjoint Analysis is the ability to develop market simulation models that can predict consumer behaviour to product changes. With Conjoint Analysis, changes in markets or products can be incorporated into the simulation, to predict how consumers would react to changes.
Conjoint analysis techniques may also be referred to as multi-attribute compositional modelling, discrete choice modelling, or stated preference research, and is part of a broader set of trade-off analysis tools used for systematic analysis of decisions. These tools include Brand-Price Trade-Off, Simalto, and mathematical approaches such as evolutionary algorithms or Rule Developing Experimentation.
Number of profiles to evaluate in conjoint analysis
Conjoint analysis is a methodology in which a decision maker has to choose from a number of options that vary simultaneously from between two or more attributes (Green
predict preferences that result in an assessment of achievements is the principal goal of conjoint analysis. In applications of conjoint analysis, products or services
(profiles) are described through a set of attributes with the idea of measuring the preferences of the respondents, as shown in Figure 1.
Fig.1: Relationship between profiles, attributes, and levels.
In the case of having N attributes with k levels each, the number of profiles or stimuli that must be evaluated is:
k · k ··· k = kN
N times
For example, if we have 6 attributes with 3 levels each, the numbers of profiles to be evaluated are 36 = 729. If there
are two more attributes with the same number of levels, in other words, 8 attributes with 3 levels each, the number of stimuli will increase significantly, since the number of profiles to be evaluated becomes 6,561. If the number of levels varies between the attributes, for example N
attributes with k levels and M attributes with l levels, then the number of stimuli to be evaluated is:
k · k ··· k · l · l ··· l = kN · lM
N times M times
For example, if we have 2 attributes with 3 levels and 3 attributes with 2 levels, the total number of profiles to be evaluated will be 32· 23 = 72 . If we have 2 attributes with 4
levels and 3 attributes with 2 levels, the total number of stimuli to be evaluated will be 42 · 23 = 128.
Attributes and levels in conjoint analysis
Attributes and levels form the fundamental basis of conjoint analysis. The idea is that a product or service can be broken down into its constituent parts - so for instance a mobile phone has a size, weight, battery life, size of address book, type of ring. Each of these elements making up a generic mobile phone is known as an attribute.
When we compare between mobile phones each will have a different specification on each of these attributes. You might have choices in terms of battery life between 12, 24, 36, 48 hours of battery life. Each of these options is known as a level of the battery life attribute.
This breaking down of products and services into attributes and levels is an extremely powerful tool for examining what a business offers and what it should be offering. For new product development, combining this product breakdown with an understanding of what the customer values most means that the business can focus its efforts on those areas of most importance to customers.
In conjoint analysis, attributes and levels have to behave in certain ways so that the conjoint analysis is valid, and in certain other ways to make the conjoint useful.
Firstly, each attribute has to be independent, that is it should not overlap with other attributes. So, colour and fuel
economy are clearly not related, so they could appear together. However, some things like "car shape" and "number of passengers" aren't independent.
There are also more subtle effects - certain attributes have halo-effect on others around them. For instance, if one level were "gold-plated handle", many people would infer that the rest of the product was also of better quality when there is no other information to support this. The main difficulty this causes is that price and brand need to be treated extremely carefully in conjoint studies to produce valid results.
Each level also needs to be capable of being read and understood on its own. Although attributes are used to help break a product down and in analysis, when presented to respondents all the respondents see are the levels.
Independent and readable levels are important from an analysis point of view, but for the conjoint to be useful it also needs to ensure that the range of attributes cover all the areas that are important to the customer, and that the range of levels cover all possibilities from worst-case to blue-sky. For many products, particularly in business markets, service can be more important than the actual product. By using both product and service attributes in the same conjoint it is possible to see how customers trade-off service against features. However, care has to be taken to balance the attributes to prevent biasing the outcome one way or another.
Collecting and analysing conjoint data
Data for conjoint analysis is most commonly gathered through a market research survey, although conjoint analysis can also be applied to a carefully designed configurator or data from an appropriately design test market experiment. Market research rules of thumb apply with regard to statistical sample size and accuracy when designing conjoint analysis interviews.
The length of the research questionnaire depends on the number of attributes to be assessed and the method of conjoint analysis in use. A typical Adaptive Conjoint questionnaire with 20-25 attributes may take more than 30 minutes to complete. Choice based conjoint, by using a smaller profile set distributed across the sample as a whole may be completed in less than 15 minutes.
Since there is typically a great deal of between-subject variation in preferences, much of conjoint analysis focuses on the single subject. To generalize the results, a random sample of subjects from the target population is selected so that group results can be examined.
one report (Cattin and Wittink, 1982), the authors state that the sample size in commercial conjoint studies usually ranges from 100 to 1,000, with 300 to 550 the most typical range. In another study (Akaah and Korgaonkar, 1988), it is found that smaller sample sizes (less than 100) are typical. As always, the sample size should be large enough to ensure reliability.
Once the sample is chosen, the researcher administers the set of profiles, or cards, to each respondent. The Conjoint procedure allows for three methods of data recording. In the first method, subjects are asked to assign a preference score to each profile. This type of method is typical when a Likert scale is used or when the subjects are asked to assign a number from 1 to 100 to indicate preference. In the second method, subjects are asked to assign a rank to each profile ranging from 1 to the total number of profiles. In the third method, subjects are asked to sort the profiles in terms of preference. With this last method, the researcher records the profile numbers in the order given by each subject. Any number of algorithms may be used to estimate utility functions. These utility functions indicate the perceived value of the feature and how sensitive consumer perceptions and preferences are to changes in product features. The actual mode of analysis will depend on the design of the task and profiles for respondents. For full profile tasks, linear regression may be appropriate, for choice based tasks, maximum likelihood estimation, usually with logistic regression are typically used. The original methods were monotonic analysis of variance or linear programming techniques, but these are largely obsolete in contemporary marketing research practice. In addition, hierarchical Bayesian procedures that operate on choice data may be used to estimate individual level utilities from more limited choice-based designs.
Using SPSS, analysis of the data is done with the conjoint procedure (available only through command syntax) and results in a utility score, called a part-worth, for each factor level. These utility scores, analogous to regression coefficients, provide a quantitative measure of the preference for each factor level, with larger values corresponding to greater preference. Part-worths are expressed in a common unit, allowing them to be added together to give the total utility, or overall preference, for any combination of factor levels. The part-worths then constitute a model for predicting the preference of any product profile, including profiles, referred to as simulation cases that were not actually presented in the experiment. The information obtained from a conjoint analysis can be applied to a wide variety of market research questions. It can be used to investigate areas such as product design, market share, strategic advertising, cost-benefit analysis, and market segmentation or. Conjoint analysis can be useful in almost any scientific or business field in which measuring people’s perceptions or judgments is important.
Market simulators for conjoint analysis
The market simulator is usually considered the most important tool resulting from a conjoint analysis project. The simulator is used to convert raw conjoint (part-worth utility) data into something much more managerially useful: simulated market choices. Products can be introduced within a simulated market scenario and the simulator reports the percentage of respondents projected to choose each product. A market simulator lets an analyst or
manager conduct what-if games to investigate issues such as new product design, product positioning, and pricing strategy.
A conjoint study leads to a set of utilities or part-worths that quantify respondents’ preferences for each level of each attribute. These utilities can be analysed in a number of ways. One can examine each respondent’s utilities, but, if the number of respondents is large, this can be overwhelming. One might summarize the average utilities or compute average importances. One could create graphs and charts to display that information. But to many managers the results of conjoint analysis may seem abstract. Also, when we examine aggregate data or average responses, we may fail to detect important market segments—groups of consumers with unique and targetable preferences.
A good market simulator is like having all of your respondents gathered in one room for the sole purpose of voting on product concepts within competitive scenarios. The product concepts are defined in terms of the attributes and levels one used in the conjoint study.
The simplest market simulation is a simulation that assumes a first-choice model. A first-choice model assumes respondents buy or choose the product alternative from the competitive set that has the highest total utility, as determined by summing the part-worth utilities associated with the levels describing each product.
Research methodology
This research was designed to look into the influence of customers’ preference at the introduction of new toilet soap into the Lagos market by making use of five factors - Soap Name, Soap Weight, Price Package, Package Design, and Antiseptic.
There are three factor levels for Soap Name (Basel, Zenith, and Mosko); two Soap Weights (70g and 150g); three Price Package levels (N100, N200, and N250); three Package Design type (A*, B*, and C*); and two levels (either No or Yes) for Antiseptic factor.
To achieve this design a model for customers’ preference based on these five factors was developed. The first step was the creation of the combinations of factor levels that were presented as product profiles to the subjects (soap users) in form of conjoint questionnaire. To do this, a representative subset known as an orthogonal array or design was generated and stored the information in an SPSS data file.
Sixteen (16) cases were generated for the orthogonal design, with three (3) holdout cases and two (2) simulation cases. After generating the orthogonal design, it was used to create the product profiles (presented as Conjoint questionnaire) to be rated by the subjects.
Four-hundred and twenty (420) randomly selected subjects (soap users) were used for the rating of the product profiles. Conjoint analysis was thereafter run on the rated product profiles using conjoint command syntax which was written to suit the project at hand.
Analyses were done using frequency, chart and conjoint method of analysis. From the Conjoint analysis, parameters such as Utilities Scores, Importance Values, Coefficients, Correlations, Number of Reversals, Reversal Summary, Preference Scores of Simulation, and Preference Probabilities of Simulations 6 were estimated upon which valid conclusions and recommendations were made.
Analysis
The data collected were preference rank for nineteen product profiles generated through use of SPSS orthogonal design from five factors - Soap Name, Soap Weight, Price Package, Package Design, and Antiseptic.
Using SPSS (version 21), table of product profiles and table of ranked profiles were constructed from which preference frequency tables were constructed. The table of ranked profiles contains the subjects’ responses to the conjoint questionnaire.
Table 1: Experimental stimuli (PRODUCT PROFILES) for soap marketing
Card ID Soap Name Soap Weight Soap Price Package Design Antiseptic
1 1 Basel 70g N100 A* No
2 2 Basel 150g N100 A* No
3 3 Mosko 70g N100 B* Yes
4 4 Basel 150g N250 A* Yes
5 5 Mosko 150g N100 A* No
6 6 Basel 70g N100 C* Yes
7 7 Zenith 70g N250 B* No
8 8 Zenith 150g N100 C* Yes
9 9 Basel 150g N100 B* Yes
10 10 Mosko 150g N250 C* No
11 11 Basel 150g N200 B* No
12 12 Mosko 70g N200 A* Yes
13 13 Basel 70g N200 C* No
14 14 Zenith 150g N200 A* Yes
15 15 Zenith 70g N100 A* No
16 16 Basel 70g N250 A* Yes
17(a) 17 Mosko 70g N250 A* No
18(a) 18 Zenith 70g N100 B* Yes
19(a) 19 Basel 70g N100 C* No
20(b) 1 Basel 70g N200 B* No
21(b) 2 Mosko 150g N250 A* Yes
a) Holdout
b) Simulation
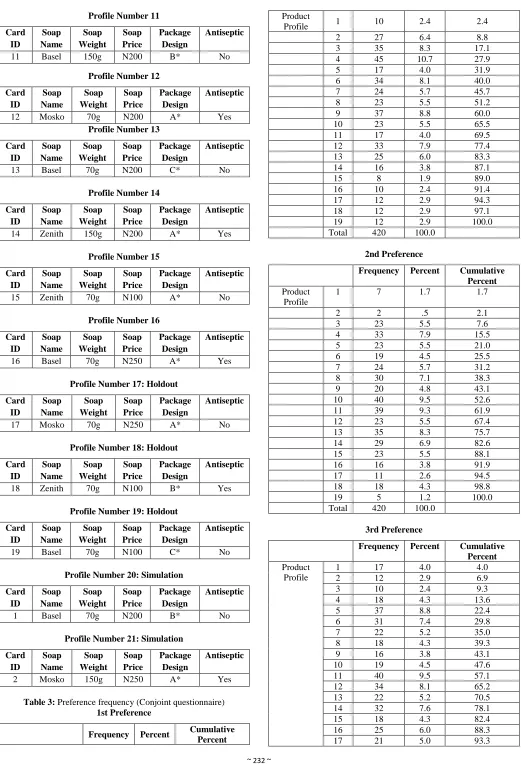
Table 2: Product profiles – Profiles for subjects Profile Number 1
Card ID Soap Name Soap Weight Soap Price Package Design Antiseptic
1 Basel 70g N100 A* No
Profile Number 2
Card ID Soap Name Soap Weight Soap Price Package Design Antiseptic
2 Basel 150g N100 A* No
Profile Number 3
Card ID Soap Name Soap Weight Soap Price Package Design Antiseptic
3 Mosko 70g N100 B* Yes
Profile Number 4
Card ID Soap Name Soap Weight Soap Price Package Design Antiseptic
4 Basel 150g N250 A* Yes
Profile Number 5
Card ID Soap Name Soap Weight Soap Price Package Design Antiseptic
5 Mosko 150g N100 A* No
Profile Number 6
Card ID Soap Name Soap Weight Soap Price Package Design Antiseptic
6 Basel 70g N100 C* Yes
Profile Number 7
Card ID Soap Name Soap Weight Soap Price Package Design Antiseptic
7 Zenith 70g N250 B* No
Profile Number 8
Card ID Soap Name Soap Weight Soap Price Package Design Antiseptic
8 Zenith 150g N100 C* Yes
Profile Number 9
Card ID Soap Name Soap Weight Soap Price Package Design Antiseptic
9 Basel 150g N100 B* Yes
Profile Number 10
Card ID Soap Name Soap Weight Soap Price Package Design Antiseptic
Profile Number 11 Card ID Soap Name Soap Weight Soap Price Package Design Antiseptic
11 Basel 150g N200 B* No
Profile Number 12
Card ID Soap Name Soap Weight Soap Price Package Design Antiseptic
12 Mosko 70g N200 A* Yes
Profile Number 13
Card ID Soap Name Soap Weight Soap Price Package Design Antiseptic
13 Basel 70g N200 C* No
Profile Number 14
Card ID Soap Name Soap Weight Soap Price Package Design Antiseptic
14 Zenith 150g N200 A* Yes
Profile Number 15
Card ID Soap Name Soap Weight Soap Price Package Design Antiseptic
15 Zenith 70g N100 A* No
Profile Number 16
Card ID Soap Name Soap Weight Soap Price Package Design Antiseptic
16 Basel 70g N250 A* Yes
Profile Number 17: Holdout
Card ID Soap Name Soap Weight Soap Price Package Design Antiseptic
17 Mosko 70g N250 A* No
Profile Number 18: Holdout
Card ID Soap Name Soap Weight Soap Price Package Design Antiseptic
18 Zenith 70g N100 B* Yes
Profile Number 19: Holdout
Card ID Soap Name Soap Weight Soap Price Package Design Antiseptic
19 Basel 70g N100 C* No
Profile Number 20: Simulation
Card ID Soap Name Soap Weight Soap Price Package Design Antiseptic
1 Basel 70g N200 B* No
Profile Number 21: Simulation
Card ID Soap Name Soap Weight Soap Price Package Design Antiseptic
2 Mosko 150g N250 A* Yes
Table 3: Preference frequency (Conjoint questionnaire) 1st Preference
Frequency Percent Cumulative Percent
Product
Profile 1 10 2.4 2.4
2 27 6.4 8.8
3 35 8.3 17.1
4 45 10.7 27.9
5 17 4.0 31.9
6 34 8.1 40.0
7 24 5.7 45.7
8 23 5.5 51.2
9 37 8.8 60.0
10 23 5.5 65.5
11 17 4.0 69.5
12 33 7.9 77.4
13 25 6.0 83.3
14 16 3.8 87.1
15 8 1.9 89.0
16 10 2.4 91.4
17 12 2.9 94.3
18 12 2.9 97.1
19 12 2.9 100.0
Total 420 100.0
2nd Preference
Frequency Percent Cumulative Percent Product
Profile
1 7 1.7 1.7
2 2 .5 2.1
3 23 5.5 7.6
4 33 7.9 15.5
5 23 5.5 21.0
6 19 4.5 25.5
7 24 5.7 31.2
8 30 7.1 38.3
9 20 4.8 43.1
10 40 9.5 52.6
11 39 9.3 61.9
12 23 5.5 67.4
13 35 8.3 75.7
14 29 6.9 82.6
15 23 5.5 88.1
16 16 3.8 91.9
17 11 2.6 94.5
18 18 4.3 98.8
19 5 1.2 100.0
Total 420 100.0
3rd Preference
Frequency Percent Cumulative Percent Product
Profile
1 17 4.0 4.0
2 12 2.9 6.9
3 10 2.4 9.3
4 18 4.3 13.6
5 37 8.8 22.4
6 31 7.4 29.8
7 22 5.2 35.0
8 18 4.3 39.3
9 16 3.8 43.1
10 19 4.5 47.6
11 40 9.5 57.1
12 34 8.1 65.2
13 22 5.2 70.5
14 32 7.6 78.1
15 18 4.3 82.4
16 25 6.0 88.3
18 14 3.3 96.7
19 14 3.3 100.0
Total 420 100.0
4th Preference
Frequency Percent Cumulative Percent Product
Profile
1 21 5.0 5.0
2 18 4.3 9.3
3 22 5.2 14.5
4 2 .5 15.0
5 8 1.9 16.9
6 12 2.9 19.8
7 32 7.6 27.4
8 43 10.2 37.6
9 29 6.9 44.5
10 21 5.0 49.5
11 21 5.0 54.5
12 19 4.5 59.0
13 19 4.5 63.6
14 39 9.3 72.9
15 38 9.0 81.9
16 14 3.3 85.2
17 27 6.4 91.7
18 18 4.3 96.0
19 17 4.0 100.0
Total 420 100.0
5th Preference
Frequency Percent Cumulative Percent Product
Profile
1 30 7.1 7.1
2 35 8.3 15.5
3 23 5.5 21.0
4 10 2.4 23.3
5 8 1.9 25.2
6 9 2.1 27.4
7 15 3.6 31.0
8 8 1.9 32.9
9 27 6.4 39.3
10 38 9.0 48.3
11 24 5.7 54.0
12 35 8.3 62.4
13 34 8.1 70.5
14 21 5.0 75.5
15 32 7.6 83.1
16 20 4.8 87.9
17 18 4.3 92.1
18 20 4.8 96.9
19 13 3.1 100.0
Total 420 100.0
6th Preference
Frequency Percent Cumulative Percent Product
Profile
1 29 6.9 6.9
2 31 7.4 14.3
3 21 5.0 19.3
4 20 4.8 24.0
5 8 1.9 26.0
6 5 1.2 27.1
7 4 1.0 28.1
8 5 1.2 29.3
9 26 6.2 35.5
10 36 8.6 44.0
11 19 4.5 48.6
12 32 7.6 56.2
13 34 8.1 64.3
14 25 6.0 70.2
15 31 7.4 77.6
16 32 7.6 85.2
17 19 4.5 89.8
18 28 6.7 96.4
19 15 3.6 100.0
Total 420 100.0
7th Preference
Frequency Percent Cumulative Percent Product
Profile
1 30 7.1 7.1
2 44 10.5 17.6
3 19 4.5 22.1
4 12 2.9 25.0
5 15 3.6 28.6
6 17 4.0 32.6
7 6 1.4 34.0
8 17 4.0 38.1
9 8 1.9 40.0
10 16 3.8 43.8
11 17 4.0 47.9
12 13 3.1 51.0
13 21 5.0 56.0
14 28 6.7 62.6
15 31 7.4 70.0
16 25 6.0 76.0
17 33 7.9 83.8
18 31 7.4 91.2
19 37 8.8 100.0
Total 420 100.0
8th Preference
Frequency Percent Cumulative Percent Product
Profile
1 27 6.4 6.4
2 24 5.7 12.1
3 17 4.0 16.2
4 19 4.5 20.7
5 13 3.1 23.8
6 12 2.9 26.7
7 13 3.1 29.8
8 2 .5 30.2
9 7 1.7 31.9
10 15 3.6 35.5
11 14 3.3 38.8
12 24 5.7 44.5
13 18 4.3 48.8
14 25 6.0 54.8
15 27 6.4 61.2
16 37 8.8 70.0
17 49 11.7 81.7
18 36 8.6 90.2
19 41 9.8 100.0
Total 420 100.0
9th Preference
Frequency Percent Cumulative Percent
Product Profile
1 29 6.9 6.9
2 17 4.0 11.0
3 21 5.0 16.0
4 13 3.1 19.0
5 28 6.7 25.7
6 8 1.9 27.6
8 25 6.0 40.0
9 4 1.0 41.0
10 18 4.3 45.2
11 9 2.1 47.4
12 28 6.7 54.0
13 24 5.7 59.8
14 31 7.4 67.1
15 21 5.0 72.1
16 33 7.9 80.0
17 19 4.5 84.5
18 36 8.6 93.1
19 29 6.9 100.0
Total 420 100.0
10th Preference
Frequency Percent Cumulative Percent
Product Profile
1 33 7.9 7.9
2 33 7.9 15.7
3 29 6.9 22.6
4 12 2.9 25.5
5 16 3.8 29.3
6 23 5.5 34.8
7 7 1.7 36.4
8 12 2.9 39.3
9 14 3.3 42.6
10 7 1.7 44.3
11 17 4.0 48.3
12 19 4.5 52.9
13 23 5.5 58.3
14 35 8.3 66.7
15 24 5.7 72.4
16 30 7.1 79.5
17 33 7.9 87.4
18 25 6.0 93.3
19 28 6.7 100.0
Total 420 100.0
11th Preference
Frequency Percent Cumulative Percent Product
Profile
1 28 6.7 6.7
2 21 5.0 11.7
3 23 5.5 17.1
4 37 8.8 26.0
5 21 5.0 31.0
6 20 4.8 35.7
7 11 2.6 38.3
8 17 4.0 42.4
9 12 2.9 45.2
10 5 1.2 46.4
11 14 3.3 49.8
12 20 4.8 54.5
13 19 4.5 59.0
14 27 6.4 65.5
15 36 8.6 74.0
16 40 9.5 83.6
17 15 3.6 87.1
18 29 6.9 94.0
19 25 6.0 100.0
Total 420 100.0
12th Preference
Frequency Percent Cumulative Percent Product
Profile
1 29 6.9 6.9
2 23 5.5 12.4
3 20 4.8 17.1
4 25 6.0 23.1
5 32 7.6 30.7
6 37 8.8 39.5
7 15 3.6 43.1
8 27 6.4 49.5
9 7 1.7 51.2
10 21 5.0 56.2
11 18 4.3 60.5
12 6 1.4 61.9
13 16 3.8 65.7
14 23 5.5 71.2
15 32 7.6 78.8
16 18 4.3 83.1
17 37 8.8 91.9
18 12 2.9 94.8
19 22 5.2 100.0
Total 420 100.0
13th Preference
Frequency Percent Cumulative Percent
Product Profile
1 27 6.4 6.4
2 29 6.9 13.3
3 27 6.4 19.8
4 23 5.5 25.2
5 31 7.4 32.6
6 17 4.0 36.7
7 42 10.0 46.7
8 35 8.3 55.0
9 33 7.9 62.9
10 13 3.1 66.0
11 16 3.8 69.8
12 8 1.9 71.7
13 6 1.4 73.1
14 16 3.8 76.9
15 17 4.0 81.0
16 17 4.0 85.0
17 19 4.5 89.5
18 25 6.0 95.5
19 19 4.5 100.0
Total 420 100.0
14th Preference
Frequency Percent Cumulative Percent Product
Profile
1 11 2.6 2.6
2 18 4.3 6.9
3 17 4.0 11.0
4 23 5.5 16.4
5 26 6.2 22.6
6 35 8.3 31.0
7 38 9.0 40.0
8 23 5.5 45.5
9 35 8.3 53.8
10 23 5.5 59.3
11 22 5.2 64.5
12 7 1.7 66.2
13 20 4.8 71.0
14 4 1.0 71.9
15 11 2.6 74.5
16 33 7.9 82.4
17 26 6.2 88.6
18 21 5.0 93.6
19 27 6.4 100.0
15th Preference
Frequency Percent Cumulative Percent
Product Profile
1 14 3.3 3.3
2 14 3.3 6.7
3 20 4.8 11.4
4 24 5.7 17.1
5 20 4.8 21.9
6 39 9.3 31.2
7 32 7.6 38.8
8 12 2.9 41.7
9 24 5.7 47.4
10 20 4.8 52.1
11 32 7.6 59.8
12 45 10.7 70.5
13 32 7.6 78.1
14 9 2.1 80.2
15 2 .5 80.7
16 24 5.7 86.4
17 27 6.4 92.9
18 10 2.4 95.2
19 20 4.8 100.0
Total 420 100.0
16th Preference
Frequency Percent Cumulative Percent
Product Profile
1 18 4.3 4.3
2 25 6.0 10.2
3 24 5.7 16.0
4 17 4.0 20.0
5 30 7.1 27.1
6 20 4.8 31.9
7 26 6.2 38.1
8 24 5.7 43.8
9 23 5.5 49.3
10 14 3.3 52.6
11 17 4.0 56.7
12 18 4.3 61.0
13 22 5.2 66.2
14 21 5.0 71.2
15 22 5.2 76.4
16 7 1.7 78.1
17 19 4.5 82.6
18 42 10.0 92.6
19 31 7.4 100.0
Total 420 100.0
17th Preference
Frequency Percent Cumulative Percent
Product Profile
1 19 4.5 4.5
2 18 4.3 8.8
3 13 3.1 11.9
4 27 6.4 18.3
5 15 3.6 21.9
6 26 6.2 28.1
7 25 6.0 34.0
8 40 9.5 43.6
9 19 4.5 48.1
10 35 8.3 56.4
11 34 8.1 64.5
12 32 7.6 72.1
13 23 5.5 77.6
14 13 3.1 80.7
15 24 5.7 86.4
16 14 3.3 89.8
17 5 1.2 91.0
18 16 3.8 94.8
19 22 5.2 100.0
Total 420 100.0
18th Preference
Frequency Percent Cumulative Percent
Product Profile
1 19 4.5 4.5
2 11 2.6 7.1
3 24 5.7 12.9
4 30 7.1 20.0
5 20 4.8 24.8
6 27 6.4 31.2
7 29 6.9 38.1
8 23 5.5 43.6
9 44 10.5 54.0
10 28 6.7 60.7
11 26 6.2 66.9
12 12 2.9 69.8
13 14 3.3 73.1
14 16 3.8 76.9
15 11 2.6 79.5
16 20 4.8 84.3
17 22 5.2 89.5
18 18 4.3 93.8
19 26 6.2 100.0
Total 420 100.0
19th Preference
Frequency Percent Cumulative Percent
Product Profile
1 22 5.2 5.2
2 18 4.3 9.5
3 32 7.6 17.1
4 30 7.1 24.3
5 52 12.4 36.7
6 29 6.9 43.6
7 28 6.7 50.2
8 36 8.6 58.8
9 35 8.3 67.1
10 28 6.7 73.8
11 24 5.7 79.5
12 12 2.9 82.4
13 13 3.1 85.5
14 10 2.4 87.9
15 12 2.9 90.7
16 5 1.2 91.9
17 8 1.9 93.8
18 9 2.1 96.0
19 17 4.0 100.0
Total 420 100.0
Table 4: Model description
N of Levels Relation to Ranks or Scores
Name 3 Discrete
Weight 2 Discrete
Price 3 Linear (less)
Design 3 Discrete
Table 5: Utilities
Utility Estimate Std. Error
Name Basel -.062 .241
Mosko -.023 .282
Zenith .084 .282
Weight 70g .069 .181
150g -.069 .181
Design A* .273 .241
B* -.234 .282
C* -.039 .282
Price N100 .148 .218
N200 .295 .436
N250 .443 .653
Antiseptic No .030 .361
Yes .060 .722
(Constant) 8.144 .692
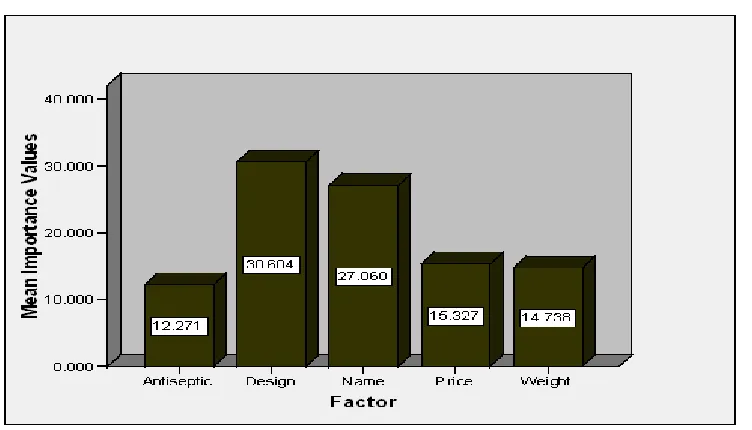
Table 6: Importance Values
Name 27.060
Weight 14.738
Design 30.604
Price 15.327
Antiseptic 12.271
Averaged Importance Score
Table 7: Coefficients
B Estimate
Price .148
Antiseptic .030
Table 8: Correlationsa
Value Sig.
Pearson's R .461 .036
Kendall's tau .250 .088
Kendall's tau for Holdouts -.333 .301
a Correlations between observed and estimated preferences
Table 9: Preference Scores of Simulationsa
Card Number ID Score
1 1 8.242
2 2 8.829
a Negative simulation scores or all zero simulation scores are found. This subject will not be included in
computing preference probabilities using the Bradley-Terry-Luce or Logit methods.
Tale 10: Preference Probabilities of Simulationsb
Card Number
ID Maximum
Utility(a)
Bradley-Terry-Luce
Logit
1 1 44.8% 49.0% 45.1%
2 2 55.2% 51.0% 54.9%
a Including tied simulations
b y out of x subjects are used in the Bradley-Terry-Luce and Logit methods because these subjects have all nonnegative scores.
Table 11: Number of Reversals
Factor Price 213
Antiseptic 212
Design 0
Weight 0
Name 0
Subject 1 Subject 1 2
2 Subject 2 1
3 Subject 3 2
4 Subject 4 0
5 Subject 5 0
6 Subject 6 0
7 Subject 7 1
8 Subject 8 1
9 Subject 9 2
10 Subject 10 1
11 Subject 11 1
12 Subject 12 2
13 Subject 13 0
14 Subject 14 1
15 Subject 15 1
16 Subject 16 1
17 Subject 17 1
18 Subject 18 2
19 Subject 19 2
20 Subject 20 0
21 Subject 21 1
22 Subject 22 1
23 Subject 23 2
24 Subject 24 1
25 Subject 25 1
26 Subject 26 1
27 Subject 27 0
28 Subject 28 2
29 Subject 29 1
30 Subject 30 0
31 Subject 31 0
32 Subject 32 2
33 Subject 33 2
34 Subject 34 1
35 Subject 35 0
36 Subject 36 2
37 Subject 37 1
38 Subject 38 2
39 Subject 39 2
40 Subject 40 1
41 Subject 41 0
42 Subject 42 1
43 Subject 43 2
44 Subject 44 1
45 Subject 45 0
46 Subject 46 1
47 Subject 47 1
48 Subject 48 1
49 Subject 49 2
50 Subject 50 0
51 Subject 51 1
52 Subject 52 0
53 Subject 53 1
54 Subject 54 0
55 Subject 55 1
56 Subject 56 1
57 Subject 57 2
58 Subject 58 1
59 Subject 59 1
60 Subject 60 1
61 Subject 61 1
62 Subject 62 1
63 Subject 63 1
64 Subject 64 1
65 Subject 65 1
66 Subject 66 0
67 Subject 67 1
68 Subject 68 1
70 Subject 70 1
71 Subject 71 1
72 Subject 72 1
73 Subject 73 1
74 Subject 74 1
75 Subject 75 1
76 Subject 76 1
77 Subject 77 1
78 Subject 78 0
79 Subject 79 2
80 Subject 80 0
81 Subject 81 0
82 Subject 82 1
83 Subject 83 1
84 Subject 84 0
85 Subject 85 0
86 Subject 86 2
87 Subject 87 2
88 Subject 88 1
89 Subject 89 0
90 Subject 90 0
91 Subject 91 0
92 Subject 92 1
93 Subject 93 1
94 Subject 94 1
95 Subject 95 1
96 Subject 96 1
97 Subject 97 0
98 Subject 98 0
99 Subject 99 1
100 Subject 100 1
101 Subject 101 2
102 Subject 102 0
103 Subject 103 2
104 Subject 104 2
105 Subject 105 2
106 Subject 106 2
107 Subject 107 0
108 Subject 108 0
109 Subject 109 2
110 Subject 110 0
111 Subject 111 1
112 Subject 112 0
113 Subject 113 0
114 Subject 114 1
115 Subject 115 2
116 Subject 116 2
117 Subject 117 0
118 Subject 118 1
119 Subject 119 1
120 Subject 120 0
121 Subject 121 2
122 Subject 122 2
123 Subject 123 2
124 Subject 124 1
125 Subject 125 1
126 Subject 126 1
127 Subject 127 1
128 Subject 128 2
129 Subject 129 2
130 Subject 130 1
131 Subject 131 1
132 Subject 132 0
133 Subject 133 1
134 Subject 134 1
135 Subject 135 0
136 Subject 136 2
137 Subject 137 1
138 Subject 138 1
139 Subject 139 0
140 Subject 140 0
141 Subject 141 1
142 Subject 142 1
143 Subject 126 1
144 Subject 144 1
145 Subject 145 1
146 Subject 146 2
147 Subject 147 2
148 Subject 148 1
149 Subject 149 0
150 Subject 150 2
151 Subject 151 1
152 Subject 152 2
153 Subject 153 2
154 Subject 154 2
155 Subject 155 0
156 Subject 156 0
157 Subject 157 1
158 Subject 158 0
159 Subject 159 1
160 Subject 160 1
161 Subject 161 1
162 Subject 162 0
163 Subject 163 0
164 Subject 164 1
165 Subject 165 1
166 Subject 166 0
167 Subject 167 1
168 Subject 168 1
169 Subject 169 1
170 Subject 170 1
171 Subject 171 1
172 Subject 172 0
173 Subject 173 0
174 Subject 174 1
175 Subject 175 1
176 Subject 176 1
177 Subject 177 1
178 Subject 178 2
179 Subject 179 0
180 Subject 180 2
181 Subject 181 1
182 Subject 182 2
183 Subject 183 1
184 Subject 184 1
185 Subject 185 2
186 Subject 186 2
187 Subject 187 2
188 Subject 188 1
189 Subject 189 1
190 Subject 190 2
191 Subject 191 2
192 Subject 192 1
193 Subject 193 2
194 Subject 194 2
195 Subject 195 1
196 Subject 196 0
197 Subject 197 1
198 Subject 198 2
199 Subject 199 1
200 Subject 200 1
201 Subject 201 0
202 Subject 202 1
203 Subject 203 1
204 Subject 204 1
206 Subject 206 1
207 Subject 207 1
208 Subject 208 2
209 Subject 209 2
210 Subject 126 1
211 Subject 211 1
212 Subject 212 0
213 Subject 213 1
214 Subject 214 1
215 Subject 215 0
216 Subject 216 2
217 Subject 217 1
218 Subject 218 1
219 Subject 219 0
220 Subject 220 0
221 Subject 221 1
222 Subject 222 1
223 Subject 223 1
224 Subject 224 1
225 Subject 225 1
226 Subject 226 2
227 Subject 227 2
228 Subject 228 1
229 Subject 229 0
230 Subject 230 2
231 Subject 231 1
232 Subject 232 2
233 Subject 233 2
234 Subject 234 2
235 Subject 235 0
236 Subject 236 0
237 Subject 237 1
238 Subject 238 0
239 Subject 239 1
240 Subject 240 1
241 Subject 241 1
242 Subject 242 0
243 Subject 243 0
244 Subject 244 1
245 Subject 245 1
246 Subject 246 2
247 Subject 247 0
248 Subject 248 0
249 Subject 249 0
250 Subject 250 1
251 Subject 251 1
252 Subject 252 2
253 Subject 253 1
254 Subject 254 1
255 Subject 255 2
256 Subject 256 0
257 Subject 257 1
258 Subject 258 1
259 Subject 259 1
260 Subject 260 1
261 Subject 261 2
262 Subject 262 2
263 Subject 263 0
264 Subject 264 1
265 Subject 265 1
266 Subject 266 2
267 Subject 267 1
268 Subject 268 1
269 Subject 269 1
270 Subject 270 0
271 Subject 271 2
272 Subject 272 1
273 Subject 273 0
274 Subject 274 0
275 Subject 275 2
276 Subject 276 2
277 Subject 277 1
278 Subject 278 0
279 Subject 279 2
280 Subject 280 1
281 Subject 281 2
282 Subject 282 2
283 Subject 283 1
284 Subject 284 0
285 Subject 285 0
286 Subject 286 0
287 Subject 287 1
288 Subject 288 1
289 Subject 289 1
290 Subject 290 1
291 Subject 291 1
292 Subject 292 1
293 Subject 293 0
294 Subject 294 1
295 Subject 295 1
296 Subject 296 2
297 Subject 297 0
298 Subject 298 2
299 Subject 299 2
300 Subject 300 2
301 Subject 301 2
302 Subject 302 0
303 Subject 303 0
304 Subject 304 2
305 Subject 305 0
306 Subject 306 1
307 Subject 307 1
308 Subject 308 0
309 Subject 309 1
310 Subject 310 2
311 Subject 311 2
312 Subject 312 0
313 Subject 313 1
314 Subject 314 1
315 Subject 315 0
316 Subject 316 2
317 Subject 317 2
318 Subject 318 2
319 Subject 319 1
320 Subject 320 1
321 Subject 321 1
322 Subject 322 1
323 Subject 323 2
324 Subject 324 2
325 Subject 325 1
326 Subject 326 0
327 Subject 327 1
328 Subject 328 0
329 Subject 329 1
330 Subject 330 1
331 Subject 331 2
332 Subject 332 1
333 Subject 333 1
334 Subject 334 1
335 Subject 335 1
336 Subject 336 1
337 Subject 337 1
338 Subject 338 1
339 Subject 339 1
340 Subject 340 0
342 Subject 342 1
343 Subject 343 2
344 Subject 344 1
345 Subject 345 1
346 Subject 346 1
347 Subject 347 1
348 Subject 348 1
349 Subject 349 1
350 Subject 350 1
351 Subject 351 1
352 Subject 352 0
353 Subject 353 2
354 Subject 354 0
355 Subject 355 0
356 Subject 356 1
357 Subject 357 1
358 Subject 358 0
359 Subject 359 0
360 Subject 360 2
361 Subject 361 2
362 Subject 362 1
363 Subject 363 0
364 Subject 364 0
365 Subject 365 0
366 Subject 366 1
367 Subject 367 1
368 Subject 368 1
369 Subject 369 1
370 Subject 370 0
371 Subject 371 0
372 Subject 372 0
373 Subject 373 1
374 Subject 374 1
375 Subject 375 2
376 Subject 376 0
377 Subject 377 2
378 Subject 378 2
379 Subject 379 2
380 Subject 380 2
381 Subject 381 0
382 Subject 382 0
383 Subject 383 2
384 Subject 384 0
385 Subject 385 1
386 Subject 386 1
387 Subject 387 0
388 Subject 388 1
389 Subject 389 2
390 Subject 390 2
391 Subject 391 0
392 Subject 392 1
393 Subject 393 1
394 Subject 394 0
395 Subject 395 2
396 Subject 396 2
397 Subject 397 2
398 Subject 398 1
399 Subject 399 1
400 Subject 400 1
401 Subject 401 1
402 Subject 402 2
403 Subject 403 2
404 Subject 404 1
405 Subject 405 1
406 Subject 406 1
407 Subject 407 1
408 Subject 408 1
409 Subject 409 2
410 Subject 410 2
411 Subject 411 0
412 Subject 412 1
413 Subject 413 1
414 Subject 414 2
415 Subject 415 1
416 Subject 416 1
417 Subject 417 1
418 Subject 418 0
419 Subject 419 2
420 Subject 420 1
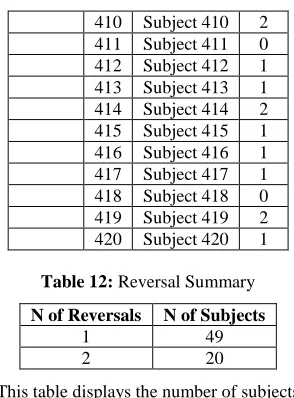
Table 12: Reversal Summary
N of Reversals N of Subjects
1 49
2 20
This table displays the number of subjects that have the given number of reversals.
Discussion of results
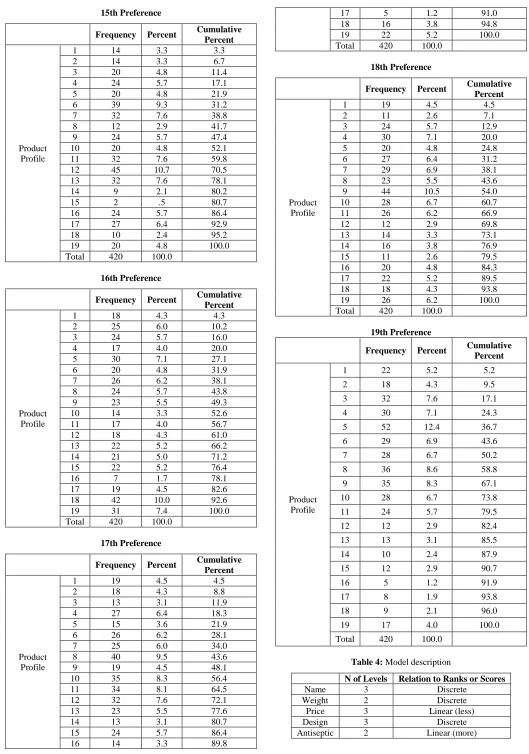
It can be deducted that of the four-hundred and twenty sampled customers, forty-five of them (highest frequency) representing 10.7% prefer product profile 4 (a soap named Basel, weighing 150g with antiseptic ingredient, package design A*, and costs N250) as their first choice while product profiles 15 attracts the least number (8, 1.9%) of customers.
As customers’ second choice, product profile 10 attracts the most number (40, 9.5%) of customers while product profile 2 attracts the least number (2, 0.5%) of customers.
As customers’ third choice, forty customers (highest frequency, 9.5%) prefer product profile 11 (a soap named Basel, weighing 150g with package design B*, costs N200, and has no antiseptic ingredient) while product profiles 3 attracts the least number (10, 2.4%) of customers.
As customers’ forth choice, product profile 8 (a soap named Zenith, weighing 150g with antiseptic ingredient, package design C*, and costs N100) attracts most number (43, 10.2%) of customers while product profile 4 attracts the least number (2, 0.5%) of customers.
As customers’ fifth choice, thirty-eight customers (highest, 9.0%) prefer product profile 10 (a soap named Mosko, weighing 150g with no antiseptic ingredient and having package design C*, and costs N250) while product profiles 3 and 8 attract the least number (8, 1.9%) of customers. As customers’ six choice, product profile 10 attracts the most number (36, 8.6%) of customers while product profile 7 attracts the least number (4, 1.0%) of customers.
Forty-four customers (highest, 10.5%) prefer product profile 2 (a soap named Basel, weighing 150g with package design A*, costs N100, and has no antiseptic ingredient) as their seventh choice while product profiles 7 attracts the least number (6, 1.4%) of customers.
As customers’ eighth choice, product profile 17 attracts the most number (49, 11.7%) of customers while product profile 8 attracts the least number (2, 0.5%) of customers. As customers’ ninth choice, product profile 18 attracts most number (36, 8.6%) of customers while product profile 9 attracts the least number (4, 1.0%) of customers.
Equal number of customers (33, 7.9%) chose product profiles 1, 2, and 17 as their most preferred tenth choice while product profiles 7 and 10 attract the least number (7, 1.7%) of customers.
as their eleventh choice while product profile 10 attracts the least number (5, 1.2%) of customers.
Equal number of customers (37, 8.8%) chose product profiles 6, and 17 as their most preferred twelfth choice while product profile 12 attracts the least number (6, 1.4%) of customers.
As customers’ thirteenth choice, product profile 7 attracts most number (42, 10.0%) of customers while product profile 13 attracts the least number (6, 1.4%) of customers. As customers’ fourteenth choice, product profile 7 attracts most number (38, 9.0%) of customers while product profile 14 attracts the least number (4, 1.0%) of customers.
As customers’ fifteenth choice, product profile 6 (a soap named Basel, weighing 750g with antiseptic ingredient, package design C*, and costs N100) attracts most number (39, 9.3%) of customers while product profile 15 attracts the least number (2, 0.5%) of customers.
Forty-two customers (highest, 10.0%) prefer product profile 18 as their sixteenth choice while product profile 16 attract the least number (7, 1.7%) of customers.
As customers’ seventeenth choice, product profile 8 attracts the most number (40, 9.5%) of customers while 17 attract the least number (5, 1.2%) of customers.
As customers’ eighteenth choice, product profile 9 (a soap named Basel, weighing 150g with antiseptic ingredient, package design B*, and costs N100) attracts the most number (44, 10.5%) of customers while product profiles 2 and 15 attract the least number (11, 2.6%) of customers. Finally, as customers’ nineteenth choice, product profile 5 attracts the most number (52, 12.4%) of customers while product profile 16 attracts the least number (5, 1.2%) of customers.
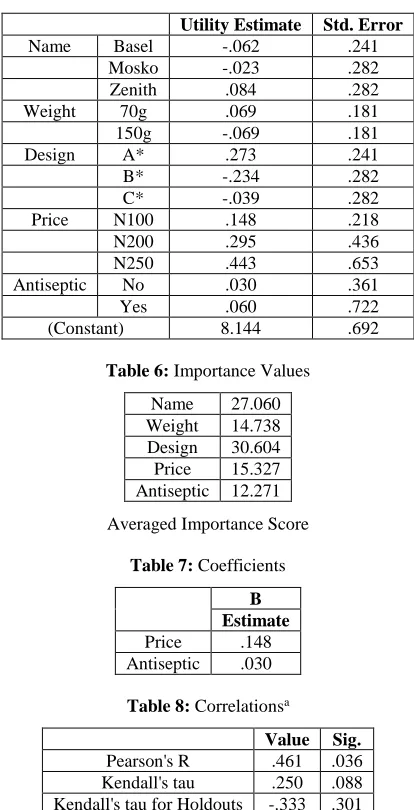
The utilities table (Table 5) shows the utility (part-worth) scores and their standard errors for each factor level. Higher utility values indicate greater preference. Unexpectedly, there is no inverse relationship between Soap price and utility, with higher price (N250) corresponding to higher utility (0.443), and a lower price of N100 corresponding to lower utility (0.148).
There is higher utility (0.069) for soap weighing 70g compared to soap weighing 150g (-0.069).
Zenith has higher utility (0.084) for soap name when compared to Basel and Mosko with utility values of -0.062 and -0.023 respectively.
Total Utility = utility (name) + utility (weight) + Utility (package) + utility (price) +
Utility (antiseptic) + constant
Table 13: Profile preference by Total Utility
Subject ID Soap Name Soap Weight Soap Price Package Design Antiseptic Total Utility Preference
1 Basel 70g N100 A* No 8.602 6
2 Basel 150g N100 A* No 8.464 10
3 Mosko 70g N100 B* Yes 8.164 17
4 Basel 150g N250 A* Yes 8.789 3
5 Mosko 150g N100 A* No 8.503 8
6 Basel 70g N100 C* Yes 8.320 13
7 Zenith 70g N250 B* No 8.536 7
8 Zenith 150g N100 C* Yes 8.328 12
9 Basel 150g N100 B* Yes 7.987 19
10 Mosko 150g N250 C* No 8.486 9
11 Basel 150g N200 B* No 8.104 18
12 Mosko 70g N200 A* Yes 8.272 15
13 Basel 70g N200 C* No 8.437 11
14 Zenith 150g N200 A* Yes 8.787 4
15 Zenith 70g N100 A* No 8.748 5
16 Basel 70g N250 A* Yes 8.927 2
17(a) Mosko 70g N250 A* No 8.936 1
18(a) Zenith 70g N100 B* Yes 8.271 16
19(a) Basel 70g N100 C* No 8.290 14
a Holdout
From the profile preference table above, it can be deduced that across the four-hundred and twenty (420) subjects for this study, product profile 17 would be the most preferred - a soap named Mosko, weighing 70g with package design A*, no antiseptic ingredient, and costs N250.
Product profile 9 would be the least preferred, which has a soap named Basel, weighing 150g with antiseptic ingredient, package design B*, and costs N100.
Table 6 (Importance values) provides a measure of the relative importance of each factor known as an importance score or value. The result shows that the package design has the most influence on overall preference. This means that there is a large difference in preference between product profiles containing the most desired package design and those containing the least desired package design.
The result also shows that soap name plays a significant role in determining overall preference but not as significant as the package design. Soap price and weight plays an
average role when compared with package design.
The inclusion of antiseptic ingredient plays the least role in determining overall preference.