(UDC: 629.35:533.6.071)
Modelling, simulation and validation of results with different car models
using wind tunnel and Star-CCM+
B. Prajwal*, D. Unune, A. aherwar, Jaikishan
Mechanical Engineering Department, Malaviya National Institute of Technology, Jaipur, India *Corresponding author [email protected]
Abstract
Aerodynamics is a branch of fluid mechanics associated with the fluid dynamics and fluid flow in and around the bodies. It involves the investigation of the fluid flow pattern measuring the required forces and other parameters such as velocity, pressure and density. In this paper we analysed a specified base car model with different combinations of connected diffusers, spoilers and bumpers, and with those attached, different design results are analysed in low speed wind tunnel and validated using Star-CCM+. Parameters that lead drag values closer to the experiment with less memory and computational time are identified. These investigations are carried out in star-CCM+ CFD package; however, the results can be applied to similar CFD codes.
Keywords: Drag force coefficient, lift force coefficient, air-velocity, base model, surface mesh, Star-CCM+.
1. Introduction
In fluid mechanical terms, road vehicles are bodies which are in very proximity to the ground. Their detailed geometric study is very complex. Internal and recessed cavities which communicate freely to the external flow (i.e. engine compartment, wheels, respectively) and rotating wheels add to their geometrical and fluid mechanical complexity (Hucho 1993). The flow over a vehicle is completely three-dimensional. Boundary layers around the body are turbulent. Flow separation in such cases is common and may be followed by re-attachment. Large turbulent wakes are formed at rear end and in many cases contain longitudinal trailing vortices (Hucho 1993).
Computational fluid dynamics (CFD) allows us to perform studies on road vehicle aerodynamics by means of relating them to the numerical simulation governing equations of physics. Owing to the large scale of lengths and time scales associated with the problem, a high degree of refinement in the finite element mesh or finite volume mesh is generally required, resulting in a very large computational requirement. Furthermore, fluid structure interaction problems influence each other. The structure deforms with the fluid force and the fluid follows the structure displacement (Castro et al. 2013). This interaction does not only mean that the fluid velocity equals the structure at the interface, but that the fluid domain changes as the consequence of the motion of structure. Now, the latest technologies and super computers enable numerical solving of these complex problems.
However, the experimental simulation is still preferred to numerical simulation in the study of vehicle aerodynamics and even in the analysis of the fluid-structure interactions due to the reliability of the wind tunnels. Also, the wind tunnel imitates the road tests and is a fast, cost-effective and reliable tool (Cooper 2004).
2. Road vehicle aerodynamics
Understanding the ground vehicle interactions allows us to optimize the operation of a wide spectrum on road vehicles that varies from passenger vehicles to commercial vehicles. Road vehicle interaction is a complex problem because it involves the interaction between the air flow and the ground. Besides the vehicle efficiency, the aerodynamics is directly related to the stability of vehicles. The fluid-vehicle interaction impacts the road holding stability and response to the crosswind. Furthermore, there are many issues related to the design of the vehicle on aerodynamics. It plays an important role on the accumulation of water droplets on the wind screen, headlights and back mirror, wind noise etc. In summary, the aerodynamics of a vehicle has a direct impact on the design, hence it requires a detail study of flow of air in and around it, including unsteady and turbulent flow phenomena.
А vehicle travelling on а road produces a drag mainly due to the pressure acting on it. The skin friction which is caused by viscous shear force is negligible and has a small contribution on the drag. Flow separation occurs at the rear side of the vehicle creating large re-circulation regions in the form of wakes, resulting in a lower pressure on the rear surface of the vehicle.
3. Factors affecting the aerodynamics forces
The aerodynamic forces acting on a body in motion in a fluid depend not only on the geometry of the body but also on the fluid and the interface between the fluid and the body. The two major types of forces acting on such a body are the pressure forces and the frictional forces. It is important to have boundary layer attached to the surface so as to avoid excessive wake formation. Aerodynamics is an indispensable aspect of automotive industry with benefits in all spheres such as improving the fuel efficiency, emission reduction, increased directional stability and better ride quality.
3.1 Drag force
The force a flowing fluid exerts on a body in the flow direction is said to be drag. Drag is caused due to the friction between the fluid and the solid surface and the pressure difference between the frontal and rear of the body. We tried to minimize the drag in order to reduce the fuel consumption, improve safety, stability and durability of the structures subjected to high winds, and to reduce noise and vibrations in the vehicle.
The drag coefficient is given by CD
𝐶𝐷= 𝜌𝑉2∗𝐹2𝐷𝐴 (1)
Where, CD = Coefficient of drag, FD= Drag force, ρ = Density of the air, V = Velocity of
the air, A = Frontal area (Area projected on a plane normal to the direction of flow).
3.2 Lift force
The force a flowing fluid exerts on a body in the normal direction to the flow that tends to move the body in the direction of the fluid flow is called lift. It is caused by the components of the pressure and wall shear forces in the direction normal to the flow. The lift coefficient is given by CL
𝐶𝐿= 2∗𝐹𝐿
𝜌𝑉2𝐴 (2)
Where, CL = Coefficient of lift, FL= Lift force, ρ = Density of the air, V = Velocity of the
air, A = Frontal area (Area projected on a plane normal to the direction of flow).
There are various methods to reduce the drag of a vehicle by use of the passive devices. Some of the examples are, front screens, rear screens, structural elements that localize the area of flow, spoilers, bumpers and diffusers.
4. Types of aerodynamics testing
Vehicles Aerodynamics can be studied in three ways: 1. Road testing i.e. Real world testing
CFD is the numerical tool to solve the equations of the fluid dynamics by suitable methods which can capture the essential physics of the fluid. What are the uses of CFD solution tools when we have wind tunnels?
a. With the development of better CAD models and simulation software it is very easy to analyse and modify the shapes so as to get the desired results. It does not only give an idea of the behaviour of the model in real life, but it also helps to identify the key factors affecting its aerodynamic characteristics.
b. Performing wind tunnel tests is expensive and moreover they can be done only when you have a prepared model but this software will help you do the analysis at the start of the development thus saving the initial cost and shortening the production cycles.
The wind tunnel test can be performed in software with two basic approaches: 1. Full Model and
2. Half Model.
4.1 Full Model Approach
This approach represents the real life situations. The compete model is kept in wind tunnel as in real life and calculations are done.
4.2 Half Model Approach
As the name suggests, here the object and the tunnel, the car and the tunnel in our case have to be cut along the plane of symmetry as shown later in the trials and the whole process is carried out on the half car model
There are a couple of advantages associated with this approach:
1. Less meshing time for complex geometries and it also allows the usage of finer mesh thus improving the quality of results
2. Better accuracy and 3. Less memory usage.
But there are some limitations as well such as: 1. Applicable only for symmetric bodies
2. Meshing along the plane of symmetries may pose some problems.
5. Experiment on wind tunnel
The wind tunnel tries to replicate the real world scenario but it is not possible to check for the specific problems such as vehicles drag when driving through a tunnel or its response to sudden wind gusts, or cross winds and the wakes of the passing vehicle. It can be used to calculate:
a. Force and moments acting on the body b. Surface pressure
c. Internal flows and
d. Internal flow measurements (ventilation).
A brief description of the wind tunnel would include: a. Type: Closed circuit
b. Cross sectional area: 759 meters square (smallest) c. Fan: 1.8 meter diameter fan and driven by a 37 KW motor d. Speed range: 6-52 m/s
e. Measurement: A six component balance method mounted with the ground board is used to measure and record the forces on the model and to measure lift force, drag force and pitching moment.
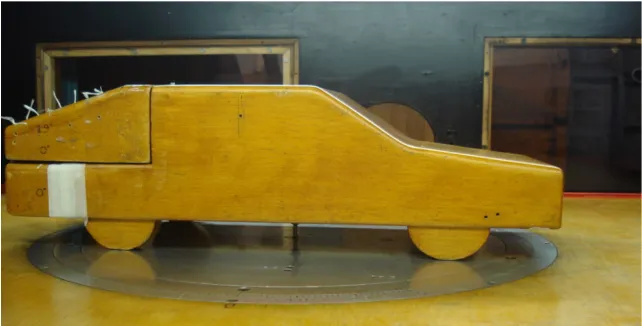
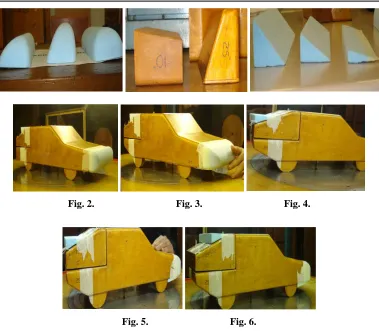
6. Different design trials
Various readings with different designs on the base model were tested in the wind tunnel. The following are some of the details of the models and experiments that were conducted.
Fig. 1. Base car in the wind tunnel
Fig. 2. Fig. 3. Fig. 4.
Fig. 5. Fig. 6.
Five designs shown in Figs. (2-6) below are different trials performed and the results are tabulated.
Guidelines followed:
1. Base mesh size: After performing a number of trial runs, it has been decided that the mesh size will be 0.05 for all the trials in Star CCM+.
2. Volume mesh: Volume mesh is performed with Polyhedral mesh for all the trials. 3. Turbulence model: Modelling the turbulence is a major issue for any CFD
simulation; all such simulations require a turbulence model. We used K Epsilon turbulence model for solving the simulation.
7. Governing equations
Turbulence plays an important role in many engineering processes which are influenced by convective transport. Since the direct numerical simulation of turbulent models are prohibitively expensive, eddy viscosity models based on the Reynolds Averaged Navier-Stokes (RANS) are commonly employed in CFD codes. One of the most common is k-ε model which is in use since 1970s (Juretic, Kozmar 2013).
𝜕𝑢
𝜕𝑡+𝑢.∇𝑢= −∇𝑝+ ∇. ((𝑣+𝑣𝑇)[∇𝑢+ ∇𝑢𝑇]), ∇.𝑢= 0, (3)
Where the kinetic viscosity v depends on the physical properties of the fluid, while 𝑣𝑇is the turbulent eddy viscosity which is supposed to emulate the effect of unresolved velocity fluctuation u’.
The k – ε model is based on the assumption that 𝑣𝑇 = ∁𝜇𝑘2
𝜀, where k is the turbulent kinetic energy and ε is the dissipation rate. The above PDE system is to be complemented by
two additional convectional diffusion-reaction equations for computation of k and ε.
𝜕𝑘
𝜕𝑡+∇.�𝑘𝑢 − 𝑣𝑇
𝜎𝑘∇𝑘�= 𝑃𝑘− 𝜀, (4)
𝜕𝑘
𝜕𝑡+∇.�𝜀𝑢 − 𝑣𝑇
𝜎𝜀 ∇𝜖�=
𝜀
𝑘(∁1𝑃𝑘− ∁2𝜀, (5)
Where, 𝑃𝑘= 𝑉𝑇2 |∇𝑢+ ∇𝑢𝑇|2 and ε are responsible for production and dissipation of turbulent kinetic energy, respectively. The default values of the empirical constants are as follows: ∁𝜇= 0.09, ∁1= 1.44, ∁2= 1.92,𝜎𝑘= 1, 𝜎𝜀= 1.3.
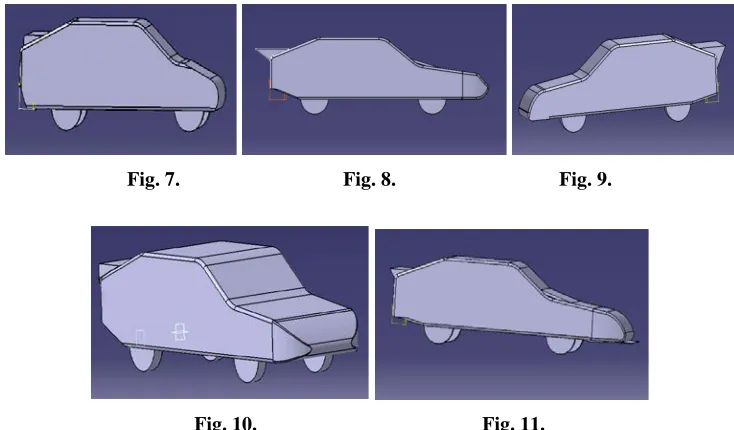
8. CAD modelling
Fig. 7. Fig. 8. Fig. 9.
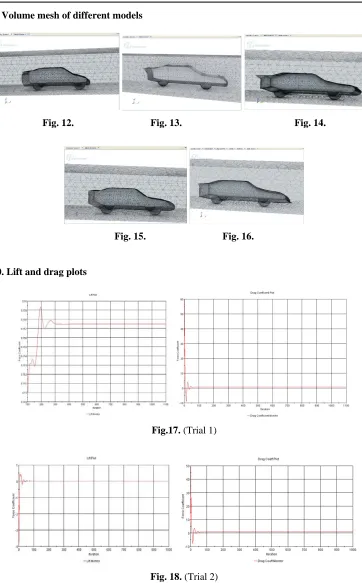
9. Volume mesh of different models
Fig. 12. Fig. 13. Fig. 14.
Fig. 15. Fig. 16.
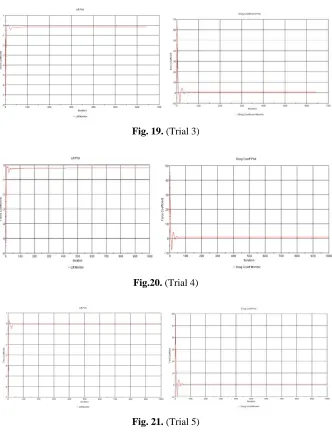
10. Lift and drag plots
Fig.17. (Trial 1)
Fig. 19. (Trial 3)
Fig.20. (Trial 4)
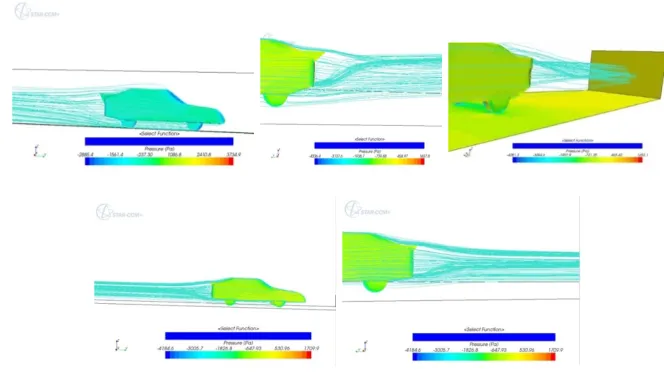
11. Stream line flow plots
12. Results and discussions
Various readings with different configurations done are listed below.
Zero Yaw Angle
Trial Number 1 2 3 4 5
Model length .52 m
Frontal Area .029 m2
Air Velocity (m/s)
48.22 48.22 48.24 48.30 48.04
Drag Force (N) 12.698 13.790 11.466 12.370 14.112
Side Force (N) -1.317 0.277 -0.997 -1.652 -1.488
Lift Force (N) 8.081 -1.452 3.211 1.798 -2.708
Drag Force Coefficient
0.335 .364 .302 .326 .374
Lift Force Coefficient
.213 -0.038 .085 .047 -.072
Table 1. Various readings with zero yaw angle
based on the fact that the stagnation point should be kept as low as possible, with splitter at the front side so as to reduce the amount of air flow and rear spoiler to avoid wake formation.
Извод
Моделирање, симулација и валидација резултата различитих модела
аутомобила коришћењем аеродинамичког тунела и
Star-CCM+
B. Prajwal*, D. Unune, A. aherwar, Jaikishan
Mechanical Engineering Department, Malaviya National Institute of Technology, Jaipur, India *главни аутор [email protected]
Резиме
Аеродинамика је грана механике флуида која се бави динамиком флуида и протоком флуида у и око тела. Она укључује испитивање образаца протока флуида којим се мере задате силе и други параметри као што су брзина, притисак и густина. У овом раду анализира се посебан основни модел аута са различитим комбинацијама повезаних дифузора, спојлера и браника, и уз њих, различити резултати дизајна анализирају се у нискобрзинским аеродинамичким тунелима и потврђују у Star-CCM+ софтверу.
Идентификовани су параметри који вучне вредности приближавају експерименту са мање потрошене меморије и времена. Ова испитивања вршена су у star-CCM+ CFD
софтверском пакету; међутим, резултати се могу применити и на сличне CFD кодове.
Кључне речи: коефицијент вучне силе, коефицијент силе подизања, брзина ваздуха,
основни модел, површинска мрежа, Star-CCM+.
References
Barnard RH (2001). Road Vehicle Aerodynamics Design. s.l.:Mechaero.
Castro HG, Paz RR, Storti MA, Sonzogni VE (2013). Computational study of unsteady road vehicle aerodynamics including fluid-structure interaction. Mecánica Computaciona, 32, 19-22.
Cooper KR (2004). Commercial Vehicle Aerodynamic Drag Reduction: Historical Perspective as a Guide. The Aerodynamics of Heavy Vehicles: Trucks, Buses, and Trains, 19, 9-28. Hucho Wh (1993). Aerodynamics of road vehicles. Annual review of Fluid Mechanics, 25,
485-537.
Juretic F, Kozmar H (2013). Computational modeling of the neutrally stratified atmospheric boundary layer flowusingthestandard k–e turbulence model. Journal of Wind Engineering and Industrial Aerodynamics, 115, 112-120.
Mayya R (2012). The wind tunnel performance investigation by using the modeling and simulation. Energy procedia, 19, 80-86.