_____________________________________________________________________________________________________
International
23(1): 1-12, 2019; Article no.JGEESI.50918
ISSN: 2454-7352
Determination of Hydro Geological and Petroleum
Potential Using High Resolution Aeromagnetic Data,
Over Matsina and Environs, Part of Nigerian Sector
of Chad Basin, North Eastern Nigeria
S. Kasidi
1*and S. N. Yusuf
21Department of Geology and Mining, Adamawa State University, Mubi, Nigeria. 2Department of Geology, University of JOS, Nigeria.
Authors’ contributions
This work was carried out in collaboration between both authors. Author SK designed the study, performed the statistical analysis, wrote protocol and wrote the first draft of the manuscript. Author SNY managed the analysis of the study and literature searches. Both authors read and approved the final manuscript.
Article Information
DOI: 10.9734/JGEESI/2019/v23i130160 Editor(s): (1) Dr. Iovine Giulio, CNR-IRPI (National Research Council – Institute of Research for the Geo-hydrologic Protection) of Cosenza, Italy. Reviewers: (1) Vinay Kumar Pandey, India. (2)Chung-Jen Wang, National Pingtung University of Science and Technology, Taiwan. Complete Peer review History:http://www.sdiarticle3.com/review-history/50918
Received 05 June 2019 Accepted 18 August 2019 Published 24 August 2019
ABSTRACT
Two dimensional spectral analyses of high resolution aeromagnetic data was carried out over matsina and environs North Eastern Nigeria to determine hydrocarbon and groundwater potentials. The analysis was done using Oasis Montaj version 8.2. The result obtained indicates the existence of two source depths. The shallower magnetic sources varies between 0.35 to 0.55 m and deeper magnetic sources also varies between 0.6 to 2000 m. The shallower magnetic sources could be as a result of basic intrusive within the Borno Basin, while the deeper sources correspond to the basement topography underlying the Chad formation. Comparing the result with what was obtained in Gubio, Maiduguri sub basin, it is apparent that the sedimentary thickness over Matsina and and Environs cannot be a potential site for oil exploration rather for ground water exploration.
Keywords: Aeromagnetic data; Chad formation; sub-basin intruusives; matsina; magnetic sources.
1. INTRODUCTION
The Nigerian sector of Chad Basin is a plain which slopes gently toward Lake Chad. It is devoid of rock outcrops except for Matsina area which have some exposures of younger granite. Chad Basin is covered with superficial deposits of sand stone and clay. It is the largest
sedimentary Basin which covered the
Northeastern part of Nigeria. The Chad Basin exhibit flat form of sedimentation in a geotectonic setting related to rifting [1]. The Nigerian sector of Chad basin is one-tenth total aerial extent of the Chad Basin which extends to Niger Republic, Chad and Cameroon. It is the part of West Central African Rift System (WCARS) that was formed in response to the Mechanical separation of the African crustal block in Cretaceous period [1].
The aim of this study is to interpret high resolution aeromagnetic data over MatsIna and environs in order to determine petroleum
potential of the study area using Spectral analysis and, to determine groundwater potential in the study area
1.1 Location of the Study Area
The study area (Matsina) is located in the Northern Part of Yobe state which lies between latitude 13°00I and 13°30IN and Longitude 10°00I and 10°30IE. It consist of many farm land, major road linking Matsina to Niger republic, Kano and other parts of Yobe State (Fig. 1).
1.2 Geology and Regional Geological Setting
The geology of the study area is mainly Chad formation with few outcrops of younger granite in Matsina town even though on a small scale which is not captured on the geologic map of Nigeria. The geology of the study area mainly Chad formation which consist of Sand and Clays (Fig. 2).
The Chad Basin lies within the vast area of Central and West Africa at an elevation of between 200 m and 500 m above sea level. The basin is centered around Lake Chad and occupies an area of approximately 2,500, 000 km
2
extending over parts of the Republic of Niger, Chad, Sudan and the northern portions of Cameroon and Nigeria [3]. The origin of the Chad Basin has been generally attributed to the rift system that developed in the early Cretaceous when the African and South American lithospheric plates separated and the Atlantic opened [4]. Pre Santonian Cretaceous sediments were deposited within the rift system. The Nigerian sector of the Chad Basin constitutes only about 6.5% of the entire basin and extends 152,000 km2 of territory in Borno, Bauchi, Plateau and Kano States. The altitude of the basin ranges from 300 m within the lake to about 530 m at the western margin, along a distance of about 240 km. The Basin has developed at the intersection of many rifts, mainly in an extension of the Benue Trough.
Major grabens then developed and
sedimentation started. Sedimentary sequence span from the Paleozoic to Recent accompanied by a number of stratigraphic gaps. Sediments are mainly continental, sparsely fossiliferous, poorly
sorted, and medium to coarse grained,
feldspathic sandstones called the Bima
Sandstone. A transitional calcareous deposit – Gongila Formation that accompanied the onset of marine incursions into the basin, overlies the Bima Sandstones.
The Chad basin is one of the several basins of the West and Central African rift system and is genetically related to the Benue Trough [6]. It consists of several sub-basin spread around the republics of Niger, Chad, Cameroon and Nigeria [7]. [4], has delineated the Nigerian sector of Chad basin into three sub-basins prosperous for hydrocarbon exploration. These are centered around Gubio to the SW, Maiduguri to the south and Lake Chad to the North. The Bima formation is the basal unit in the six sequence found in the basin. The deposition of this sequence of sand stone, Mudstone and occasional Shales of variable lithologies, textures, colours, and structures [6] began in Aptian to Albian [4] un conformably on the basement complex. Up to 5km of this formation have been encountered in drilled holes, while interpreted seismic sections suggest 7 to 8 km depth extent [8]. Mudstone and shale horizons within shallower parts have total organic content (TOC) between 0.09 and 0.82 [9]. Sandstone horizons with average of
13.74% [10] suggested forming possible
reservoir, while the shale horizons form possible cap and seal rocks.
2. MATERIALS AND METHODS
In every research work, the materials selected and the methods to be used must be well understood and relevant as it affects the outcome. This research work was carried out in three main stages, data acquisition, data processing and data interpretation
2.1 Data Acquisition
The aeromagnetic data used for this research
work, were obtained as high resolution
aeromagnetic data from Nigerian Geological Survey Agency [5]. The survey was carried at 0.05 seconds magnetic data recording interval, at 80 m terrain clearance; flight line spacing was 500 meters at 135 degrees flight line trend. Tie line spacing was 500 meters at 225 degrees tie line trend. Cesium vapor 3X SCINTREX CS3 magnetometer was used for the survey. The data was acquired by Fugro air borne survey Limited as part of the nationwide geophysical data acquisition. This data was generally plotted using Universal Transverse Mercator (UTM) projection method WGS 1984.
2.2 Data Processing
The data used for this research was processed using different filters in aeromagnetic data interpretation. These filters are commonly applied to remove spikes or noise and smoothened the grid data while preserving significant features. The goal is to select a filter and parameters that do not introduce artifacts into the data. The magnetic data was further subjected to polynomial filtering to obtained both regional and residual maps. The residual map obtained was used as an input data to carry out spectral analysis in order to determine depths to magnetic sources in the study area(sedimentary thickness). All these processes are carried out in a Geo soft software Oasis Montaj version 8.2.
Several methods have been developed and improved in order to automatically estimate the depths to magnetic source from gridded magnetic data [11,12,13,14,15]. This method like the horizontal gradient magnitude (HGM), the 3D analytic signal (AS) or total gradient (TG) and the local wave number (LW) methods, all have a common approach to automatically determine the depth to magnetic sources. All the methods are based on the transform of the potential field anomalies into spatial functions that form
gradient peaks and ridges over the sources. These maximum peak values are located directly above the magnetic source, depending on an assumed geometric model. Again the method can also use the same function to locate the contacts and estimate the source depths.
2.3 Spectral Analysis of Aeromagnetic Data
2.3.1 Fourier transformation
It has become a familiar concept to interpret aeromagnetic data with one or two dimensional
spectral analysis consisting of various
frequencies which characterize the anomalies. The amplitude and phase relationship among these frequencies constitute what is known as a "complex line spectrum". The relationship has been used extensively by several authors [16,17,18,19,20,9,21,22,23,24], interpreted total intensity magnetic map over Garkida and Environs statistically in terms of subsurface structures by using two-dimensional power spectral analysis. Very recently [21,22] utilized spectral analysis of a simplified mathematical formula for the interpretation of magnetic data over the Mutum Biyu and environs, Jalingo and environs Northeastern Nigeria.
In this research, the Fourier transform technique was applied to the residual magnetic data. As the authors mentioned and pointed out, if a residual Magnetic anomaly map of dimensions L x L, is digitized at equal intervals, the values can be expressed in terms of double Fourier series expansion.
T(x,y) =
M m m N n0 n mP
cos[(2π/L)(nx+m-p)]+Q
mnSin[(2π/L)(nx + my] (1)
Where L = length of the square side,
n m
P
andQ
mn = Fourier amplitudes andN, M = number of grid points along the X, Y directions.
The sum
n m
P
Cos [(2π/L)(nx+my)] +Q
mn sin [(2π/L)(nx + my)](2)
Represents a single partial wave having a particular direction and wavelength for which
n m
C
Is the amplitude of the partial wave, while the frequency of this wave is given2 / 1 2 2
)
(
n
m
f
nm
(4)If the logarithms of such an amplitude spectrum are plotted against the frequency (linear scale) one finds series of points which may be represented by one or more straight lines. The line segment in the higher frequency range is from the shallow sources and the lower harmonics are indicative of sources from deep – seatedmagnetic bodies. Then the slope of the segment is related to depths [16].
The Fourier transform of magnetic data digitized in a square grid forms a square matrix which can be reduced to a set of average amplitudes depending only on the frequency [17]. These average amplitudes fully represent a spectrum from, which the magnetic sources were estimated.
The use of Discrete Fourier transformation involves some practical problems, such as the problems of aliasing, truncation effect or Gibb's phenomenon and the problems associated with the even and odd symmetries of the real and imaginary parts of the Fourier transformation [19].
The aliasing effect arises from the ambiguity in the frequency represented by the sampled data. Frequencies greater than the Nyquist frequency,
which tends to impersonate the lower
frequencies are known as the aliasing effect. To avoid or reduce the effect of aliasing, frequencies, greater than the Nyquist frequency must be removed through the use of an aliasing filter, which provides high attenuation above the Nyquist frequency. Aliasing can also be reduced through the use of small sampling intervals such that, the Nyguist frequency is equal to or greater than the highest frequency component present in the function being analyzed.
When a limited portion of an aeromagnetic anomaly map or short profile is subjected to Fourier analysis, it is difficult to reconstruct the sharp edges of the anomaly with a limited number of frequencies and this produces what is known as the Gibb's phenomenon. This Gibbs phenomenon or truncation effect is equivalent to the convolution of the Fourier transform of the function with that of a rectangular window which is a sine cardinal function. This convolution
introduces ripples at the edges of the function, which manifests itself as spurious oscillations at the discontinuity. Increasing the length of the window makes the Fourier transform tend towards a delta function, with subsequent reduction of the ripples at the edges. The truncation effect can therefore be reduced by selecting a large portion of anomaly or a long profile centered on the feature of interest. An alternative and more effective approach to reducing the truncation effect is by the application of cosine taper to the observed data [19].
In this analysis, some practical problems, such as the problems of aliasing, truncation effect or
Gibb's phenomenon and the problems
associated with the even and odd symmetries of the real and imaginary parts of the Fourier transformation [19], has been incorporated into the computer program
In order to carry out spectral analysis, data of the study area were divided into sixteen (16) blocks, even though the first four blocks have no data because it extend into Niger Republic. So the data begins in block five
3. RESULTS
In this section, the results of the findings are presented inform of figures graphs and tables.
4. DISCUSSION OF RESULTS
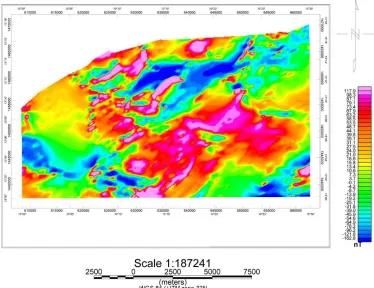
The total magnetic intensity map (Fig. 3) of the study area was used as the input data in the software which subjected to regional residual separation to produce residual map (Fig. 4) of the study area. The residual map shows magnetic anomalies with high and low intensity values which ranges between -2.6 to 2.6 nT which spread across the study area as shown by colour legend. Like the residual data was used as the input data to perform the spectral analysis
in order to achieve the aforementioned
objectives.
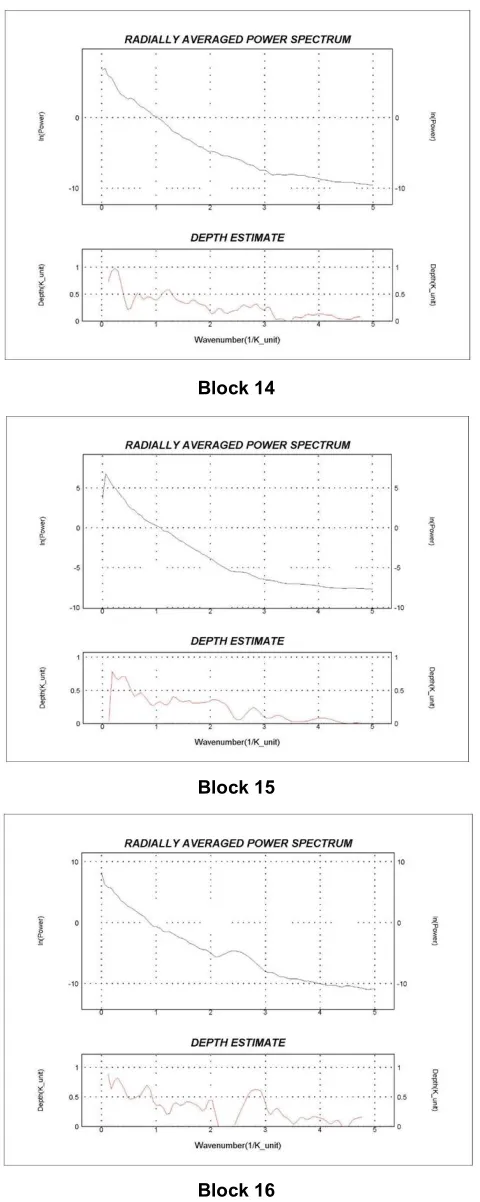
The results for determination of depth to
magnetic sources for Petroleum and
range between 0.35 to 0.55 km, while the deeper sources range between 0.6 to 2.0 km. These values were obtained from Fig. 5 i.e the radial average spectrum of blocks 5-16, which was displayed on Table 1.The depth to magnetic
sources normally represent the thickness of sedimentary cover in an area and the sedimentary thickness gives the idea for oil and water exploration.
Fig. 3. Total magnetic intensity map (TMI) of the study area
Block 5
Bock 6
Block 8
Block 9
Block 11
Block 12
Block 14
Block 15
Block 16
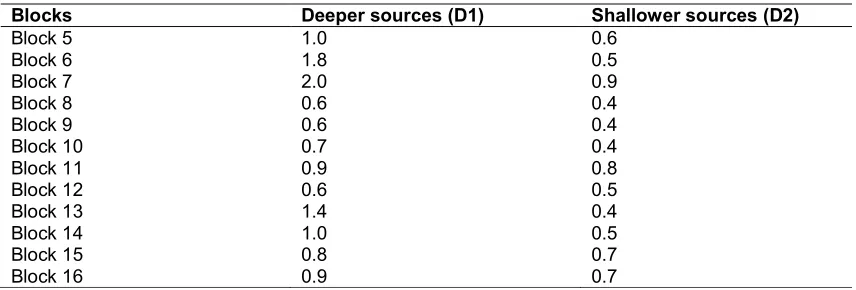
Table 1. Average depth to magnetic sources in Matsina (km)
Blocks Deeper sources (D1) Shallower sources (D2)
Block 5 1.0 0.6
Block 6 1.8 0.5
Block 7 2.0 0.9
Block 8 0.6 0.4
Block 9 0.6 0.4
Block 10 0.7 0.4
Block 11 0.9 0.8
Block 12 0.6 0.5
Block 13 1.4 0.4
Block 14 1.0 0.5
Block 15 0.8 0.7
Block 16 0.9 0.7
The existence of two source depth in Matsina and Environs is as a results of intrusion of younger granite given a thin sedimentary cover in the study area compared to what is obtained in other parts of Borno Basin. The deeper sources in this area which range between 0.6 to 2.0 km may not support exploration of Petroleum due to the thickness of sedimentary cover compared to areas like Gubio Basin, Gajigana, Magumeri, which are known to have thick sedimentary cover of 6.0 km and above. This area was affected by upwelling of younger granite during the Pan African orogeny, the heat due to long time cooling of the magma after intrusion might affect the hydrocarbon accumulation in the area.
5. CONCLUSION
Therefore, based on the results, it is considered that all areas of deeper or thick sedimentary cover which ranges between 0.6 to 2.0 km are potential site for groundwater exploration in the study area. By implication the study area may no be suitable for hydrocarbon exploration due thin sedimentary cover and up arching of younger granite.
ACKNOWLEDGEMENT
The authors are grateful to the Nigerian Geological Survey Agency (NGSA) for releasing the aeromagnetic data at subsidize rate and to the Geosoft for providing Oasis Montaj software which was used for processing the data.
COMPETING INTERESTS
Authors have declared that no competing interests exist.
REFERENCES
1. Okosun EA. Review of the geology of
Bornu Basin. Journal of Mining and Geology. 1995;31(2):113-112.
2. United State geological Survey geographic
information data base; 2012.
3. Alkali SC, Kasidi S. Determination of depth
to magnetic sources using spectral
analysis of high resolution aeromagnetic data over IBBI and environs, middle Benue trough, North Central Nigeria. IJSR. 2015;5:1572-1578.
4. Cratchley CR, Jones GP. An interpretation
of the geology and gravity anomalies of the Benue Valley, Nigeria. Overseas Geol. Surv. Geophysics. 1965;1:1-26.
5. Nigeria Geological survey Agency.
Geological map of Nigeria, Scale 1: 2,000,000; 2006.
6. Burke K, Dessauvagie TFJ, Whiteman AJ.
Geological history of the Benue valley, and adjacent areas. In: Dessauvagie TFJ, Whiteman AJ, (eds). African geology, Ibadan University press, Ibadan. 1972;187-206.
7. Genik GJ. Regional framework, structural
and petroleum aspects of rift basins in Niger, Chad and central Africa Republic (C.A.R). Tectonophysics. 1992;213:169-185.
8. Avbovbo AA, Ayoola EO, Oshahon SA.
Depositional and structural styles in Chad basin in Northeaster Nigeria. Bull. Amer. Asso. Pet, Geol. 1986;20(71):1787-1798.
9. Nur A, Ofoegbu CO, Onuoha KM.
Estimation of the depth to the curie point Isotherm in the upper Benue trough, Nigeria. Jour. Min. Geol. 1999;35(1):53-60.
10. Nwankwo CN, Cyril N, Ekine AS, Nwosu
the Chad Basin Nigeria. Journal of Applied Sciences and Environmental Management. 2009;13:73-80.
11. Blakely RJ, Simpson RW. Approximating
edges of source bodies from Magnetic or gravity anomalies: Geophysics. 1986; 51(7):1494-1498.
12. Grauch VJS, Cordell L. Limitation on
determining density or magnetic
boundaries from horizontal gradient of gravity or pseudogravity data: Geophysics. 1987;52(1):118-121.
13. Roest WR, Verhoef J, Pilkington M.
Magnetic interpretation using the 3-D Analytic signal: Geophysics. 1993;57(1): 116-125.
14. Thurston JB, Smith RS. Automatic
conversion of magnetic data to depth, dip and susceptibility contrast using the SPI method: Geophysics. 1997;62(3):807-813.
15. Smith RS, Thurston JB, Dai Ting-Fan,
MacLeod IN. The improved source parameter imaging method: Geophysical Prospecting. 1998;46:141-151.
16. Spector A, Grant FS. Statistical models
for interpreting aeromagnetic data.
Geophysics. 1970;35:293-302.
17. Hahn AE, Kind G, Mishra DC. Depth
estimation of rnagnetic sources by means of Fourier amplitude spectra. Geoph. Prospect. 1976;24:287–309.
18. Negi JG, Agrawal PK, Rao KN. Three
dimensional model of the Konya area of
Maharashtra State (India) based on the spectral analysis of aeromagnetic data. International Journal of Science and Research. 1983;1(2):47-53.
19. Ofoegbu CO, Onuoha KM. Analysis of
magnetic data over the Abakaliki
Anticlinorium of the lower Benue Trough, Nigeria. Marine and Petr. Geol. 1991; 8:174-183.
20. Nur A, Ofoegbu CO, Onuoha KM. Spectral
analyses of aeromagnetic data over Middle Benue Trough Nigeria: Journ. Min. Geol. 1994;30(2):211-217.
21. Kasidi S, Nur A. Analysis of aeromagnetic data over Mutum-Biyu an environs, North-Eastern Nigeria. International Research Journal in Engineering and Applied Sciences. 2012a;2(1):142- 148.
22. Kasidi S, Nur A. Spectral analysis of magnetic data over jalingo and environs north-eastern Nigeria. International Journal of Science and Research. 2013;2(2):447-454.
Available:www.ijsr.net
23. Nur A, Kamurena E, Kasidi S. Analysis of aeromagnetic data over Garkida and Environs, North-Eastern Nigeria. Global Journal of Pure and applied Sciences. 2011;17(2):209–214.
24. Nur A. Analysis of aeromagnetic data over
Yola arm of the Benue Trough, Nigeria. Mining and Geol. 2000;36(1):77–84.
_________________________________________________________________________________
© 2019 Kasidi and Yusuf; This is an Open Access article distributed under the terms of the Creative Commons Attribution License (http://creativecommons.org/licenses/by/4.0), which permits unrestricted use, distribution, and reproduction in any medium, provided the original work is properly cited.
Peer-review history:
![Fig. 1. Location map of the study area [2]](https://thumb-us.123doks.com/thumbv2/123dok_us/8375576.1676763/2.612.99.517.378.677/fig-location-map-study-area.webp)
![Fig. 2. Geological map of the study area [5]](https://thumb-us.123doks.com/thumbv2/123dok_us/8375576.1676763/3.612.121.491.429.693/fig-geological-map-study-area.webp)