_____________________________________________________________________________________________________
Lipid Profile and Prevalence of Dyslipidemia in Pre-
and Postmenopausal Women in Yaounde, Cameroon
Nkeunen Gerard
1*, Tsafack Takadong Julie Judith
2, Simo Gustave
1,
Betrand Ayuk Tambe
2,3, Ayangma Celestin Roger
4and Tume Christopher Bonglavnyuy
11
Department of Biochemistry, Faculty of Science, University of Dschang, P.O.Box 67, Dschang, Cameroon.
2Centre for Food and Nutrition Research, IMPM-MINRESI, P.O.Box 6163 Yaounde, Cameroon. 3
Department of Global Health, Division of Human Nutrition, Stellenbosch University, P.O.Box 241, Cape Town, South Africa.
4Hôpital Militaire de Yaounde, Cameroon.
Authors’ contributions
This work was carried out in collaboration among all authors. Authors NG and TTJJ designed the study, authors NG, TTJJ, BAT, SG, ACR and TCB performed the analysis, Author NG wrote the protocol and wrote the first draft of the manuscript. Author NG managed the analyses of the study. All authors read and approved the final manuscript.
Article Information
DOI: 10.9734/IJBCRR/2019/v25i430081 Editor(s): (1) Dr. Muhammad Farhan Jahangir Chughtai, Assistant Professor, Khwaja Fareed University of Engineering & Information Technology, Rahim Yar Khan, Pakistan.
Reviewers: (1) Oshim, Ifeanyi Onyema, Nnamdi Azikiwe University, Nigeria.
(2) Dennis Amaechi, Veritas University Abuja,Nigeria. Complete Peer review History:http://www.sdiarticle3.com/review-history/48605
Received 13 February 2019 Accepted 24 April 2019 Published 10 May 2019
ABSTRACT
Aims: Lipids serve several important physiologic functions like energy homeostasis or biosynthesis of hormone within the human body. The deterioration of lipid metabolism which is favoured by menopause is the source of cardiovascular diseases. This study aimed to determine the plasma lipid profile and dyslipidemia prevalence of some Cameroonian women.
Study Design: This was a cross-sectional study.
Place and Duration of Study: The enrollment took place at the Yaounde Military Hospital from November 2016 to July 2017.
participants were enrolled in this study. 5ml of blood were collected on EDTA coated tubes from each participant. Enzymatic methods were used to evaluate total cholesterol, HDL cholesterol and triglyceride, while LDL cholesterol was determined using the Friedewald equation. These biological parameters were used to determine dyslipidemia. Thereafter, they were compared within age and year since menopause subgroups.
Results: There was no significant difference in the mean values of total cholesterol, HDL-C, LDL-C as well as triglyceride between premenopausal and postmenopausal women. The mean HDL-C concentration was stable in the age subgroups while the mean total cholesterol and LDL-C were slightly increasing as postmenopausal participants got older. LDL-C level was significantly higher in women who had been in menopause for more than 15 years. The overall dyslipidemia prevalence was 53%. Dyslipidemia was significantly higher in the subgroup of women who had freshly entered menopause.
Conclusion: Even though there was no change in the mean concentration of the plasma lipid parameters, of pre- and postmenopausal participants there was a general need to improve their lifestyle in order to reduce dyslipidemia prevalence.
Keywords: Lipid profile; dyslipidemia; premenopausal; postmenopausal; total cholesterol; LDL cholesterol; HDL cholesterol; triglyceride.
1. INTRODUCTION
Lipids serve several important physiologic
functions like energy homeostasis or
biosynthesis of hormone within the human body. They can also lead to major health issues. Dyslipidemia is a primary risk factor for atherosclerotic cardiovascular disease (ASCVD) and may even be a prerequisite for ASCVD, occurring before other major risk factors come into play [1]. Menopause is defined as the permanent cessation of menstruation resulting from the loss of ovarian follicular activity [2]. During this period, there is a cessation of ovarian estrogen production.
The deterioration of the plasma lipid profile is one of the cardiovascular disease risk factors favoured by estrogen deficiency. Studies have shown relations between postmenopausal status and elevated concentrations of total cholesterol (TC) and low-density lipoprotein cholesterol (LDL-C) [3,4,5]. The difference in mean TC observed among postmenopausal women and premenopausal women may reach 0.8 mmol/l [6]. Women are at lesser risk of developing
cardiovascular disease than their male
counterparts before menopause. However,
mortality from cardiovascular events is higher in women after menopause (53.8%) than in men (49%) [7]. Menopausal estrogen decline is associated with adverse metabolic changes such as insulin resistance and dyslipidemia which is characterized by high triglyceride (TG) levels, low high-density lipoprotein cholesterol (HDL-C) and an increased frequency of small dense low-density lipoprotein particles. The importance of
estrogens in the development of metabolic diseases during menopause is disputed. Both menopause and lipids are highly correlated with age; it remains unclear whether menopausal lipid changes are independent of age effects [8,9].
Cross-sectional studies have been done in Europe [10,11,12], Asia [6] and America [13] on the lipid profile in premenopausal women versus postmenopausal. Women represent more than half of the Cameroonian population and they will be now spending more of their life in the postmenopausal state because of an increase in life expectancy. It is, therefore, necessary to evaluate all parameters leading to the promotion of knowledge of menopause-related metabolic diseases. Data on lipid metabolic changes and dyslipidemia among women in the Central Africa sub-region and in Cameroon particularly are non-existent. Our study hypothesized that plasma lipid profile and dyslipidemia could be affected by age, menopausal status, as well as menopausal duration. Thus, this cross-sectional study aimed to determine the plasma lipid profile and
dyslipidemia prevalence in pre- and
postmenopausal women living in Yaounde, Cameroon.
2. MATERIALS AND METHODS
2.1 Study Area and Study Population
Participants were premenopausal and
from loss of ovarian follicular activity for at least 12 months. The enrollment took place at the Yaounde Military Hospital from November 2016 to July 2017. The aim of the study was first explained to prospective participants. This process was done in markets, schools, offices,
churches, gatherings and the hospital.
Volunteers were invited to the Yaounde Military Hospital for enrollment. The enrolled participants were grouped into postmenopausal (105) and premenopausal (127) apparently normal women. All women under any medication interfering with lipid metabolism were excluded. Participants with known pathology of lipid metabolism, diabetes or major heart, liver or kidney diseases or malignancies were also excluded. Premeno-pausal participants were divided into 4 age range subgroups: 18-27, 28-37, 38-47 and more than 47 years while postmenopausal participants were instead divided into 3 subgroups: 45-54, 55-64 and more than 64 years. Postmenopausal women were further shared in 4 sets according to the length of their menopausal state. These sets were respectively: 1-5, 6-10, 11-15, and more than 15 years since menopause (YSM).
2.2 Data and Samples Collection
Anthropometric parameters (height, weight, waist and hip circumferences) were taken and the body mass index (BMI) and waist to hip ratio
(WHR) was calculated as weight (Kg) / height
(m)2 and waist/hip respectively. The participants
attended the laboratory in the morning after 12 hours overnight fast. A volume of 5ml of venous blood sample was then collected in EDTA coated tubes. Plasma was separated by centrifugation at 3000 rpm for 10 minutes and aliquots were stored at 70°C until analysis. EDTA tubes give Homogeneous mixing. Used for whole blood hematology testings, Immunohematology testing & Blood donor screening.
2.3 Biochemical Analysis
Biochemical analysis was performed on the plasma sample of each enrolled participant in order to determine the concentrations of total cholesterol, HDL-C, and triglyceride. The kits and reagents used were from BIOLABO. Each of these biochemical parameters was measured with a semi-automated analyzer (Kenza Max Biochemistry from BIOLABO) following the manufacturer instructions.
Total cholesterol level was determined as
described by Allain et al. [14]. The enzymatic
CHOD PAP method is a succession of three reactions in which quinoneimine, (a pink complex) is formed from cholesterol esters.
Plasma samples were treated by
phosphotungstic acid (PTA) and magnesium chloride. After centrifugation, HDL cholesterol obtained in the supernatant was measured by the total cholesterol reagent.
Triglyceride concentration was evaluated by the Fossati and Prencipe [15] associated with Trinder [16] reaction. This is a succession of reactions in which quinoneimine is formed from triglycerides.
LDL cholesterol plasma concentration was obtained by Friedewald et al. [17] equation: [LDL-chol] = [Total chol] - [HDL-chol] - ([TG]/5). None of the participants had plasma TG > 400 mg/dL thus the calculation of LDL-C by Friedwald equation was appropriate.
2.4 Dyslipidemia
Dyslipidemia was defined according to the criteria of the National Cholesterol Education Program Adult Treatment Panel III [18].
Hypercholesterolemia was declared for
participants with either a total cholesterol ˃ 200 mg/dL or an LDL cholesterol ˃ 130 mg/dL while
HDL hypocholesterolemia was at HDL
cholesterol ˂ 40 mg/dL. Hypertriglyceridemia was declared for triglyceride plasma level ˃ 150 mg/dL. A combination of hypercholesterolemia and hypertriglyceridemia was classified as mixed hyperlipidemia while atherogenic dyslipidemia was a combination of HDL hypocholesterolemia,
hypertriglyceridemia and LDL
hypercho-lesterolemia.
2.5 Data Analysis
Data were cleaned, coded and entered using Microsoft Excel and exported to EPI info 7 for statistical analysis. Data were presented as mean ± SD for continuous variables and percentages and frequencies for categorical
variables. Variables were analyzed using
3. RESULTS AND DISCUSSION
3.1 Subject Characteristics
In this study, a total of 232 participants were enrolled and divided into two sets. The first set was 105 (45.3%) postmenopausal women between 45 and 81 years with a mean age of 57.8 ± 7.4 years, a mean waist circumference of 100 ± 10 cm and a mean BMI of 30.4 ± 6.4
Kg/m2. The second set was 127 (54.7%)
premenopausal women between 18 and 61 years. Their mean age was 31.9 ± 10.0 years while their mean waist circumference and BMI
were 80 ± 20 cm, and 27.3 ± 6.2 Kg/m2
respectively. Table 1 shows more details on the descriptive characteristics of the participants. Waist circumference, as well as BMI, was
significantly higher in postmenopausal
participants when compared to premenopausal.
3.2 Lipid Profile
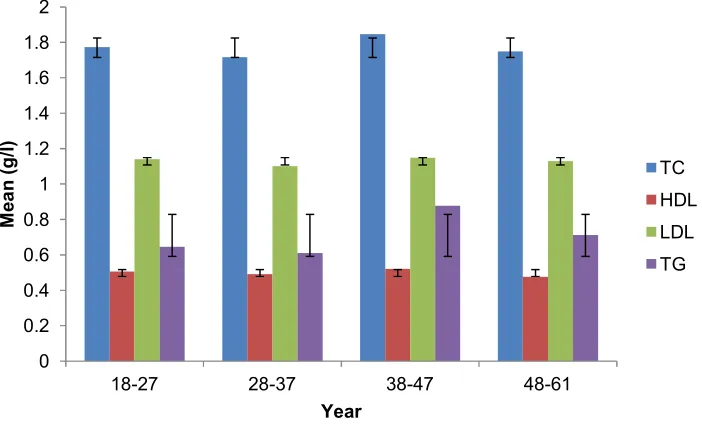
There was no significant difference in the mean values of total cholesterol, HDL-C, LDL-C as well as triglyceride between premenopausal and postmenopausal participants (Table 1). The mean HDL-C and LDL-C plasma concentrations were stable among the various age sub groups in premenopausal participants (Fig. 1). In
Table 1. Descriptive and biochemical characteristics
Variables Premenopausal Postmenopausal P value
Age (year) 31.9 ± 10.0 57.8 ± 7.4 .00*
Height (m) 1.6 ± 0.7 1.6 ± 0.6 .35
Weight (kg) 72.5 ± 16.5 79.5 ± 16.9 .34
Waist (m) 0.8 ± 0.2 1.0 ± 0.1 .00*
Hip (m) 1.0 ± 0.2 1.1 ± 0.1 .03*
BMI (Kg/m2) 27.3 ± 6.2 30.4 ± 6.4 .00*
WHR 0.9 ± 0.6 0.9 ± 0.9 .45
Total Cholesterol (g/l) 1.8 ± 0.4 1.9 ± 0.4 .37
HDL Cholesterol (g/l) 0.5 ± 0.1 0.5 ± 0.2 .64
LDL Cholesterol (g/l) 1.1 ± 0.4 1.2 ± 0.4 .43
Triglyceride (g/l) 0.7 ± 0.3 0.9 ± 0.4 .45
WHR: waist to hip ratio, BMI: Body mass Index, * Statistically significant
Fig. 1. Lipid profile of premenopausal participants according to age group
TC: total cholesterol, HDL: High-density lipoprotein, LDL: Low-density lipoprotein, TG: Triglyceride 0
0.2 0.4 0.6 0.8 1 1.2 1.4 1.6 1.8 2
18-27 28-37 38-47 48-61
M
e
a
n
(
g
/l
)
Year
TC
HDL
LDL
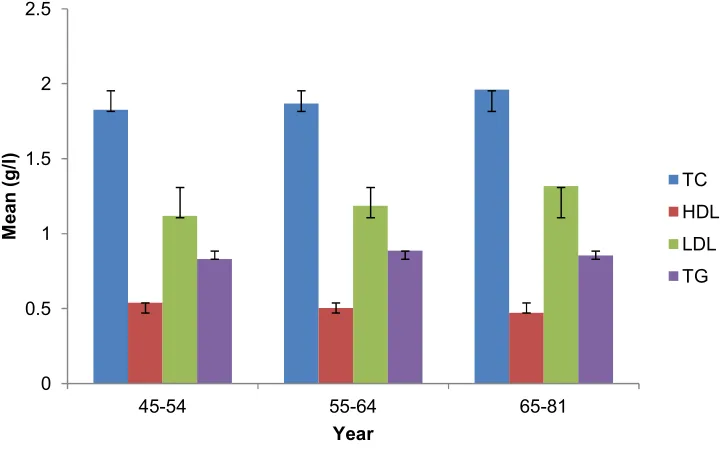
Fig. 2. Lipid profile of postmenopausal participants according to age group
TC: total cholesterol, HDL: High-density lipoprotein, LDL: Low-density lipoprotein, TG: Triglyceride
Table 2. Lipid profile according to the duration of menopause
Total cholesterol (g/l)
HDL cholesterol (g/l)
LDL cholesterol (g/l)
Triglyceride (g/l)
YSM (year)
1-5 1.8 ± 0.4 0.6 ± 0.2 1.1 ± 0.3 0.8 ± 0.4
6-10 1.8 ± 0.4 0.5 ± 0.1 1.2 ± 0.3 0.8 ± 0.3
11-15 1.8 ± 0.2 0.5 ± 0.1 1.1 ± 0.2 0.9 ± 0.4
˃15 2.1 ± 0.4 0.5 ± 0.2 1.4 ± 0.2 1.0 ± 0.4
P value .05 .15 .02* .41
Data are presented as mean±SD, YSM: year since menopause, * statistically significant
Table 3. Prevalence of dyslipidemia in pre- and postmenopausal participants
Overall n=232 n (%)
Premenopausal n=127 n (%)
Postmenopausal n=105 n (%)
P value
Dyslipidemia 123 (53.0) 58 (45.6) 64 (61.0) .03*
Hypercholesterolemia 88 (37.9) 46 (36.2) 42 (40.0) .55
HDL hypocholesterolemia 52 (22.4) 24 (18.9) 28 (26.7) .08
LDL hypercholesterolemia 78 (33.6) 42 (33.1) 36 (34.3) .42
Hypertriglyceridemia 11 (4.7) 3 (2.4) 8 (7.6) .44
Atherogenic dyslipidemia 2 (0.9) 1 (0.8) 1 (1.0) .89
Mixed hyperlipidemia 4 (1.7) 2 (1.6) 2 (1.9) .84
* statistically significant
contrary, as highlighted in Fig. 2, only the mean HDL-C was stable in postmenopausal women while the mean total cholesterol and LDL-C plasma concentrations were slightly increasing as the postmenopausal participants got older. Detail analysis showed that there was no
triglyceride variation pattern observed in both pre- and postmenopausal women according to the age subgroups.
As shown in Table 2, there was a significantly
higher (P = .02) mean plasma LDL-C level
0 0.5 1 1.5 2 2.5
45-54 55-64 65-81
M
e
a
n
(
g
/l
)
Year
TC
HDL
LDL
Table 4. Dyslipidemia related to age category in premenopausal participants
Age group (year) 18-27 (n=62)
n (%)
28-37 (n=25) n (%)
38-47 (n=29) n (%)
≥48 (n=11) n (%)
P value
Dyslipidemia 30 (48.4) 11 (44.0) 14 (48.3) 4 (36.4) .33
Hypercholesterolemia 25 (40.3) 7 (28.0) 11 (37.9) 3 (27.3) .38
HDL hypocholesterolemia 11 (17.7) 7 (28.0) 5 (17.2) 1 (9.1) .54
LDL hypercholesterolemia 23 (37.1) 7 (28.0) 9 (31.0) 3 (27.3) .80
Hypertriglyceridemia 0 (0.0) 0 (0.0) 3 (10.3) 0 (0.0) .02*
Atherogenic dyslipidemia 0 (0.0) 0 (0.0) 1 (1.3) 0 (0.0) .22
Mixed hyperlipidemia 0 (0.0) 0 (0.0) 2 (6.9) 0 (0.0) .08
* statistically significant
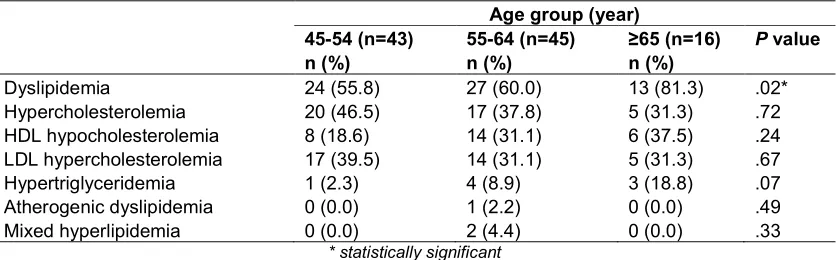
Table 5. Dyslipidemia related to age category in postmenopausal participants
Age group (year) 45-54 (n=43)
n (%)
55-64 (n=45) n (%)
≥65 (n=16) n (%)
P value
Dyslipidemia 24 (55.8) 27 (60.0) 13 (81.3) .02*
Hypercholesterolemia 20 (46.5) 17 (37.8) 5 (31.3) .72
HDL hypocholesterolemia 8 (18.6) 14 (31.1) 6 (37.5) .24
LDL hypercholesterolemia 17 (39.5) 14 (31.1) 5 (31.3) .67
Hypertriglyceridemia 1 (2.3) 4 (8.9) 3 (18.8) .07
Atherogenic dyslipidemia 0 (0.0) 1 (2.2) 0 (0.0) .49
Mixed hyperlipidemia 0 (0.0) 2 (4.4) 0 (0.0) .33
* statistically significant
Table 6. Dyslipidemia related to menopause duration
Dyslipidemia Hyper-C HDL hypo-C
LDL hyper-C
Hyper TG
Atherogenic dyslipidemia
Mixed
hyperlipidemia n (%) n (%) n (%) n (%) n (%) n (%) n (%) YSM (year)
1-5 28 (43.8) 21 (50.0) 13 (46.4) 19 (52.8) 3 (37.5) 1 (100) 1 (50.0)
6-10 14 (21.9) 8 (19.0) 7 (25.0) 6 (16.6) 0 (0.0) 0 (0.0) 0 (0.0) 11-15 2 (3.0) 0 (0.0) 1 (3.6) 0 (0.0) 1 (12.5) 0 (0.0) 0 (0.0)
˃15 20 (31.3) 13 (31.0) 7 (25.0) 11 (30.6) 4 (50.0) 0 (0.0) 1 (50.0)
P value .03* .10 .89 .16 .09 .81 .73
YSM: year since menopause, Hyper-C: hypercholesterolemia, HDL hypo-C: HDL hypocholesterolemia, LDL hyper-C: LDL hypercholesterolemia, HyperTG: hypertriglyceridemia, * statistically significant
(1.4 ± 0.2 g/l) in participants who have been in the postmenopausal state since more than 15 years. The mean total cholesterol concentration was also higher in women with YSM ˃ 15 (2.1 ± 0.4 g/l) than the other subgroups. However, there
was no significant difference between them (P =
.05). HDL-C and triglyceride did not differ between the YSM subgroups.
3.3 Dyslipidemia
Out of the 232 pre- and postmenopausal participants of this study, 123 (53%) had
dyslipidemia. Its prevalence was higher in
postmenopausal women 64 (61%) than
premenopausal 58 (45.6%) with a statistical
significant difference (P = .03). As shown in
Table 3, the overall pattern of dyslipidemia in
both groups was 88 (37.9%)
hypercholesterolemia, followed by 78 (33.6%) LDL hypercholesterolemia, 52 (22.4%) HDL
hypocholesterolemia and 11 (4.7%)
hypertriglyceridemia. HDL hypocholesterolemia prevalence was higher in postmenopausal
participants 28 (26.7%) compare to
statistically significant (P = .08). The prevalence
of hypercholesterolemia, LDL
hypercho-lesterolemia and hypertriglyceridemia statistically did not differ between the two groups (Table 3).
Less than half of premenopausal participants in each age subgroup had dyslipidemia with the highest prevalence of hypercholesterolemia and LDL hypercholesterolemia among the 18-27 years while the highest prevalence for HDL hypocholesterolemia was among the 28-37 years (Table 4).
As highlighted in Table 5, more than half of postmenopausal in each age subgroup had
dyslipidemia. Dyslipidemia was significantly (P =
.02) higher in women ≥ 65 years with more than 4 out of 5 (81.3%) women. The highest prevalence of hypercholesterolemia and LDL hypercholesterolemia was among the 45-54 years while the highest prevalence of HDL hypocholesterolemia was among the ≥ 65 years.
Regarding menopause duration, dyslipidemia prevalence 28 (43.8%) was significantly higher
(P = .03) in the subgroup of women who have
freshly entered the postmenopausal state. This 1-5 year since menopause (YSM) subgroup also
had the highest hypercholesterolemia 21
(50.0%), HDL hypocholesterolemia 13 (46.4%) and LDL hypercholesterolemia 19 (52.8%) prevalences though they were not statistically significant (Table 6).
3.4 Discussion
Estrogen deficiency or decline in estrogen levels after menopause often leads to dysregulation of metabolism [19]. These changes are in part due to the age-related metabolic impairment, but may
also be associated with postmenopausal
hypoestrogenism [20]. During menopause, there is a shift towards a more atherogenic lipid profile with an increase in plasma total cholesterol, LDL cholesterol and triglycerides and a decrease of HDL cholesterol [21,22,23,24]. Results of our study showed no significant change in the mean plasma concentration of total cholesterol, HDL, LDL cholesterols as well as triglyceride between pre- and postmenopausal participants. In other African countries such as Nigeria, Manafa et al. [25] reported also no significant variation in the mean values of total cholesterol and HDL cholesterol in pre- and postmenopausal subjects. However, the LDL cholesterol and triglyceride concentrations were significantly higher in these
postmenopausal Nigerian women compared to premenopausal subjects.
Changes in the concentration of HDL-C after menopause have been subjecting of controversy. In our study, the mean HDL-C concentrations were identical between premenopausal (0.5 ± 0.1 g/l) and postmenopausal (0.5 ± 0.2 g/l) subjects. Similar observations were reported by Zhou et al. [26] in pre- and postmenopausal Chinese women. In addition, stable mean HDL-C concentrations were also observed among different age subgroups of either pre- or postmenopausal participants. Unchanged HDL-C concentrations may be explained by unaltered visceral adipose tissue after menopause [27]. Low HDL-C in postmenopausal women in most previous reports may not be due to menopause, but due to weight gain, lack of activity reduced
alcohol intake and associated metabolic
diseases in old women [28]. HDL particles not only mediate reverse cholesterol transport but also exhibit oxidant, inflammatory, anti-thrombotic and vasodilatory activities [29,30].
With this high mean HDL cholesterol
concentration, postmenopausal participants of this study may less likely have cardiovascular disease.
The mean total cholesterol and LDL-C
concentrations were stable among pre- and postmenopausal participants. Age has been said to contribute to elevated lipid parameters. However, in this study, it was only in postmenopausal women that a marginal and continuous increase of both parameters from one age subgroup to another was found. Polotsky et al. [21] reported that these changes seem to be independent of age and more related to the increased abdominal fat mass. In our study, the total and LDL cholesterol concentrations were higher in subjects who have been experiencing menopause for more than 15 years. Similar observations have been reported by Manafa et al. [25] who found not only a progressive
increase of total and LDL cholesterol
concentrations but also the same pattern on triglyceride concentrations. However, Quadri and Dhundsi, [31] found no relation between lipid profile and time since menopause. This inconsistency may be explained by the fact that lifestyle and genetic variability between the
studied populations could be the
determining factors affecting lipid profile in postmenopausal women rather than menopause duration.
Triglyceride concentration did not differ between pre- and postmenopausal women. Meanwhile, Guo et al. [32] have reported significantly higher levels of triglyceride in postmenopausal women compared to premenopausal. It seems like the variation in the plasma triglyceride concentration
cannot be linked directly to pre- or
postmenopausal status. As already reported by previous authors [33,8,9], increase levels of
plasmatic triglyceride concentration were
explained by age effects.
About 53% of these participants had
dyslipidemia. This percentage is lower than what Doupa et al. [34] reported in Senegal and very high than the value reported in Chinese women [35]. Dyslipidemia was higher in postmenopausal
(61%) than premenopausal participants.
Gomina et al. [36] have reported 86.98%
dyslipidemia in postmenopausal Beninese
women. The overall dyslipidemia pattern [88 (37.9%) hypercho-lesterolemia, followed by 78 (33.6%) LDL hypercholesterolemia, 52 (22.4%) HDL hypocho-lesterolemia and 11 (4.7%) hypertriglyceridemia] is lower than what is reported by Doupa et al. [34]. Cultural differences, race, diet which vary from one region to another as well as ethnic differences can affect dyslipidemia. In the Multi-Ethnic Study of Atherosclerosis done in America, Goff et al. [37] observed that ethnic differences
in the prevalence of dyslipidemia were
observed only for Chinese American
subjects.
In premenopausal participants, the highest LDL hypercholesterolemia prevalence (37.1%) was among the 18-27 years subgroup. These results are in line with previous observation reporting that LDL cholesterol levels tend to increase after the age of 20 years [38]. The highest level of
dyslipidemia (81.3%) in postmenopausal
women ≥ 65 years corroborates results reported in Black American women [37]. In general, dyslipidemia prevalence is greater in the older age groups [37]. The highest prevalence of
hypercho-lesterolemia (46.5%) and LDL
hypercho-lesterolemia (39.5%) was among the 45-54 years subgroup in postmenopausal participants. In Benin, Gomina et al. [36] had instead reported the highest prevalence in women of 56 years and over. These differences could be due to genetic variability or cultural dissimilarities.
Participants with menopause duration between 1-5 years presented the highest overall dyslipidemia prevalence as well as the worse
cholesterolemia patterns. The rate of
dysregulation of lipid metabolism might be higher in the early postmenopausal period.
The primary limitation of this study was the characterization of participants at one point in adulthood without knowledge of the sequence of previous cardiovascular health risk factors. This cross-sectional study might not provide accurate estimates of relationships between menopausal status and these biochemical variables that could change with time. Another issue was the non-representative nature of the sample that could reduce the generalizability of results, the potential for residual confounding and the potential for errors in or bias self-reported data.
Furthermore, other metabolites of lipid
metabolism were not analyzed. Despite these limitations, these data generated here have provided a descriptive picture on lipid profile and dyslipidemia of Cameroonian women. They could, therefore, be used as a baseline for subsequent studies. Additional studies with more parameters and lipid metabolites will enable to establish a good relationship between lipid metabolism and menopausal status in central Africa.
4. CONCLUSION
This study concluded that there was no significant difference in the mean values of total cholesterol, HDL-C, LDL-C as well as triglyceride between premenopausal and postmenopausal women. The mean HDL-C concentration was stable in postmenopausal participants thought their total cholesterol and LDL-C levels were slightly increased as they got older. LDL-C level was significantly higher in women who have been experiencing menopause for more than 15 years. Overall 53% of the participants had dyslipidemia with a higher prevalence in postmenopausal women. Dyslipidemia was significantly higher in the subgroup of women who have freshly entered menopause. To maintain a good lipid profile, women should be encouraged to have a good lifestyle with moderate physical activity and lower dietary fat intake.
CONSENT
ETHICAL APPROVAL
This study was approved by the National
Ethics Committee for Human Health
Research (ethic clearance N°
2016/08/803/CE/CNERSH/SP). Participants of
this cross-sectional study were healthy
volunteers living in Yaounde to whom the research aim was explained and their questions properly answered. They were informed of their complete right to withdraw from the study before the publication of the results without any explanation. During analysis, data collected from each subject were anonymous and kept confidential.
ACKNOWLEDGEMENTS
We thank Nkom Felix Ntumvi, Dongmo Sonkeng Anne-Marie and Simo Fodju Stephanie Marie for their technical help. The cooperation of the subjects who took part in the study is greatly appreciated.
COMPETING INTERESTS
Authors have declared that no competing interests exist.
REFERENCES
1. Jellinger PS, Handelsman Y, Rosenblit PD,
Bloomgarden ZT, Fonseca VA, Garber AJ, et al. American association of clinical endocrinologists and american college of endocrinology guidelines for management of dyslipidemia and prevention of cardio-vascular disease. Endocrine Practice. 2017;23(2):1-87.
2. Lindquist O, Bengtsson C, Lapidus L.
Relationships between the menopause and risk factors for ischaemic heart disease. Acta Obstet Gynecol Scand Suppl. 1985;130:43-47.
3. WHO, Research on Menopause. Report of
WHO Scientific Group. World Health Organization Report. Geneva Switzerland. 1981;670.
4. Jensen J, Nilas L, Christiansen C.
Influence of menopause on serum lipids and lipoproteins. Maturitas. 1990;12(4): 321-31.
5. Akahoshi M, Soda M, Nakashima E,
Shimaoka K, Seto S, Yano K. Effects of
menopause on trends of serum
cholesterol, blood pressure, and body mass index. Circulation. 1996;94(1):61-66.
6. Chang CJ, Wu CH, Yao WJ, Yang YC, Wu
JS, Lu FH. Relationships of age,
menopause and central obesity on
cardiovascular disease risk factors in Chinese women. International Journal of Obesity and Related Metabolic Disorders. 2000;24:1699-1704.
7. Tunstall-Pedoe H, Kuulasmaa K, Mahonen
M, Tolonen H, Ruokokoski E, Amouvel P. Contribution of trends in survival and coronary-event rates to changes in coronary heart disease mortality: 10-year results from 37 WHO MONICA project
populations. Monitoring trends and
determinants in cardiovascular disease. Lancet. 1999;353:1547-57.
8. Campos H, McNamara JR, Wilson PW,
Ordovas JM, Schaefer EJ. Differences in low-density lipoprotein subfractions and apolipoproteins in premenopausal and postmenopausal women. J Clin Endocrinol Metab. 1998;67(1):30-35.
9. Do KA, Green A, Guthrie JR, Dudley EC,
Burger HG, Dennerstein L. Longitudinal study of risk factors for coronary heart disease across the menopausal transition. Am J Epidemiol. 2000;151(6):584–93.
10. Tremollieres FA, Pouilles JM, Cauneille C,
Ribot C. Coronary heart disease risk factors and menopause: A study in 1684 French women. Atherosclerosis. 1999;142: 415-23.
11. Dallongeville J, Marecaux N, Isorez D,
Zylbergberg G, Fruchart JC, Amouyel P. Multiple coronary heart disease risk factors are associated with menopause and
influenced by substitutive hormonal
therapy in a cohort of French women. Atherosclerosis. 1995;118:123-33.
12. Ozbey N, Sencer E, Molvalilar S, Orhan Y.
Body fat distribution and cardiovascular
disease risk factors in pre- and
postmenopausal obese women with similar BMI. Endocrine Journal. 2002;49:503-9.
13. Gierach GL, Johnson BD, Bairey Merz CN,
Kelsey SF, Bittner V, et al. Hypertension, menopause, and coronary artery disease risk in the Women's Ischemia Syndrome Evaluation (WISE) Study. Journal of the American College of Cardiology. 2006;47: S50-58.
14. Allain CC, Poon LS, Chan CS, Richmond
15. Fossati P, Prencipe L. Serum triglycerides determined colorimetrically with an enzyme that produces hydrogen peroxide. Clin Chem. 1982;28:2077-80.
16. Trinder P. Determination of glucose in
blood using glucose oxidase with an alternative oxygen receptor. Ann Clin Biochem. 1969;6:27-29.
17. Friedewald WT, Levy RI, Fredrickson DS.
Estimation of the concentration of low-density lipoprotein cholesterol in plasma,
without use of the preparative
ultracentrifuge. Clin Chem. 1972;18(6): 499-502.
18. Expert Panel on Detection, Evaluation, and
Treatment of High Blood Cholesterol in Adults, Executive Summary of The Third
Report of The National Cholesterol
Education Program (NCEP). Expert Panel on Detection, Evaluation, and Treatment of High Blood Cholesterol in Adults (Adult Treatment Panel III). JAMA. 2001;285(19): 2486-97.
19. Faulds MH, Zhao C, Dahlman-Wright K.
Gustafsson JA. The diversity of sex steroid action: Regulation of metabolism by estrogen signaling. Journal of Endocrino-logy. 2012;212:3-12.
20. Otsuki M, Kasayama S, Morita S,
Asanuma N, Saito H, Mukai M, et al.
Menopause, but not age, is an
independent risk factor for fasting plasma glucose levels in nondiabetic women. Menopause. 2007;14:404-7.
21. Polotsky HN, Polotsky AJ. Metabolic
implications of menopause. Semin.
Reprod. Med. 2010;28:426-34.
22. Carr MC. The emergence of the metabolic
syndrome with menopause. J. Clin. Endocrinol. Metab. 2003;88:2404-11.
23. Anagnostis P, Stevenson J.C, Crook D,
Johnston DG, Godsland IF. Effects of menopause, gender and age on lipids and
high-density lipoprotein cholesterol
subfractions. Maturitas. 2015;81:62-68.
24. Fatima Y, Ramesh S. A comparative study
of serum estrogen and lipid profile in pre-menopausal and post-pre-menopausal women as atherosclerotic risk factors. International Journal of Clinical Biochemistry and Research. 2017;4(3):237-41.
25. Manafa PO, Aguiyi NC, Onyenekwe CC,
Chukwuma GO, Okeke CO, Ihim AC, et al. Comparative assessment of lipid profile in pre-menopausal and menopausal women in Nnewi Nigeria. European Scientific Journal. 2015;11(30):88-100.
26. Zhou JL, Lin SQ, Shen Y, Chen Y, Zhang
Y, Chen FL. Serum lipid profile changes during the menopausal transition in Chinese women: A community-based cohort study study. Menopause. 2010; 17(5):997-1003.
27. Fernandez ML, Murillo AG.
Post-menopausal women have higher HDL and decreased incidence of low HDL than premenopausal women with metabolic syndrome. Healthcare (Basel). 2016;4(1): E20.
28. Chee JK, Tae HK, Wang SR, Un HR.
Influence of menopause on High Density lipoprotein cholesterol and lipids. J Korean Med Sci. 2000;15;380-6.
29. Assmann G, Gotto AM. HDL cholesterol
and protective factors in atherosclerosis. Circulation. 2004;109:III8–III14.
30. Ali KM, Wonnerth A, Huber K, Wojta J.
Cardiovascular disease risk reduction by raising HDL cholesterol: Current therapies and future opportunities. Br J Pharmacol. 2012;167:1177-94.
31. Quadri S, Dhundsi S. A study on body
composition and lipid profile in post-menopausal women. International Journal of Biomedical and Advance Research. 2012;03(08).
32. Guo W, Fu J, Chen X, Gao B, Fu Z, Fan H,
et al. The effects of estrogen on serum
level and hepatocyte expression of
PCSK9. Metabolism. 2015;64:554-60.
33. Davis C, Pajak A, Rywik S, Williams DH,
Broda G, Pazucha T, et al. Natural menopause and cardiovascular disease
risk factors: The poland and US
collaborative study on cardiovascular disease epidemiology. Ann Epidemiol. 1994;4(6):445-48.
34. Doupa D, Mbengue AS, Diallo FA, Jobe M,
Ndiaye A, Kane A, et al. Lipid profile
frequency and the prevalence of
dyslipidaemia from biochemical tests at Saint Louis University Hospital in Senegal. The Pan African Medical Journal. 2014; 17:75.
35. Zhao WH, Zhang J, Zhai Y, You Y, Man
QQ, Wang CR, et al.Blood lipid profile and
prevalence of dyslipidemia in Chinese adults. Biomed Environ Sci. 2007;20(4): 329-35.
36. Gomina M, Ele RNM, Imorou RS, Alassani
Journal of Biochemistry and Bioinfor-matics. 2017;7(1):12-18.
37. Goff DC, Bertoni AG, Kramer H, Bonds D,
Blumenthal S, Tsai MY, et al. Dyslipidemia Prevalence, treatment, and control in the
multi-ethnic study of atherosclerosis
(MESA) gender, ethnicity, and coronary artery calcium. Circulation. 2006;113:647-656.
38. Kreisberg RA, Kasim S. Cholesterol
metabolism and aging. Am J Med. 1987; 82(1B):54-60.
_________________________________________________________________________________ © 2019 Nkeunen et al.; This is an Open Access article distributed under the terms of the Creative Commons Attribution License (http://creativecommons.org/licenses/by/4.0), which permits unrestricted use, distribution, and reproduction in any medium, provided the original work is properly cited.
Peer-review history: