R E S E A R C H
Open Access
Transcriptomic analysis of rice in response to iron
deficiency and excess
Khurram Bashir
1,2, Kousuke Hanada
3,4, Minami Shimizu
4, Motoaki Seki
2,5, Hiromi Nakanishi
1and Naoko K Nishizawa
1,6*Background:Iron (Fe) is essential micronutrient for plants and its deficiency as well as toxicity is a serious agricultural problem. The mechanisms of Fe deficiency are reasonably understood, however our knowledge about plants response to excess Fe is limited. Moreover, the regulation of small open reading frames (sORFs) in response to abiotic stress has not been reported in rice. Understanding the regulation of rice transcriptome in response to Fe deficiency and excess could provide bases for developing strategies to breed plants tolerant to Fe deficiency as well as excess Fe.
Results:We used a novel rice 110 K microarray harbouring ~48,620 sORFs to understand the transcriptomic changes that occur in response to Fe deficiency and excess. In roots, 36 genes were upregulated by excess Fe, of which three were sORFs. In contrast, 1509 genes were upregulated by Fe deficiency, of which 90 (6%) were sORFs. Co-expression analysis revealed that the expression of some sORFs was positively correlated with the genes upregulated by Fe deficiency. In shoots, 50 (19%) of the genes upregulated by Fe deficiency and 1076 out of 2480 (43%) genes upregulated by excess Fe were sORFs. These results suggest that excess Fe may significantly alter metabolism, particularly in shoots.
Conclusion:These data not only reveal the genes regulated by excess Fe, but also suggest that sORFs might play an important role in the response of plants to Fe deficiency and excess.
Keywords:Excess Fe; Fe deficiency; Iron; Peptides; Rice; Small open reading frames
Background
Iron (Fe) is an essential micronutrient for all higher organ-isms, and its deficiency causes a serious nutritional prob-lem in both humans and plants. Although mineral soils are rich in Fe (>5%), various factors such as a high soil pH and the presence of sodium carbonate adversely affect the avail-ability and uptake of Fe through plant roots (Marschner 1995; Mori 1999). In contrast, a low soil pH and anaerobic conditions, such as in a paddy field, lead to the reduction of Fe3+ to Fe2+, which can result in increased absorption and conditions of excess Fe (Neue et al. 1998; Quinet et al. 2012). Fe toxicity can occur in flooded soils with a pH below 5.8 under aerobic conditions, and at a pH below 6.5 under anaerobic conditions (Fageria et al. 2008). Fe toxicity is a serious agricultural problem, particularly when plants
are grown in acidic soils (Guerinot and Ying 1994; Quinet et al. 2012). Developing plants that can grow in problem-atic soils requires an understanding of the molecular mechanisms of Fe uptake, transport, and storage in plants under conditions of varying Fe availability (Bashir et al. 2013a). The molecular mechanisms of Fe uptake from soil have been extensively studied (Bashir et al. 2010; Bashir et al. 2011b; Bashir et al. 2013a; Guerinot 2010; Guerinot and Ying 1994; Ishimaru et al. 2011b; Ishimaru et al. 2011a; Kobayashi and Nishizawa 2012; Marschner 1995). Plants are divided into two broad categories (strategies I and II) based on how they uptake Fe from the soil (Marschner 1995; Marschner and Römheld 1994). Rice is a strategy II plant, and secretes 2’-deoxymugineic acid (DMA) to acquire soil Fe. The genes involved in DMA synthesis have been cloned and characterized (Bashir et al. 2006; Bashir and Nishizawa 2006; Inoue et al. 2003; Inoue et al. 2008; Nozoye et al. 2004; Suzuki et al. 2006; Suzuki et al. 2008; Suzuki et al. 2012; Takahashi et al. 1999). Spe-cifically, L-methionine is converted to nicotianamine (NA) by NA synthase 1–3 (OsNAS1-3), and is then converted to * Correspondence:[email protected]
1Laboratory of Plant Biotechnology, Department of Global Agricultural Sciences, Graduate School of Agricultural and Life Sciences, The University of Tokyo, 1-1-1 Yayoi, Bunkyo-ku, Tokyo 113-8657, Japan
6
Research Institute for Bioresources and Biotechnology, Ishikawa Prefectural University, 1-308 Suematsu, Nonoichi-shi, Ishikawa 921-8836, Japan Full list of author information is available at the end of the article
3’-keto acid by NA aminotransferase 1 (OsNAAT1) and fi-nally DMA synthase (OsDMAS1) converts this 3’-keto acid to DMA (Bashir et al. 2006; Bashir and Nishizawa 2006; Bashir et al. 2010; Inoue et al. 2003; Inoue et al. 2008; Ma et al. 1995; Ma et al. 1999; Mori and Nishizawa 1987; Nozoye et al. 2014a; Nozoye et al. 2014b). DMA is then secreted to the rhizosphere via the mugineic acid trans-porter (OsTOM1) Nozoye et al. 2011. In the rhizo-sphere, DMA binds to Fe(III), and the resulting DMA-Fe (III) complex is taken up by OsYSL15 (Inoue et al. 2009; Lee et al. 2009). Rice also uses OsIRT1 to uptake ferrous Fe under paddy field conditions, and secretes phenolics to solubilize apoplasmic Fe (Bashir et al. 2011b; Ishimaru et al. 2011a; Ishimaru et al. 2011b). Once Fe is absorbed through roots, it is translocated to the aerial parts of the plant. The genes involved in root-to-shoot translocation and the transport of Fe to subcel-lular organelles have also been characterized (Aoyama et al. 2009; Bashir et al. 2011a; Bashir et al. 2011c; Bashir et al. 2013b; Ishimaru et al. 2009; Ishimaru et al. 2010; Ishimaru et al. 2011a; Ishimaru et al. 2011b; Ishimaru et al. 2012; Kakei et al. 2012; Koike et al. 2004; Lee et al. 2012; Yokosho et al. 2009; Zhang et al. 2012b). Plants can accumulate varying levels of Fe and the re-sponse of rice to Fe toxicity was recently summarized after comprehensive transcriptomic and physiological analyses (Quinet et al. 2012). In the current study, our main object-ive was to understand the transcriptomic response of rice to different conditions of Fe availability. We therefore performed a microarray analysis of plants accumulating high, yet not physiologically toxic, levels of Fe. Although the rice genome has been sequenced (Kawahara et al. 2013), the identification of small open reading frames (sORFs) typically consisting of fewer than 100 codons was not addressed in plants until recently (Hanada et al. 2013; Hanada et al. 2010; Hanada et al. 2007). These sORFs play a critical role in morphogenesis in Arabidopsis thaliana
(Hanada et al. 2013; Hanada et al. 2010; Hanada et al. 2007). Although the potential role of sORF in rice is re-cently discussed (Okamoto et al. 2014) their regulation in response to different abiotic stresses has not been assessed in rice. In this study, we used a novel 110 K rice microarray that, along with previously identified genes, in-cludes ~48,620 sORFs to identify transcriptional changes in response to Fe deficiency and excess in rice roots and shoots. This will allow a better understanding of the re-sponse of plants to these stresses, and suggests the in-volvement of sORFs in Fe metabolism under different conditions of Fe availability.
Results
Morphological responses to Fe deficiency and excess Fe When plants were grown under Fe-deficient conditions, the root and shoot length as well as the chlorophyll
content decreased significantly compared with plants grown in the presence of 100μM Fe-EDTA (Figure 1a-c). In con-trast, when plants were grown under conditions of excess Fe, the root length was reduced, but no significant differ-ences were observed in plant height or chlorophyll content compared with wild-type plants (Figure 1a-c). In the shoots of Fe-deficient plants, the concentrations of Fe were 50% lower than in plants grown with 100μM Fe, whereas plants grown under conditions of excess Fe accumulated two-fold more Fe in their leaves (Figure 1d).
In plants grown under Fe-deficient conditions, the con-centrations of zinc and copper (Cu) increased in the shoots, whereas the manganese (Mn) concentrations were compar-able to plants grown in the presence of Fe (Figure 1e-g). In contrast, plants grown in the presence of excess Fe accu-mulated more Mn in their shoots compared to plants sup-plied with 100 μM Fe (Figure 1f). In the roots of plants grown under Fe-deficient conditions, the concentrations of Fe and Mn decreased significantly, whereas the concentra-tion of Cu increased compared to plants grown with 100μM Fe (Figure 1h-k).
Genes upregulated by Fe deficiency and downregulated by excess Fe in roots
Several studies reported the upregulation of genes in re-sponse to Fe deficiency in rice (Bashir et al. 2013c; Bashir and Nishizawa 2013; Ishimaru et al. 2009; Nozoye et al. 2011), however little attention is paid to identify genes regulated by excess Fe. Before carrying out our microarray analysis, we used RT-PCR to assess the expression of
OsDMAS1andOsVIT2to confirm the effects of excess Fe and deficiency treatments.OsDMAS1is upregulated by Fe deficiency, while expression of vacuolar Fe transporter
those involved in the synthesis of DMA such asOsNAAT1, andOsDMAS1, those involved in Fe-NA or DMA complex transport (OsYSL2 and OsYSL15), and the DMA efflux transporter (OsTOM1) (Table 1 (Ishimaru et al. 2009)). In addition, OsIRO2 and two other basic helix loop helix (bHLH)-type transcription factors were upregulated by Fe deficiency (Tables 1 and S1). Two ABC transporters that are upregulated by excess Cu (Lin et al. 2013), were upregulated by Fe deficiency as were two amino acid trans-porters, of whichOs02g0788800is also upregulated by ex-cess Cu (Lin et al. 2013). MapMan analysis revealed that many metabolic genes were upregulated or downregu-lated in response to Fe deficiency, and many of these were upregulated in response to excess Fe in roots (Additional file 1: Figure S2). Changes in the expression
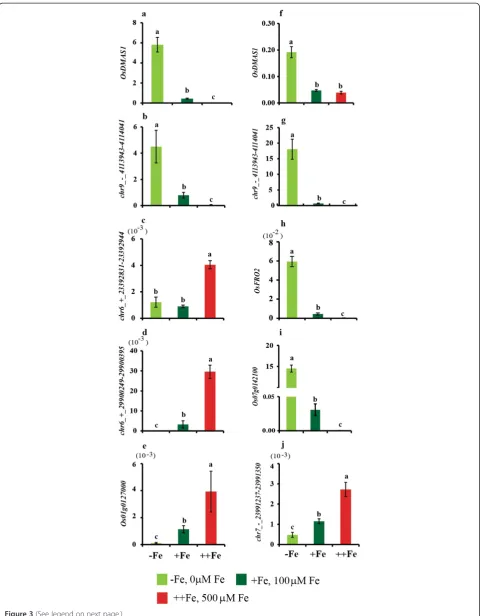
of OsDMAS1 and sORF chr9_-_4113943-4114041were
also confirmed through real time PCR and the data was in line with microarray analysis (Figure 3).
Genes upregulated by excess Fe and downregulated by Fe deficiency in roots
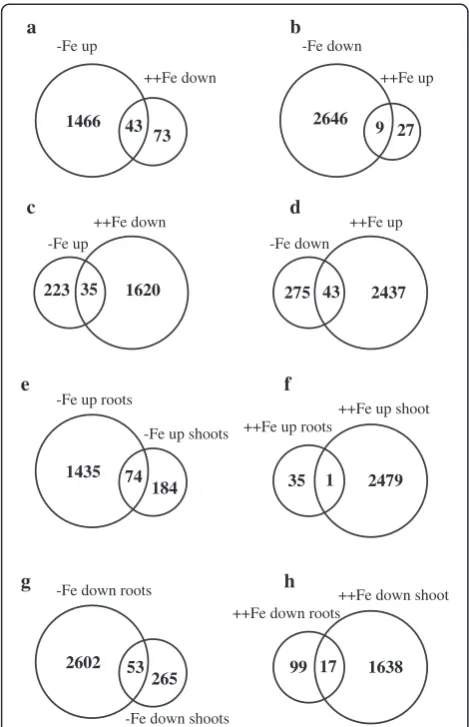
In roots, 36 genes were upregulated by excess Fe, of which three were sORFs (Table 2), while 2655 genes
were downregulated by Fe deficiency, of which 1225 (46%) were sORFs (Additional file 2: Table S3). However, only nine genes were upregulated by excess Fe and downregulated by Fe deficiency. The genes upregulated by excess Fe included four peroxidases, multi-Cu oxi-dase (Os01g0127000), and alcohol dehydrogenase, sug-gesting that excess Fe causes oxidative stress. Three cytochrome P450 family proteins, which may play a role in electron transport, were also upregulated, as was the expression of one subtilase family gene. Five uncharac-terized proteins and three sORFs genes were also upreg-ulated by excess Fe (Table 2). Changes in the expression of multicopper oxidase Os01g0127000 and two sORFs chr6_ + _29900249-29900395 and chr6_ + _23392831-23392944 were also confirmed through real time PCR (Figure 3).
Most of the genes downregulated by Fe deficiency (1225; 46%) were categorized as sORFs. Other downreg-ulated genes include 15 Zn finger proteins, two WRKY transcription factors, 11 peptidase, eight heme peroxi-dases, and genes involved in the ethylene response and other metabolic pathways such as methionine metabol-ism (Additional file 2: Table S3).
Genes upregulated by Fe deficiency and downregulated by excess Fe in shoots
In shoots, 258 genes were upregulated by Fe deficiency, of which 35 genes were also downregulated by excess Fe (Figure 2c). Consistent with previous reports, genes involved in DMA synthesis and transport (such as
OsNAS1-2 and OsDMAS1, OsTOM1), Fe-NA or DMA
complex transport (OsYSL2) were upregulated by Fe de-ficiency (Additional file 2: Table S4). Other genes regu-lated by Fe deficiency includedOsIRT2,OsIDS1,OsIRO2
and OsFRO2. OsIDS1 is a metallothionein (MT) gene
highly responsive to Fe deficiency (Itai et al. 2013). Of
the genes upregulated by Fe deficiency in shoots, 50 (19%) were sORFs, but only two of these were also lated by excess Fe, whereas 1655 genes were downregu-lated by excess Fe (Additional file 2: Table S5). The genes downregulated by excess Fe include NADPH-dependent oxidoreductases and peroxidases. Two bHLH transcription factors, a cyclin-like F-box domain-containing protein, a protein kinase, and two sORFs (chr6_ + _7967232-7967441
andchr9_-_4113943-4114041) were upregulated by Fe de-ficiency and downregulated by excess Fe (Table 3). A total of 74 genes were upregulated by Fe deficiency in both roots and shoots (Figure 2e), but only 17 genes were downregu-lated by excess Fe in both roots and shoots (Figure 2h).
Genes upregulated by excess Fe and downregulated by Fe deficiency in shoots
In shoots, 2480 genes were upregulated by excess Fe, of which 1076 (43%) were sORFs (Additional file 2: Table S6). The genes upregulated by excess Fe included a 2-oxoglutarate (OG)-Fe(II) oxygenase domain-containing protein, and an ATPase, and 17 transporter genes belonging to dif-ferent families. These transporters include two putative plasma membrane ABC transporter domain-containing proteins [a putative subfamily B ABC-type transporter and an MRP-like ABC transporter], two putative amino acid transporters, and two transporters belonging to the multidrug and toxic compound extrusion (MATE) transporter family, which transports small organic com-pounds (Omote et al. 2006). The MATE transporter
Os03g0571700 is highly homologous to rice phenolics efflux zero 1, which transports phenolics to solubilize apoplasmic Fe (Ishimaru et al. 2011b; Ishimaru et al. 2011a). Additional transporters that putatively transport Cu, magnesium, phosphate or other anions, and oligo-peptides were also upregulated (Additional file 2: Table S7). Other genes upregulated by excess Fe include those that participate in cellular metabolic processes, gene ex-pression and translation, and the generation of precur-sor metabolites and energy (Table 4).
MapMan analysis revealed that many metabolic related genes were upregulated or downregulated in response to Fe deficiency, and many of these were upregulated in response to excess Fe in shoots (Additional file 1: Figure S3). A total of 43 genes were upregulated by ex-cess Fe and downregulated by Fe deficiency (Figure 2d), of which 9 (21%) were sORFs (Table 5). In shoots, 318 genes were downregulated by Fe deficiency (Additional file 2: Table S7). Interestingly, only one gene (belonging to the cytochrome family) was upregulated in both roots and shoots in response to excess Fe (Figure 2f ), whereas 53 genes were downregulated in response to Fe defi-ciency in both roots and shoots (Figure 2g). Genes that were downregulated by Fe deficiency included Fe sulfur [4Fe-4S] cluster assembly factor, mitochondrial substrate 1466
73
43 2646 9 27
++Fe up ++Fe down
-Fe down -Fe up
1435
184 74
-Fe up roots
-Fe up shoots
2602
265 53
-Fe down roots
-Fe down shoots
b a
d c
f e
h g
++Fe up ++Fe down
-Fe down -Fe up
2437 275 43 1620
223 35
++Fe up shoot ++Fe up roots
2479
35 1
++Fe down shoot ++Fe down roots
1638 99 17
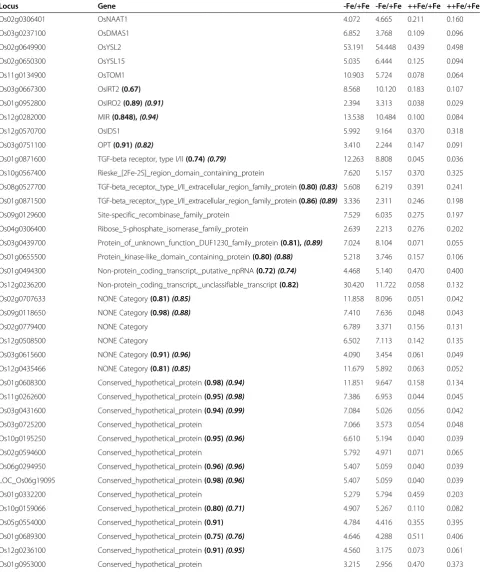
Table 1 Genes upregulated by Fe-deficiency and downregulated by excess Fe in roots
Locus Gene -Fe/+Fe -Fe/+Fe ++Fe/+Fe ++Fe/+Fe
Os02g0306401 OsNAAT1 4.072 4.665 0.211 0.160
Os03g0237100 OsDMAS1 6.852 3.768 0.109 0.096
Os02g0649900 OsYSL2 53.191 54.448 0.439 0.498
Os02g0650300 OsYSL15 5.035 6.444 0.125 0.094
Os11g0134900 OsTOM1 10.903 5.724 0.078 0.064
Os03g0667300 OsIRT2(0.67) 8.568 10.120 0.183 0.107
Os01g0952800 OsIRO2(0.89)(0.91) 2.394 3.313 0.038 0.029
Os12g0282000 MIR(0.848),(0.94) 13.538 10.484 0.100 0.084
Os12g0570700 OsIDS1 5.992 9.164 0.370 0.318
Os03g0751100 OPT(0.91)(0.82) 3.410 2.244 0.147 0.091
Os01g0871600 TGF-beta receptor, type I/II(0.74)(0.79) 12.263 8.808 0.045 0.036 Os10g0567400 Rieske_[2Fe-2S]_region_domain_containing_protein 7.620 5.157 0.370 0.325
Os08g0527700 TGF-beta_receptor,_type_I/II_extracellular_region_family_protein(0.80)(0.83) 5.608 6.219 0.391 0.241 Os01g0871500 TGF-beta_receptor,_type_I/II_extracellular_region_family_protein(0.86)(0.89) 3.336 2.311 0.246 0.198 Os09g0129600 Site-specific_recombinase_family_protein 7.529 6.035 0.275 0.197
Os04g0306400 Ribose_5-phosphate_isomerase_family_protein 2.639 2.213 0.276 0.202
Os03g0439700 Protein_of_unknown_function_DUF1230_family_protein(0.81),(0.89) 7.024 8.104 0.071 0.055 Os01g0655500 Protein_kinase-like_domain_containing_protein(0.80)(0.88) 5.218 3.746 0.157 0.106 Os01g0494300 Non-protein_coding_transcript,_putative_npRNA(0.72)(0.74) 4.468 5.140 0.470 0.400 Os12g0236200 Non-protein_coding_transcript,_unclassifiable_transcript(0.82) 30.420 11.722 0.058 0.132
Os02g0707633 NONE Category(0.81)(0.85) 11.858 8.096 0.051 0.042
Os09g0118650 NONE Category(0.98)(0.88) 7.410 7.636 0.048 0.043
Os02g0779400 NONE Category 6.789 3.371 0.156 0.131
Os12g0508500 NONE Category 6.502 7.113 0.142 0.135
Os03g0615600 NONE Category(0.91)(0.96) 4.090 3.454 0.061 0.049
Os12g0435466 NONE Category(0.81)(0.85) 11.679 5.892 0.063 0.052
Os01g0608300 Conserved_hypothetical_protein(0.98)(0.94) 11.851 9.647 0.158 0.134 Os11g0262600 Conserved_hypothetical_protein(0.95)(0.98) 7.386 6.953 0.044 0.045 Os03g0431600 Conserved_hypothetical_protein(0.94)(0.99) 7.084 5.026 0.056 0.042
Os03g0725200 Conserved_hypothetical_protein 7.066 3.573 0.054 0.048
Os10g0195250 Conserved_hypothetical_protein(0.95)(0.96) 6.610 5.194 0.040 0.039
Os02g0594600 Conserved_hypothetical_protein 5.792 4.971 0.071 0.065
Os06g0294950 Conserved_hypothetical_protein(0.96)(0.96) 5.407 5.059 0.040 0.039 LOC_Os06g19095 Conserved_hypothetical_protein(0.98)(0.96) 5.407 5.059 0.040 0.039
Os01g0332200 Conserved_hypothetical_protein 5.279 5.794 0.459 0.203
Os10g0159066 Conserved_hypothetical_protein(0.80)(0.71) 4.907 5.267 0.110 0.082 Os05g0554000 Conserved_hypothetical_protein(0.91) 4.784 4.416 0.355 0.395 Os01g0689300 Conserved_hypothetical_protein(0.75)(0.76) 4.646 4.288 0.511 0.406 Os12g0236100 Conserved_hypothetical_protein(0.91)(0.95) 4.560 3.175 0.073 0.061
carrier family protein, heavy metal transporters, ferredoxin domain-containing proteins, a bHLH domain-containing protein, heme peroxidases, isocitrate dehydrogenase,
OsNAS3, aferritingene,OsZIP7andOsZIP10, six peroxi-dases, and 43 sORFs (Additional file 2: Table S7). A summary of the transcriptomic changes in chloroplasts in response to Fe deficiency and excess is shown in Additional file 1: Figure S4. The expression of photo-system II genes was either unchanged or downregulated during Fe deficiency, whereas photosystem I genes were both upregulated and downregulated. In contrast, al-most all of the genes involved in ATP synthesis, PS1, and PSII were upregulated in response to excess Fe.
Discussion
Both Fe deficiency and toxicity cause significant losses in crop yield and quality. In plants, Fe is essential for various cellular processes, as it serves as a cofactor for a range of plant enzymes, including cytochromes, cata-lase, peroxidase isozymes, ferredoxin, and isozymes of superoxide dismutase (Marschner, 1995). It was there-fore expected that the expression of these genes would be downregulated by Fe deficiency. Genes upregulated during Fe deficiency-associated stress in graminaceous crops have been described extensively (Bashir et al. 2010; Ishimaru et al. 2009; Ishimaru et al. 2011b; Kobayashi et al. 2005; Nagasaka et al. 2009; Negishi et al. 2002; Nozoye et al. 2007), and our microarray data are consistent with those of previous reports. We have therefore not discussed these genes in detail. Similarly the morphological changes in response to Fe availability as well as the effects of availability of Fe on accumula-tion of other metals have been widely reported in rice (Ishimaru et al. 2009; Bashir et al. 2011c).
Microarray analyses were performed after one week of Fe deficiency and excess treatment and at this point, plants correspond to a new transcriptomic/metabolic steady state. Many genes upregulated by Fe deficiency are also upregu-lated by other stresses such as cadmium (Egan et al. 2007) toxicity (Nakanishi et al. 2006; Takahashi et al. 2011). Consistent with this, we observed the upregulation of several genes (Additional file 2: Table S1) that are also regulated by other abiotic stresses, including Cd tox-icity (Takahashi et al. 2011) (OsNRAMP1), Cu toxicity
(Lin et al. 2013) (Os04g0588700, Os02g0208300, and
Os04g0512300), and heat stress (amino acid transporter and heat shock proteins). Many genes reported to be regu-lated by disease pathogenesis are also upreguregu-lated by Fe deficiency (Additional file 2: Table S1). The expression of symbiotic hemoglobin 2 (rHb2; Os03g0226200), which plays an important role in plant adaptation to unfavorable environment (Zhang et al. 2012a), was also upregulated by Fe deficiency. These results suggest that Fe-deficient plants undergo oxidative stress, since oxidative stress is common during times of biotic or abiotic stress.
The expression of 1-aminocyclopropane-1-carboxylate oxidase 1 (Os09g0451400) was significantly upregulated in Fe-deficient shoots. This gene encodes an intermedi-ate during the formation of ethylene, which plays a role in abiotic stress signaling (Lingam et al. 2011). Auxins interact with ethylene metabolism, and the expression of four auxin-responsive genes (two auxin-responsive SAUR protein family proteins, one auxin-induced gene, and indoleacetic acid-induced protein 18) was also up-regulated by Fe deficiency (Additional file 2: Table S1). These results suggest that ethylene signaling and the re-programing of plant metabolism may be an important strategy of rice in response to Fe deficiency.
Transcriptomic changes in response to Excess Fe
The expression of several genes was upregulated by ex-cess Fe in roots and shoots. In roots, members of the cytochrome family, oxidases, alcohol dehydrogenase, a protein kinase, a Zn finger domain-containing protein, and a heavy metal transporter were all significantly upregulated. Many of these genes are also regulated by other stresses. For example, the cytochrome_P450_ family gene Os01g0803800 is upregulated by diclofop methyl (Qian et al. 2012),Os11g0138300is regulated by ionizing radiation (Kim et al. 2012), a heavy metal trans-porter is regulated by excess silicon and rice blast (Brunings et al. 2009). One laccase gene that plays a role in lignin formation and two peroxidases (Os03g0369000
and Os07g0531400) are also upregulated by Fe toxicity (Quinet et al. 2012). These results suggest that under conditions of excess Fe, the generation of reactive oxy-gen species (ROS) increases, as ROS production is com-mon during times of abiotic or biotic stress. However, it
Table 1 Genes upregulated by Fe-deficiency and downregulated by excess Fe in roots(Continued)
chr9_-_4113943-4114041 sORF(1.00)(0.94) 6.364 5.478 0.042 0.042
chr4_-_5708578-5708748 sORF(0.94)(1.00) 5.376 3.090 0.054 0.036
chr1_ + _43772594-43772752 sORF(0.83)(0.83) 3.181 4.281 0.249 0.263
The expression of genes listed in Table1is up or down regulated at least two fold in both biological replications. Coexpression analysis were done athttp:// evolver.psc.riken.jp/seiken/OS/co-express.html. This database contains microarray data of 40 different experimental conditions obtained through microarray analysis using the same custom microarray chip as described in this manuscript.
(See figure on previous page.)
Figure 3Expressionanalysis of selected genes in response to varying Fe availability.Expression ofa, f)OsDMAS1.b, g)chr9_-_4113943-4114041.
c)chr6_ + _23392831-23392944.d)chr6_ + _29900249-29900395.e)Os01g0127000.h)OsFRO2.i)Os07g0142100.j)chr7_-_23991237-23991350.a-e)Root.
f-g)Shoot. The graph shows mean ± s.d. relative to the expression ofα-tubulin. Vertical bars followed by different letters are significantly different from each other, according to the Tukey-Kramer test (p< 0.05;n= 3).
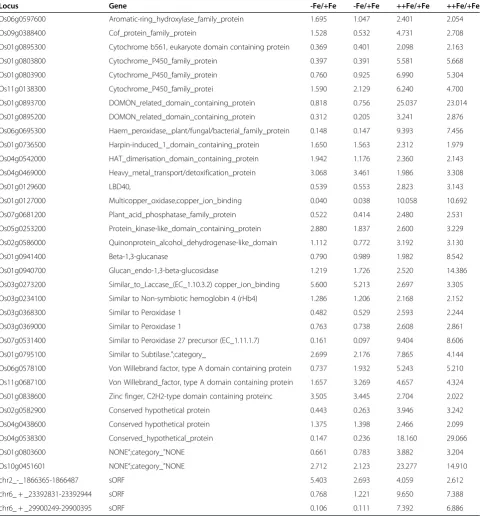
Table 2 Genes upregulated by excess Fe in roots
Locus Gene -Fe/+Fe -Fe/+Fe ++Fe/+Fe ++Fe/+Fe
Os06g0597600 Aromatic-ring_hydroxylase_family_protein 1.695 1.047 2.401 2.054
Os09g0388400 Cof_protein_family_protein 1.528 0.532 4.731 2.708
Os01g0895300 Cytochrome b561, eukaryote domain containing protein 0.369 0.401 2.098 2.163
Os01g0803800 Cytochrome_P450_family_protein 0.397 0.391 5.581 5.668
Os01g0803900 Cytochrome_P450_family_protein 0.760 0.925 6.990 5.304
Os11g0138300 Cytochrome_P450_family_protei 1.590 2.129 6.240 4.700
Os01g0893700 DOMON_related_domain_containing_protein 0.818 0.756 25.037 23.014
Os01g0895200 DOMON_related_domain_containing_protein 0.312 0.205 3.241 2.876
Os06g0695300 Haem_peroxidase,_plant/fungal/bacterial_family_protein 0.148 0.147 9.393 7.456
Os01g0736500 Harpin-induced_1_domain_containing_protein 1.650 1.563 2.312 1.979
Os04g0542000 HAT_dimerisation_domain_containing_protein 1.942 1.176 2.360 2.143
Os04g0469000 Heavy_metal_transport/detoxification_protein 3.068 3.461 1.986 3.308
Os01g0129600 LBD40, 0.539 0.553 2.823 3.143
Os01g0127000 Multicopper_oxidase,copper_ion_binding 0.040 0.038 10.058 10.692
Os07g0681200 Plant_acid_phosphatase_family_protein 0.522 0.414 2.480 2.531
Os05g0253200 Protein_kinase-like_domain_containing_protein 2.880 1.837 2.600 3.229
Os02g0586000 Quinonprotein_alcohol_dehydrogenase-like_domain 1.112 0.772 3.192 3.130
Os01g0941400 Beta-1,3-glucanase 0.790 0.989 1.982 8.542
Os01g0940700 Glucan_endo-1,3-beta-glucosidase 1.219 1.726 2.520 14.386
Os03g0273200 Similar_to_Laccase_(EC_1.10.3.2) copper_ion_binding 5.600 5.213 2.697 3.305
Os03g0234100 Similar to Non-symbiotic hemoglobin 4 (rHb4) 1.286 1.206 2.168 2.152
Os03g0368300 Similar to Peroxidase 1 0.482 0.529 2.593 2.244
Os03g0369000 Similar to Peroxidase 1 0.763 0.738 2.608 2.861
Os07g0531400 Similar to Peroxidase 27 precursor (EC_1.11.1.7) 0.161 0.097 9.404 8.606
Os01g0795100 Similar to Subtilase.”;category_ 2.699 2.176 7.865 4.144
Os06g0578100 Von Willebrand factor, type A domain containing protein 0.737 1.932 5.243 5.210
Os11g0687100 Von Willebrand_factor, type A domain containing protein 1.657 3.269 4.657 4.324
Os01g0838600 Zinc finger, C2H2-type domain containing proteinc 3.505 3.445 2.704 2.022
Os02g0582900 Conserved hypothetical protein 0.443 0.263 3.946 3.242
Os04g0438600 Conserved hypothetical protein 1.375 1.398 2.466 2.099
Os04g0538300 Conserved_hypothetical_protein 0.147 0.236 18.160 29.066
Os01g0803600 NONE“;category_”NONE 0.661 0.783 3.882 3.204
Os10g0451601 NONE“;category_”NONE 2.712 2.123 23.277 14.910
chr2_-_1866365-1866487 sORF 5.403 2.693 4.059 2.612
chr6_ + _23392831-23392944 sORF 0.768 1.221 9.650 7.388
chr6_ + _29900249-29900395 sORF 0.106 0.111 7.392 6.886
is unknown if the generation of ROS is a direct effect of increased Fe concentrations or is the result of an increased metabolic rate, as suggested by our MapMan analysis.
In shoots, the expression of OsLhcb1.3(Os01g0720500) was significantly upregulated after treatment with excess Fe. The photosynthetic apparatus of barley adapts to Fe deficiency by remodeling its PSII antenna system, in which the expression of twoHvlhcb1genes (HvLhcb1.11and
HvLhcb1.12) is upregulated, and four genes (HvLhcb1.6-9)
are downregulated by Fe deficiency (Saito et al. 2010). Although it was not assessed experimentally, it is possible that these downregulated genes would be up-regulated in response to excess Fe. Additional genes re-lated to PSII were also upregure-lated, suggesting that the rate of photosynthesis is increased due to the increased availability of Fe.
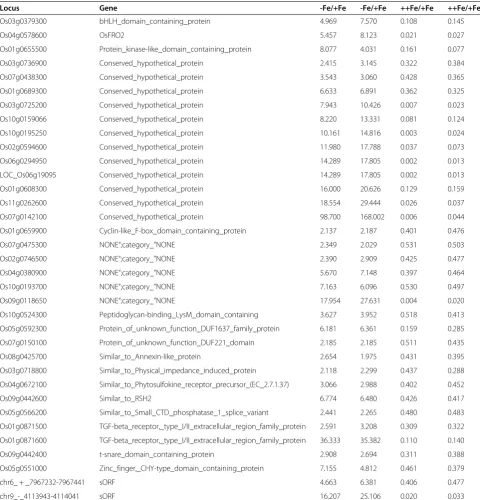
The role of ethylene signaling in abiotic stress, in-cluding Fe deficiency, has been discussed extensively Table 3 Genes upregulated by Fe deficiency and downregulated by excess Fe in shoots
Locus Gene -Fe/+Fe -Fe/+Fe ++Fe/+Fe ++Fe/+Fe
Os03g0379300 bHLH_domain_containing_protein 4.969 7.570 0.108 0.145
Os04g0578600 OsFRO2 5.457 8.123 0.021 0.027
Os01g0655500 Protein_kinase-like_domain_containing_protein 8.077 4.031 0.161 0.077
Os03g0736900 Conserved_hypothetical_protein 2.415 3.145 0.322 0.384
Os07g0438300 Conserved_hypothetical_protein 3.543 3.060 0.428 0.365
Os01g0689300 Conserved_hypothetical_protein 6.633 6.891 0.362 0.325
Os03g0725200 Conserved_hypothetical_protein 7.943 10.426 0.007 0.023
Os10g0159066 Conserved_hypothetical_protein 8.220 13.331 0.081 0.124
Os10g0195250 Conserved_hypothetical_protein 10.161 14.816 0.003 0.024
Os02g0594600 Conserved_hypothetical_protein 11.980 17.788 0.037 0.073
Os06g0294950 Conserved_hypothetical_protein 14.289 17.805 0.002 0.013
LOC_Os06g19095 Conserved_hypothetical_protein 14.289 17.805 0.002 0.013
Os01g0608300 Conserved_hypothetical_protein 16.000 20.626 0.129 0.159
Os11g0262600 Conserved_hypothetical_protein 18.554 29.444 0.026 0.037
Os07g0142100 Conserved_hypothetical_protein 98.700 168.002 0.006 0.044
Os01g0659900 Cyclin-like_F-box_domain_containing_protein 2.137 2.187 0.401 0.476
Os07g0475300 NONE“;category_”NONE 2.349 2.029 0.531 0.503
Os02g0746500 NONE“;category_”NONE 2.390 2.909 0.425 0.477
Os04g0380900 NONE“;category_”NONE 5.670 7.148 0.397 0.464
Os10g0193700 NONE“;category_”NONE 7.163 6.096 0.530 0.497
Os09g0118650 NONE“;category_”NONE 17.954 27.631 0.004 0.020
Os10g0524300 Peptidoglycan-binding_LysM_domain_containing 3.627 3.952 0.518 0.413
Os05g0592300 Protein_of_unknown_function_DUF1637_family_protein 6.181 6.361 0.159 0.285
Os07g0150100 Protein_of_unknown_function_DUF221_domain 2.185 2.185 0.511 0.435
Os08g0425700 Similar_to_Annexin-like_protein 2.654 1.975 0.431 0.395
Os03g0718800 Similar_to_Physical_impedance_induced_protein 2.118 2.299 0.437 0.288
Os04g0672100 Similar_to_Phytosulfokine_receptor_precursor_(EC_2.7.1.37) 3.066 2.988 0.402 0.452
Os09g0442600 Similar_to_RSH2 6.774 6.480 0.426 0.417
Os05g0566200 Similar_to_Small_CTD_phosphatase_1_splice_variant 2.441 2.265 0.480 0.483
Os01g0871500 TGF-beta_receptor,_type_I/II_extracellular_region_family_protein 2.591 3.208 0.309 0.322
Os01g0871600 TGF-beta_receptor,_type_I/II_extracellular_region_family_protein 36.333 35.382 0.110 0.140
Os09g0442400 t-snare_domain_containing_protein 2.908 2.694 0.311 0.388
Os05g0551000 Zinc_finger,_CHY-type_domain_containing_protein 7.155 4.812 0.461 0.379
chr6_ + _7967232-7967441 sORF 4.663 6.381 0.406 0.477
chr9_-_4113943-4114041 sORF 16.207 25.106 0.020 0.033
(Lingam et al. 2011). Ethylene may also play a significant role in signaling under conditions of excess Fe, since two rice ethylene response factor-3 (OsERF3) genes which regulate ethylene synthesis (Zhang et al. 2013) were up-regulated in shoots in the presence of excess Fe. The expression of OsRab8A5, which may be involved in signal transduction, was also upregulated. Upregulation of LONELY GUY, a cytokinin-activating enzyme that regulates activation pathways in rice shoot meristems (Kurakawa et al. 2007), transcription factors such as
OsMADS18 and OsMADS56 involved in regulating
long-day-dependent flowering (Ryu et al. 2009) suggest that plant growth and cell division are significantly increased in shoots under conditions of excess Fe. In addition, our MapMan analysis suggested that genes that regulate metabolism are also upregulated in shoots in the response to excess amounts of Fe.
The activity and expression of glutathione reductase (GR) is already reported to change in response to Fe de-ficiency (Bashir et al. 2007), while in present experiment upregulation of OsGR1 was observed in response to excess Fe. Similarly, the expression of NADPH HC toxin reductase, which is reported to be regulated by Cu toxicity (Lin et al. 2013), also increased by excess Fe. Genes involved in brassinosteroids synthesis were also upregulated. In rice, brassinosteroids regulate multiple
developmental processes and modulate several import-ant traits such as height, leaf angle, fertility, and seed fill-ing (Wang et al. 2010). These results further support the hypothesis that plant metabolism and growth are stimu-lated under conditions of excess Fe.
The expression ofOsWSL2, which is associated with the elongation of very long-chain fatty acids, andOs9BGlu32
was significantly upregulated by excess Fe. Although the function of Os9BGlu32 is unknown, it is a close homolog of Os9BGlu31, which equilibrates the levels of phenolic acids and carboxylated phytohormones and their gluco-conjugates (Luang et al. 2013). The role of phenolic trans-port in Fe deficiency has been retrans-ported (Bashir et al. 2011b; Ishimaru et al. 2011b; Ishimaru et al. 2011a; Jin et al. 2007), and it is possible that these phenolics act as antioxidants in the presence of excess Fe. Although the microarray analysis indicates that metabolic rate may in-crease in response to excess Fe, plants still retain many re-sponses common to different biotic and abiotic stresses. Despite the increased metabolic rate, excess Fe cannot therefore be considered optimal for rice plants, at least under the current growth conditions.
The expression of one 2OG-Fe(II) oxygenase (Os10g0559500) was upregulated by Fe deficiency, whereas one gene (Os08g0392100) was upregulated by excess Fe. In plants, 2OG-Fe(II) oxygenase are involved in the synthesis of Table 4 Gene ontology analysis of genes upregulated by excess Fe in shoots
GO ID GO term Query Total *FDR
GO:0006412 Translation 19 683 2.40E-14
GO:0010467 Gene expression 25 2581 6.40E-09
GO:0044249 Cellular biosynthetic process 29 5899 0.00013
GO:0044267 Cellular protein metabolic process 19 2983 0.00013
GO:0034645 Cellular macromolecule biosynthetic process 24 5248 0.00082
GO:0055086 Nucleobase, nucleoside and nucleotide metabolic 5 275 0.0013
GO:0006091 Generation of precursor metabolites and energy 5 308 0.002
GO:0044237 Cellular metabolic process 32 10813 0.041
GO:0003735 Structural constituent of ribosome 19 455 2.20E-18
GO:0005198 Structural molecule activity 19 531 1.80E-17
GO:0015935 Small ribosomal subunit 17 59 7.60E-31
GO:0030529 Ribonucleoprotein complex 20 503 1.20E-18
GO:0005840 Ribosome 19 456 2.70E-18
GO:0032991 Macromolecular complex 25 1365 3.10E-15
GO:0005737 Cytoplasm 20 1271 1.40E-11
GO:0043228 Non-membrane-bounded organelle 19 1590 2.90E-09
GO:0005622 intracellular 28 4460 5.10E-07
GO:0043226 organelle 22 3164 1.10E-06
GO:0005623 cell 28 6353 0.00015
GO:0043234 protein complex 5 799 0.04
Table 5 Genes upregulated by excess Fe and downregulated by Fe deficiency in shoots
Locus Gene -Fe/+Fe -Fe/+Fe ++Fe/+Fe +Fe/+Fe
Os11g0140600 Annexin,_type_VII_family_protein 0.134 0.381 8.732 11.011
LOC_Os03g26100 cDNA transposon protein, putative, unclassified 0.165 0.406 13.344 8.324
LOC_Os05g22840 Conserved_hypothetical_protein 0.154 0.264 4.270 3.790
LOC_Os08g38140 Conserved_hypothetical_protein 0.520 0.542 2.090 2.512
Os01g0559200 Conserved_hypothetical_protein 0.175 0.308 2.070 2.532
Os02g0184100 Conserved_hypothetical_protein 0.447 0.534 2.255 2.249
Os08g0359900 Conserved_hypothetical_protein 0.442 0.448 2.791 3.276
Os05g0556400 DOMON_related_domain_containing_protein 0.415 0.486 2.534 2.959
Os02g0802200 Glycoside_hydrolase_family_79 0.538 0.536 2.711 2.190
Os05g0134400 Heme_peroxidase 0.544 0.530 2.600 2.714
Os02g0135100 NONE“;category_”NONE 0.534 0.502 2.722 2.843
Os05g0124900 NONE“;category_”NONE 0.041 0.184 4.779 4.932
Os06g0104800 NONE“;category_”NONE 0.434 0.449 5.629 8.412
Os07g0407300 NONE“;category_”NONE 0.247 0.491 6.269 8.481
Os08g0149701 NONE“;category_”NONE 0.208 0.413 2.114 2.395
Os09g0286700 NONE“;category_”NONE 0.104 0.388 13.768 14.613
Os09g0332540 NONE“;category_”NONE 0.037 0.181 15.617 15.984
LOC_Os09g16320 NONE“;category_”NONE 0.037 0.181 15.617 15.984
Os09g0377400 NONE“;category_”NONE 0.351 0.390 3.487 4.615
Os10g0330950 NONE“;category_”NONE 0.305 0.382 3.141 3.059
Os11g0586700 NONE“;category_”NONE 0.121 0.312 2.744 2.357
Os01g0619900 Non-protein_coding_transcript 0.246 0.492 5.356 3.120
Os03g0846250 Non-protein_coding_transcript 0.326 0.541 2.406 2.861
Os01g0720500 OsLhcb1.3 0.298 0.423 2.166 2.575
Os02g0443000 Prefoldin_domain_containing_protein 0.173 0.333 3.485 2.818
Os04g0649900 Protein_of_unknown_function_DUF579,family_protein 0.371 0.546 2.357 2.273
Os01g0909400 Protein_of_unknown_function_DUF868,family_protein 0.349 0.521 2.585 3.464
Os03g0305000 Similar_to_AMP-binding_protein 0.283 0.508 2.729 2.443
Os09g0426800 Similar_to_Glossy1_protein.“;category_”II_: 0.260 0.204 2.998 2.006
Os12g0169000 Similar_to_N-acylethanolamine_amidohydrolase 0.434 0.470 2.253 4.054
Os04g0271000 Similar_to_NAD-dependent_deacetylase 0.252 0.505 2.511 2.397
Os04g0538400 Similar_to_Nodulin_21_(N-21) 0.003 0.003 3.385 3.991
Os03g0719900 Similar_to_Peptide_transporter_1 0.455 0.460 4.535 2.624
Os05g0242166 Similar_to_Photosystem_I_reaction_centre_subunit_N 0.210 0.470 2.200 3.465
chr1_-_1443442-1443819 sORF 0.447 0.516 3.455 3.908
chr1_-_10477792-10477944 sORF 0.193 0.308 19.218 21.518
chr3_ + _35148650-35148835 sORF 0.071 0.413 52.628 88.277
chr4_-_7821106-7821402 sORF 0.252 0.464 10.953 12.886
chr4_-_16469013-16469153 sORF 0.142 0.389 2.807 2.190
chr5_ + _8517789-8518034 sORF 0.169 0.077 36.793 13.034
chr7_-_23991237-23991350 sORF 0.171 0.452 35.318 25.773
chr8_ + _9042728-9042955 sORF 0.110 0.366 12.118 9.071
chr9_ + _5568388-5568600 sORF 0.228 0.502 4.912 4.826
phytosiderophores (Nakanishi et al. 2000) and numerous other biosynthesis pathways. It was recently suggested that plant 2OG-Fe(II) oxygenases play a role in Fe sensing and metabolism reprograming under Fe-deficient conditions (Vigani et al. 2013). The upregulation of different 2’-OG dioxygenases by opposing conditions of Fe deficiency and excess suggests that these genes are involved in Fe sensing during altered Fe availability.
Changes in expression of sORFs in response to Fe deficiency and Excess
In roots, three sORF genes were upregulated by Fe defi-ciency and downregulated by excess Fe. Our co-expression analysis revealed that these three sORFs are not only posi-tively co-regulated with each other, but also with several other genes presented in Table 1. Specifically, OsIRO2,
MIR, OPT, eight conserved hypothetical protein genes, and twosORFgenes showed a strong positive correlation (r< 0.8) when co-expression analysis was carried out for the third sORF (chr9_-_4113943-4114041). Seven sORF genes (chr1_ + _43772594-43772752,chr12_-_7456469-745 6567, chr4_-_24346205-24346330, chr4_-_5708578-57087 48, chr5_ + _27469071-27469241, chr6_ + _7967232-7967 441, andchr9_-_4113943-4114041) were upregulated by Fe deficiency in both roots and shoots (Additional file 2: Table S8). The upregulation of several sORFs was also confirmed through real time PCR analysis (Figure 3). Among these, very high expression of chr9_-_4113943-4114041 was ob-served particularly in shoot tissue (Figure 3b, g). Among these sORFs, the expression of chr1_ + _43772594-4377 2752is not regulated by any other known stresses, accord-ing to HanaDB-OS (http://evolver.psc.riken.jp/seiken/OS/ index.html), whereas the expression of chr9_-_4113943-4114041is significantly downregulated in roots in response to other abiotic stresses such as drought, heat, and salt. It is therefore possible that these sORFs play a signifi-cant role (e.g., signalling) during Fe deficiency. Further characterization of these sORFs will help clarify their role in abiotic stress responses.
Conclusion
Transcriptomic and physiological changes that occur in response to short- and long-term Fe toxicity have been reported (Quinet et al. 2012). However, our aim was to study the response to excess Fe, and to understand the specific responses of rice to varying Fe concentrations in roots and shoots. Our microarray analysis revealed that cellular metabolism was significantly reprogrammed in response to Fe deficiency and upregulated by excess Fe in shoots even though no morphological changes were observed in shoots under conditions of excess Fe. In addition to the upregulation of genes involved in various metabolic processes, our data suggest increased produc-tion of flavonoids and phenols, which may act as
antioxidants. The expression of various transporters was also significantly upregulated, which suggests that these transporters coordinate the metabolic changes. Although the responses to Fe deficiency and excess share compo-nents with other stress responses, it does not signifi-cantly overlap with one particular stress. Moreover, our data reveal that the expression of several sORFs changes with varying Fe availability and that sORFs are co-regulated with other genes involved in Fe deficiency re-sponse, suggesting that they are involved in the response to Fe deficiency and/or excess in rice plants. However, the precise function of these sORFs is unclear. Because the products of these sORFs do not contain any charac-terized domains, it will be challenging to assess their function in response to different abiotic stresses.
It should be noted that the changes in the transcrip-tome are not specific to Fe, because the concentrations of Cu, Zn, and Mn changed in shoots with perturbations in the Fe level: Cu and Zn were increased during Fe defi-ciency, while Mn and Cu were increased with excess Fe (Figure 1). As a result, the observed changes in the tran-scriptome also represent changes in the availability of other metals. Indeed many of the genes reported to be regulated by metal deficiencies such as Zn deficiency changes in response to varying Fe availability (Ishimaru et al. 2012; Suzuki et al. 2012; Bashir et al. 2012; Takahashi et al. 2012). These analyses also reveal significant informa-tion about the regulainforma-tion of sORFs in response to Fe defi-ciency and excess. Despite the rapid progress in genomics, uncharacterized and hypothetical genes still represent a large proportion of the rice genome. Understanding the role of these uncharacterized genes, including sORFs, is an important step in comprehensive understanding of the plants’response to different abiotic stresses (Hanada et al. 2007; Hanada et al. 2010).
Methods
Plant materials and growth conditions
were prepared for each treatment. For the Fe deficiency and excess treatments, four-week-old plants were trans-ferred to nutrient solution containing 0 (Fe deficiency), 100 (Control), or 500 (excess Fe)μM Fe-EDTA and culti-vated for one week. The pH of the nutrient solution was adjusted daily to 5.5, and was renewed weekly. The plants were harvested at noon.
RT-PCR and microarray analyses
For each treatment, RNA was extracted from six plants in duplicate (two biological replicates, each including six plants). RT-PCR was performed as described previ-ously (Bashir et al. 2011c), using the primersOsDMAS1
RT (forward) 5‘-GCCGGCATCCCGCAGCGGAAGATC A-3’andOsDMAS1RT (reverse) 5‘-CTCTCTCTCTCGCA CGTGCTAGCGT-3’. The primers used to assessosvit2by RT-PCR (qRT-PCR) were (forward) 5‘-AAGGCCTGGCTC GAATTCATG-3’ and (reverse) 5‘-GTGTATTAGATGTT CTGGAGGTG-3’. Theα-tubulin primers used were (for-ward) 5‘-TCTTCCACCCTGAGCAGCTC-3’and (reverse) 5‘-AACCTTGGAGACCAGTGCAG-3’. Primers used for real time PCR were as followsOsDMAS1, (forward) 5‘-GA GGAGGAGAGGCAGAGGAT-3’and (reverse) 5‘-TCAAC ACGATCGTCAAGAGC-3’,OsFRO2(forward) 5‘-GCCAG ATGTTCGAGCTCTTC-3’and (reverse) 5‘-GGGCTTTTG CAGAAGTTGAG-3’, Os01g0127000 (forward) 5‘-GAGAA CATGACGAGCAACGA-3’ and (reverse) 5‘-AGCATGC AGCTCTTGAAGGT-3,’ Os07g0142100 (forward) 5‘-CGT CTTCCTCGATAGCCAAA-3’ and (reverse) 5‘-AGCTGG AGCCACATCGAC-3’, chr6_ + _23392831-23392944 (for-ward) 5‘-TCGTGTGTAATAATATGGGCTGTT-3’and (re-verse) 5‘-GGATACAATGGGAAATGAGCA-3’,chr6_ + _29
900249-29900395(forward) 5‘-CACACGTGCGAGATCTA
CCT-3’and (reverse) 5‘ -AAAGGAAAGATTGCCATCCA-3’, chr7_-_23991237-23991350 (forward) 5‘-ATGTTCTA CCCCATGCCACT-3’and (reverse) 5‘ -ATGTCGCTGGA-CACCCTAAC-3’, chr9_-_4113943-4114041were (forward) 5‘-GGCCTGTGCTAGTTTTGGTG-3’and (reverse) 5‘-AT GGGCGCAAATTACATCAT-3’ respectively. All experi-ments were performed in a minimum of triplicates.
The microarray slides were custom-designed and con-tained 101,720, 60 mer probes. Of these, 48,620 were for sORFs, 50,962 probes represented RAP-DB, and the rest belonged to TIGR. For our microarray analysis, RNA was labelled using an Agilent Low RNA Input Linear Amplification Kit (Agilent Technologies Inc., Santa Clara, CA), following the manufacturer’s instructions. The microarray analyses were performed as described previ-ously (Hanada et al. 2013) with the exception that two biological replicates were used. Data analysis was per-formed using Feature Extraction and Image Analysis soft-ware (Agilent Technologies Inc.) and Microarray Suite (Affymetrix, Santa Clara, CA), and normalized and proc-essed as described (Hanada et al. 2013). Those genes with
a low signal intensity (<300) were filtered to focus on genes that were highly expressed under conditions of Fe deficiency and excess. For our MapMan analysis, the average log2 value of both biological replicates was calculated for individual annotations in response to Fe deficiency and excess in roots and shoots. This log2 value was then used to compare the transcriptomic changes in metabolism-related genes using MapMan 3.5.1R2 (Thimm et al. 2004). Our gene ontology analyses were carried out at http://www.geneontology.org/. Coex-pression analyses were done at http://evolver.psc.riken.jp/ seiken/OS/co-express.html. This database contains micro-array data of 40 different experimental conditions ob-tained through microarray analysis using the same custom microarray chip as described in this manuscript.
Determination of metal concentrations
Roots were washed with de-ionized water before harvest-ing. Leaf and root samples were dried for three days at 70°C, and then digested with 3 ml of 13 M HNO3at 220°C for 40 min using a MARS XPRESS microwave reaction system (CEM, Matthews, NC). All samples were processed with four biological replicates. After digestion, the samples were collected, diluted to 5 ml, and analyzed by ICP-AES (SPS1200VR; Seiko, Tokyo, Japan), as described previously (Ishimaru et al. 2011b; Ishimaru et al. 2007).
Recording of the morphological characteristics of the plants Root and shoot lengths were measured using a scale. The degree of chlorosis in the youngest fully expanded leaf was determined using a SPAD-502 chlorophyll meter (Minolta Co., Tokyo, Japan), as described previously (Ishimaru et al. 2012).
Additional files
Additional file 1: Figure S1.Expression ofOsVIT2andOsDMAS1under Fe deficiency and excess Fe.Figure S2.Transcriptional changes in metabolism related genes in roots of Fe-deficient and excess Fe rice as predicted by MapMan 3.5.1R2.Figure S3.Transcriptional changes in metabolism related genes in shoots of Fe-deficient and excess Fe rice as predicted by MapMan 3.5.1R2.Figure S4.Summary of transcriptional changes in chloroplast of Fe-deficient and excess Fe rice shoots as predicted by MapMan 3.5.1R2.
Additional file 2: Table S1.Genes upgegulated by Fe deficiency in roots.Table S2.Genes down-gegulated by Fe excess in roots.Table S3.
Genes down-regulated by Fe Deficiency.Table S4.Genes upregulated by Fe deficiency in shoots.Table S5.Genes down regulated by Fe excess in shoots.Table S6.Genes upregulated by Fe excess in shoots.Table S7.
Genes down-regulated by Fe deficiency in shoots.Table S8.Genes upregulated by Fe deficiency in roots and shoots.
Abbreviations
Fe:Iron; sORF: Small open reading frames.
Competing interests
Authors’contributions
KB, KH and NN designed the study, KB, MS and KH performed the research, and KB, KH, MS, HN and NN discussed the data and wrote the manuscript. All authors read and approved the final manuscript.
Acknowledgements
This work was supported by a grant from the Ministry of Agriculture, Forestry, and Fisheries of Japan (Green Technology Project IP-5003).
Author details
1
Laboratory of Plant Biotechnology, Department of Global Agricultural Sciences, Graduate School of Agricultural and Life Sciences, The University of Tokyo, 1-1-1 Yayoi, Bunkyo-ku, Tokyo 113-8657, Japan.2Plant Genomics Network Research Team, Center for Sustainable Resource Science, RIKEN Yokohama Campus, 1-7-22 Suehiro-cho, Tsurumi-ku, Yokohama City, Kanagawa 230-0045, Japan.3Gene Discovery Research Group, Center for Sustainable Resource Science, RIKEN Yokohama Campus, 1-7-22 Suehiro-cho, Tsurumi-ku, Yokohama City, Kanagawa 230-0045, Japan.4Frontier Research Academy for Young Researchers, Department of Bioscience and Bioinformatics, Kyusyu Institute of Technology, Iizuka, Fukuoka 820-8502, Japan.5Kihara Institute for Biological Research, Yokohama City University, 22-2 Seto, Kanazawa-ku, Yokohama 236-0027, Japan.6Research Institute for Bioresources and Biotechnology, Ishikawa Prefectural University, 1-308 Suematsu, Nonoichi-shi, Ishikawa 921-8836, Japan.
Received: 10 April 2014 Accepted: 23 July 2014
References
Aoyama T, Kobayashi T, Takahashi M, Nagasaka S, Usuda K, Kakei Y, Ishimaru Y, Nakanishi H, Mori S, Nishizawa NK (2009) OsYSL18 is a rice iron(III)– deoxymugineic acid transporter specifically expressed in reproductive organs and phloem of lamina joints. Plant Mol Biol 70(6):681–692
Bashir K, Inoue H, Nagasaka S, Takahashi M, Nakanishi H, Mori S, Nishizawa NK (2006) Cloning and characterization of deoxymugineic acid synthase genes from graminaceous plants. J Biol Chem 281(43):32395–32402
Bashir K, Ishimaru Y, Nishizawa NK (2010) Iron uptake and loading into rice grains. Rice 3(2):122–130
Bashir K, Ishimaru Y, Nishizawa NK (2011a) Identification and characterization of the major mitochondrial Fe transporter in rice. Plant Signal & Behav 6(10):1591–1593
Bashir K, Ishimaru Y, Nishizawa NK (2012) Molecular mechanisms of zinc uptake and translocation in rice. Plant Soil 361:189–201
Bashir K, Ishimaru Y, Shimo H, Kakei Y, Senoura T, Takahashi R, Sato Y, Sato Y, Uozumi N, Nakanishi H, Nishizawa NK (2011b) Rice phenolics efflux transporter 2 (PEZ2) plays an important role in solubilizing apoplasmic iron. Soil Sci Plant Nutr 57(6):803–812
Bashir K, Ishimaru Y, Shimo H, Nagasaka S, Fujimoto M, Takanashi H, Tsutsumi N, An G, Nakanishi H, Nishizawa NK (2011c) The rice mitochondrial iron transporter is essential for plant growth. Nature Commun 2:322. doi:10.1038/ncomms1326
Bashir K, Nagasaka S, Itai RN, Kobayashi T, Takahashi M, Nakanishi H, Mori S, Nishizawa NK (2007) Expression and enzyme activity of glutathione reductase is upregulated by Fe–deficiency in graminaceous plants. Plant Mol Biol 65(3):277–284
Bashir K, Nishizawa N (2013) Iron proteins, plant iron transporters. In: Kretsinger R, Uversky V, Permyakov E (eds) Encyclopedia of metalloproteins. Springer, New York, pp 1015–1023
Bashir K, Nishizawa NK (2006) Deoxymugineic acid synthase: a gene important for Fe–acquisition and homeostasis. Plant Signal & Behav 1(6):290–292 Bashir K, Nozoye T, Ishimaru Y, Nakanishi H, Nishizawa NK (2013a) Exploiting new
tools for iron bio-fortification of rice. Biotech Advances 31(8):1624–1633 Bashir K, Takahashi R, Akhtar S, Ishimaru Y, Nakanishi H, Nishizawa NK (2013b) The
knockdown ofOsVIT2andMITaffects iron localization in rice seed. Rice 6(1):1–7. doi:10.1186/1939-8433-6-31
Bashir K, Takahashi R, Nakanishi H, Nishizawa NK (2013c) The road to micronutrient biofortification of rice: progress and prospects. Front Plant Sci 4(15): doi:10.3389/fpls.2013.00015
Brunings AM, Datnoff LE, Ma JF, Mitani N, Nagamura Y, Rathinasabapathi B, Kirst M (2009) Differential gene expression of rice in response to silicon and rice blast fungusMagnaporthe oryzae. Ann Appl Biol 155(2):161–170
Egan S, Bolger P, Carrington C (2007) Update of US FDA’s total diet study food list and diets. J Exp Sci Environ Epid 17:573–582
Fageria NK, Santos AB, Barbosa Filho MP, Guimarães CM (2008) Iron toxicity in lowland rice. J Plant Nutr 31(9):1676–1697
Guerinot ML (2010) Iron. In: Hell R, Mendel R–R (eds) Cell Biology of Metals and Nutrients, vol 17. Plant Cell Monographs. Springer Berlin, Heidelberg, pp 75–94 Guerinot ML, Ying Y (1994) Iron: nutritious, noxious, and not readily available.
Plant Physiol 104:815–820
Hanada K, Akiyama K, Sakurai T, Toyoda T, Shinozaki K, Shiu SH (2010) sORF finder: a program package to identify small open reading frames with high coding potential. Bioinform 26(3):399–400
Hanada K, Higuchi–Takeuchi M, Okamoto M, Yoshizumi T, Shimizu M, Nakaminami K, Nishi R, Ohashi C, Iida K, Tanaka M, Horii Y, Kawashima M, Matsui K, Toyoda T, Shinozaki K, Seki M, Matsui M (2013) Small open reading frames associated with morphogenesis are hidden in plant genomes. Proc Natl Acad Sci 110(6):2395–2400
Hanada K, Zhang X, Borevitz JO, Li WH, Shiu SH (2007) A large number of novel coding small open reading frames in the intergenic regions of the Arabidopsis thaliana genome are transcribed and/or under purifying selection. Genome Res 17(5):632–640
Inoue H, Higuchi K, Takahashi M, Nakanishi H, Mori S, Nishizawa NK (2003) Three rice nicotianamine synthase genes,OsNAS1,OsNAS2, andOsNAS3are expressed in cells involved in long–distance transport of iron and differentially regulated by iron. Plant J 36(3):366–381
Inoue H, Kobayashi T, Nozoye T, Takahashi M, Kakei Y, Suzuki K, Nakazono M, Nakanishi H, Mori S, Nishizawa NK (2009) Rice OsYSL15 is an iron–regulated Iron (III)–deoxymugineic acid transporter expressed in the roots and is essential for iron uptake in early growth of the seedlings. J Biol Chem 284(6):3470–3479 Inoue H, Takahashi M, Kobayashi T, Suzuki M, Nakanishi H, Mori S, Nishizawa NK
(2008) Identification and localisation of the rice nicotianamine aminotransferase gene OsNAAT1 expression suggests the site of phytosiderophore synthesis in rice. Plant Mol Biol 66(1):193–203 Ishimaru Y, Bashir K, Fujimoto M, An G, Itai RN, Tsutsumi N, Nakanishi H,
Nishizawa NK (2009) Rice-specific mitochondrial iron–regulated gene (MIR) plays an important role in iron homeostasis. Mol Plant 2(5):1059–1066 Ishimaru Y, Bashir K, Nakanishi H, Nishizawa NK (2011a) The role of rice phenolics
efflux transporter in solubilizing apoplasmic iron. Plant Signal & Behav 6 (10):1624–1626
Ishimaru Y, Kakei Y, Shimo H, Bashir K, Sato Y, Sato Y, Uozumi N, Nakanishi H, Nishizawa NK (2011b) A rice phenolic efflux transporter is essential for solubilizing precipitated apoplasmic iron in the plant stele. J Biol Chem 286(28):24649–24655 Ishimaru Y, Kim S, Tsukamoto T, Oki H, Kobayashi T, Watanabe S, Matsuhashi S,
Takahashi M, Nakanishi H, Mori S, Nishizawa NK (2007) Mutational reconstructed ferric chelate reductase confers enhanced tolerance in rice to iron deficiency in calcareous soil. Proc Natl Acad Sci 104(18):7373–7378 Ishimaru Y, Masuda H, Bashir K, Inoue H, Tsukamoto T, Takahashi M, Nakanishi H,
Aoki N, Hirose T, Ohsugi R, Nishizawa NK (2010) Rice metal-nicotianamine transporter, OsYSL2, is required for the long–distance transport of iron and manganese. Plant J 62(3):379–390
Ishimaru Y, Takahashi R, Bashir K, Shimo H, Senoura T, Sugimoto K, Ono K, Yano M, Ishikawa S, Arao T, Nakanishi H, Nishizawa NK (2012) Characterizing the role of rice NRAMP5 in manganese, iron and cadmium transport. Sci Rep 2:286. doi:10.1038/srep00286
Itai RN, Ogo Y, Kobayashi T, Nakanishi H, Nishizawa NK (2013) Rice genes involved in phytosiderophore biosynthesis are synchronously regulated during the early stages of iron deficiency in roots. Rice 6:16. doi:10.1186/1939-8433-6-16 Jin CW, You GY, He YF, Tang C, Wu P, Zheng SJ (2007) Iron deficiency-induced
secretion of phenolics facilitates the reutilization of root apoplastic iron in red clover. Plant Physiol 144(1):278–285
Kakei Y, Ishimaru Y, Kobayashi T, Yamakawa T, Nakanishi H, Nishizawa NK (2012) OsYSL16 plays a role in the allocation of iron. Plant Mol Biol 79(6):583–594 Kawahara Y, de la Bastide M, Hamilton J, Kanamori H, McCombie WR, Ouyang S,
Schwartz D, Tanaka T, Wu J, Zhou S, Childs K, Davidson R, Lin H, Quesada– Ocampo L, Vaillancourt B, Sakai H, Lee SS, Kim J, Numa H, Itoh T, Buell CR, Matsumoto T (2013) Improvement of the Oryza sativa Nipponbare reference genome using next generation sequence and optical map data. Rice 6(1):4. doi:10.1186/1939-8433-6-4
Kobayashi T, Nishizawa NK (2012) Iron uptake, translocation, and regulation in higher plants. Ann Rev Plant Biol 63(1):131–152
Kobayashi T, Suzuki M, Inoue H, Itai RN, Takahashi M, Nakanishi H, Mori S, Nishizawa NK (2005) Expression of iron-acquisition-related genes in iron–deficient rice is co–ordinately induced by partially conserved iron–deficiency–responsive elements. J Exp Bot 56(415):1305–1316
Koike S, Inoue H, Mizuno D, Takahashi M, Nakanishi H, Mori S, Nishizawa NK (2004) OsYSL2 is a rice metal–nicotianamine transporter that is regulated by iron and expressed in the phloem. Plant J 39(3):415–424
Kurakawa T, Ueda N, Maekawa M, Kobayashi K, Kojima M, Nagato Y, Sakakibara H, Kyozuka J (2007) Direct control of shoot meristem activity by a cytokinin–activating enzyme. Nature 445(7128):652–655
Lee S, Chiecko JC, Kim SA, Walker EL, Lee Y, Guerinot ML, An G (2009) Disruption of OsYSL15 Leads to iron inefficiency in rice plants. Plant Physiol 150(2):786–800 Lee S, Ryoo N, Jeon JS, Guerinot M, An G (2012) Activation of riceYellow Stripe1-Like
16(OsYSL16) enhances iron efficiency. Mol Cells 33(2):117–126
Lin CY, Trinh N, Fu SF, Hsiung YC, Chia LC, Lin CW, Huang HJ (2013) Comparison of early transcriptome responses to copper and cadmium in rice roots. Plant Mol Biol 81(4–5):507–522
Lingam S, Mohrbacher J, Brumbarova T, Potuschak T, Fink–Straube C, Blondet E, Genschik P, Bauer P (2011) Interaction between the bHLH transcription factor FIT and ETHYLENE INSENSITIVE3/ETHYLENE INSENSITIVE3–LIKE1 reveals molecular linkage between the regulation of iron acquisition and ethylene signaling in arabidopsis. Plant Cell 23(5):1815–1829
Luang S, Cho JI, Mahong B, Opassiri R, Akiyama T, Phasai K, Komvongsa J, Sasaki N, Yl H, Matsuba Y, Ozeki Y, Jeon JS, Ketudat Cairns JR (2013) Rice Os9BGlu31 is a transglucosidase with the capacity to equilibrate phenolpropenoid, flavonoid and phytohormone glycoconjugates. J Biol Chem 288(14):10111–10123 Ma JF, Shinada T, Matsuda C, Nomoto K (1995) Biosynthesis of phytosiderophores,
mugineic acids, associated with methionine cycling. J Biol Chem 270(28):16549–16554
Ma JF, Taketa S, Chang Y–C, Iwashita T, Matsumoto H, Takeda K, Nomoto K (1999) Genes controlling hydroxylations of phytosiderophores are located on different chromosomes in barley (Hordeum vulgareL.). Planta 207(4):590–596 Marschner H (1995) Mineral nutrition of higher plants, 2nd edn. Academic, London Marschner H, Römheld V (1994) Strategies of plants for acquisition of iron. Plant
Soil 165(2):261–274
Mori S (1999) Iron acquisition by plants. Curr Opin Plant Biol 2(3):250–253 Mori S, Nishizawa NK (1987) Methionine as a dominant precursor of
phytosiderophores in graminaceae plants. Plant Cell Physiol 28(6):1081–1092 Nagasaka S, Takahashi M, Itai RN, Bashir K, Nakanishi H, Mori S, Nishizawa NK
(2009) Time course analysis of gene expression over 24 hours in Fe–deficient barley roots. Plant Mol Biol 69(5):621–631
Nakanishi H, Ogawa I, Ishimaru Y, Mori S, Nishizawa NK (2006) Iron deficiency enhances cadmium uptake and translocation mediated by the Fe2+
transporters OsIRT1 and OsIRT2 in rice. Soil Sci Plant Nutr 52(4):464–469 Nakanishi H, Yamaguchi H, Sasakuma T, Nishizawa NK, Mori S (2000) Two dioxygenase
genes, Ids3 and Ids2, from Hordeum vulgare are involved in the biosynthesis of mugineic acid family phytosiderophores. Plant Mol Biol 44(2):199–207 Negishi T, Nakanishi H, Yazaki J, Kishimoto N, Fujii F, Shimbo K, Yamamoto K,
Sakata K, Sasaki T, Kikuchi S, Mori S, Nishizawa NK (2002) cDNA microarray analysis of gene expression during Fe-deficiency stress in barley suggests that polar transport of vesicles is implicated in phytosiderophore secretion in Fe-deficient barley roots. Plant J 30(1):83–94
Neue HU, Quijano C, Senadhira D, Setter T (1998) Strategies for dealing with micronutrient disorders and salinity in lowland rice systems. Field Crop Res 56(1–2):139–155
Nozoye T, Inoue H, Takahashi M, Ishimaru Y, Nakanishi H, Mori S, Nishizawa NK (2007) The expression of iron homeostasis–related genes during rice germination. Plant Mol Biol 64(1):35–47
Nozoye T, Itai RN, Nagasaka S, Takahashi M, Nakanishi H, Mori S, Nishizawa NK (2004) Diurnal changes in the expression of genes that participate in phytosiderophore synthesis in rice. Soil Sci Plant Nutr 50:1125–1131 Nozoye T, Nagasaka S, Bashir K, Takahashi M, Kobayashi T, Nakanishi H, Nishizawa NK
(2014a) Nicotianamine synthase 2 localizes to the vesicles of iron-deficient rice roots, and its mutation in the YXXφor LL motif causes the disruption of vesicle formation or movement in rice. Plant J 77(2):246–260
Nozoye T, Tsunoda K, Nagasaka S, Bashir K, Takahashi M, Kobayashi T, Nakanishi H, Nishizawa NK (2014b) Rice nicotianamine synthase localizes to particular vesicles for proper function. Plant Signal Behav 9(3):e28660. doi:10.4161/psb.28660
Nozoye T, Nagasaka S, Kobayashi T, Takahashi M, Sato Y, Sato Y, Uozumi N, Nakanishi H, Nishizawa NK (2011) Phytosiderophore efflux transporters are crucial for iron acquisition in graminaceous plants. J Biol Chem 286(7):5446–5454
Okamoto M, Higuchi–Takeuchi M, Shimizu M, Shinozaki K, Hanada K (2014) Substantial expression of novel small open reading frames inOryza sativa. Plant Signal & Behav 9(1):e27848
Omote H, Hiasa M, Matsumoto T, Otsuka M, Moriyama Y (2006) The MATE proteins as fundamental transporters of metabolic and xenobiotic organic cations. Tren Pharmacol Sci 27(11):587–593
Qian H, Wang R, Chen J, Ding H, Yong W, Songlin R, Fu Z (2012) Analysis of enantioselective biochemical, physiological, and transcriptional effects of the chiral herbicide diclofop methyl on rice seedlings. J Agric Food Chem 60(22):5515–5523
Quinet M, Vromman D, Clippe A, Bertin P, Lequeux H, Dufey I, Lutts S, LefÈVre I (2012) Combined transcriptomic and physiological approaches reveal strong differences between short–and long–term response of rice (Oryza sativa) to iron toxicity. Plant Cell Environ 35(10):1837–1859
Ryu CH, Lee S, Cho LH, Kim SL, Lee YS, Choi SC, Jeong HJ, Yi J, Park SJ, Han CD, An G (2009) OsMADS50 and OsMADS56 function antagonistically in regulating long day (LD)-dependent flowering in rice. Plant Cell Environ 32(10):1412–1427
Saito A, Iino T, Sonoike K, Miwa E, Higuchi K (2010) Remodeling of the major light–harvesting antenna protein of PSII protects the young leaves of barley (Hordeum vulgareL.) from photoinhibition under prolonged iron deficiency. Plant Cell Physiol 51(12):2013–2030
Suzuki M, Bashir K, Inoue H, Takahashi M, Nakanishi H, Nishizawa N (2012) Accumulation of starch in Zn-deficient rice. Rice 5(1):9. doi:10.1186/1939-8433-5-9 Suzuki M, Takahashi M, Tsukamoto T, Watanabe S, Matsuhashi S, Yazaki J,
Kishimoto N, Kikuchi S, Nakanishi H, Mori S, Nishizawa NK (2006) Biosynthesis and secretion of mugineic acid family phytosiderophores in zinc–deficient barley. Plant J 48(1):85–97
Suzuki M, Tsukamoto T, Inoue H, Watanabe S, Matsuhashi S, Takahashi M, Nakanishi H, Mori S, Nishizawa NK (2008) Deoxymugineic acid increases Zn translocation in Zn-deficient rice plants. Plant Mol Biol 66(6):609–617 Takahashi M, Yamaguchi H, Nakanishi H, Shioiri T, Nishizawa NK, Mori S (1999)
Cloning two genes for nicotianamine aminotransferase, a critical enzyme in iron acquisition (Strategy II) in graminaceous plants. Plant Physiol 121(3):947–956 Takahashi R, Bashir K, Ishimaru Y, Nishizawa NK, Nakanishi H (2012) The role of heavy-metal ATPases, HMAs, in zinc and cadmium transport in rice. Plant Signal & Behav 7(12):1605–1607
Takahashi R, Ishimaru Y, Senoura T, Shimo H, Ishikawa S, Arao T, Nakanishi H, Nishizawa NK (2011) The OsNRAMP1 iron transporter is involved in Cd accumulation in rice. J Exp Bot 62(14):4843–4850
Thimm O, Bläsing O, Gibon Y, Nagel A, Meyer S, Krüger P, Selbig J, Müller LA, Rhee SY, Stitt M (2004) mapman: a user–driven tool to display genomics data sets onto diagrams of metabolic pathways and other biological processes. Plant J 37(6):914–939
Vigani G, Morandini P, Murgia I (2013) Searching iron sensors in plants by exploring the link among 2’–OG–dependent dioxygenases, the iron deficiency response and metabolic adjustments occurring under iron deficiency. Front Plant Sci 4: doi:10.3389/fpls.2013.00169
Wang F, Bai MY, Deng Z, Oses-Prieto JA, Burlingame AL, Lu T, Chong K, Wang Z–Y (2010) Proteomic study identifies proteins involved in brassinosteroid regulation of rice growth. J Integr Plant Biol 52(12):1075–1085
Yokosho K, Yamaji N, Ueno D, Mitani N, Ma JF (2009) OsFRDL1 Is a citrate transporter required for efficient translocation of iron in rice. Plant Physiol 149(1):297–305 Zhang H, Zhang J, Quan R, Pan X, Wan L, Huang R (2013) EAR motif mutation of
rice OsERF3 alters the regulation of ethylene biosynthesis and drought tolerance. Planta 237(6):1443–1451
Zhang Q, Yao G, Hu G, Chen C, Tang B, Zhang H–l, Li Z–c (2012a) Fine mapping of qTGW3–1, a QTL for 1000–grain weight on chromosome 3 in rice. Journal of Integrative Agriculture 11(6):879–887
Zhang Y, Xu YH, Yi HY, Gong JM (2012b) Vacuolar membrane transporters OsVIT1 and OsVIT2 modulate iron translocation between flag leaves and seeds in rice. Plant J 72:400–410
doi:10.1186/s12284-014-0018-1