Effects of Carbonation on the Microstructure of Cement Materials:
Influence of Measuring Methods and of Types of Cement
Son Tung Pham*, and William Prince
(Received January 30, 2014, Accepted May 7, 2014)
Abstract: The objective of this work was to examine the influence of carbonation on the microstructure of cement materials. Different materials, which were CEM I mortar and paste, CEM II mortar and paste, were carbonated at 20°C, 65 % relative humidity and 20 % of CO2concentration. The specific surface area and pore size distribution were determined from two methods: nitrogen adsorption and water adsorption. The results showed that: (1) nitrogen adsorption and water adsorption do not cover the same porous domains and thus, we observed conflicts in the results obtained by these two techniques; (2) the CEM II based materials seemed to be more sensible to a creation of mesoporosity after carbonation than the CEM I based materials. The results of this study also helped to explain why observations in the literature diverge greatly on the influence of carbonation on specific surface area.
Keywords:nitrogen adsorption, water adsorption, carbonation, specific surface BET, pore size distribution.
1. Introduction
The carbonation is a natural aging process for all cement materials. It corresponds to the progressive transformation of principal constituents of cementitious matrix, the portlandite Ca(OH)2and the calcium silicate hydrate C–S–H into calcite CaCO3, in contact with the carbon dioxide in the air and in the presence of water in the pores. This transformation is accompanied by a decrease in pH. The principle reactions are:
The carbonation of portlandite: CO2þ Ca(OH)2
¼ CaCO3þ H2O ð1Þ
The carbonation of C-S-H: CxSyHzþ xH2CO3
¼ xCaCO3þ ySiO2tH2O þ (xtþz)H2O ð2Þ
The carbonation process eventually leads to the conversion of all or part of the portlandite and C–S–H present in the cement paste into calcium carbonate and a liberation of porous silica for C–S–H. This transformation inevitably leads to a modification in the microstructure, which is highlighted by various parameters such as variations in specific surface area and pore size distribution.
The results in literature are highly divergent for the change in specific surface area during carbonation. Some authors
have observed a decrease in the specific surface area after carbonation; e.g., Thierry (2005) conducted mercury po-rosimetry studies on CEM I cement pastes, Johannesson and Utgenannt (2001) studied the adsorption of water on CEM I mortar, Thomas et al. (1996) and Rarick et al. (1996) studied nitrogen adsorption on CEM I cement pastes.
In contrast, other authors have reported an increase in the specific surface area after carbonation; e.g., Da Silva et al. (2002) and Chindaprasirt (2009) conducted mercury poros-imetry studies on concrete, Arandigoyen et al. (2006) investigated nitrogen adsorption on cement pastes that con-sisted of a mixture of cement and lime and Kim et al. (1995) examined the carbonation of portlandite and C–S–H.
Regarding the changes in the pores size distribution caused by carbonation, most authors used the mercury po-rosimetry but did not obtain the same results. Some authors observed a decrease in the volume of micropores and an increase in the volume of meso and macro pores (Thierry
2005; Miragliotta et al. 2000; Darkhmouche et al. 2009; Hyvert et al.2009; Saillio2012). Other authors observed a decrease in the volume of micropores without creation of macroporosity (Thierry2005; Saillio 2012; Jaafar2003).
In brief, the results vary depending not only on the nature of the materials (paste or mortar, type of cement) but also on the techniques implemented (mercury porosimetry, nitrogen adsorption, or water adsorption).
Although the mercury porosimetry is well adapted to the characterisation of macroporosity, the high pressure which is needed to intrude the mercury into the pores might lead to the micro damage during the test and influence the results (Zhang et al. 2013). Moreover, the variability of mercury porosimetry is very high for pores with radii below 10 nm, which is the porous domain of the C–S–H. Furthermore, Laboratory of Civil Engineering and Mechanical
Engineering, National Institute of Applied Sciences, 35000 Rennes, France.
*Corresponding Author; E-mail: [email protected] CopyrightÓThe Author(s) 2014. This article is published with open access at Springerlink.com
International Journal of Concrete Structures and Materials Vol.8, No.4, pp.327–333, December 2014
because a water molecule (radius 0.1 nm) is smaller than a nitrogen molecule (radius 0.215 nm) (Hiromitu and Masako
1991), which is smaller than a mercury molecule (Thierry
2005), the technique of water vapour adsorption yields better characterisation of micropores. These reasons explain why using different methods will lead obviously to different observations. Thus, in this study, we propose using at the same time different techniques to assess the modifications in the microstructure due to carbonation. To our knowledge, such study has never been carried out: no researcher has used simultaneously both the water vapor adsorption and the nitrogen adsorption techniques to study the microstructural changes caused by carbonation (pores size distribution and specific surface area).
The work will concentrate on two main points:
(1) The influence of the type of materials on the evolution of microstructural properties during carbonation will be studied using a same technique, which is Nitrogen adsorption, on different materials, which are CEM I mortar and CEM I paste, as well as CEM II mortar and CEM II paste.
(2) The influence of the techniques implemented will be studied using two different techniques, which are Nitrogen adsorption and Water adsorption, ona same
material, which is CEM II mortar.
The change in the BET specific surface area (Brunauer et al.1938) and pore size distribution are reported.
2. Materials and Methods
2.1 Mortars and Pastes
The cements used in this study were:
– CEM I 52.5 N PM-ES-CP2. – CEM II/B-M (LL-V) 32.5 R.
These cements were fabricated by Lafarge company in accordance with European norm EN 197-1 ‘‘Cement—Part 1: Composition, specifications and conformity criteria for common cements’’.
The CEM I and CEM II mortars were prepared by mixing respectively the cements CEM I and CEM II with French normalised sand certified in accordance with norm EN 196-1 and ISO 679:2009. The water/cement and sand/cement ratios were 0.5 and 3, respectively.
The CEM I and CEM II pastes were prepared by mixing respectively the cements CEM I and CEM II with water. The water/cement ratio was 0.5.
At the end of the mixing, the mortar was placed in cylindrical moulds (Ø=40 mm, h=30 mm) and stored in a humid chamber in order to avoid precocious desiccation in the vicinity of the surface exposed to drying. The samples were demoulded after 24 h and then cured in water for 90 days in a humid chamber (20°C, 100 % relative humidity). The cure in water prevents the natural carbon-ation during storage.
2.2 Pre-Treatment
A method of pre-treatment basing on the work of Thierry (2005) and Parrott (1944) is employed. The specimens are dried for 5 days at 45°C and then placed in sealed plastic bags for another 5 days. Finally, the specimens are placed for 3 days in a climatic chamber at 65 % relative humidity. The advantages of this method are to homogenise the internal humidity in the samples and to prevent the natural carbonation during the pre-treatment process.
2.3 Carbonation Test
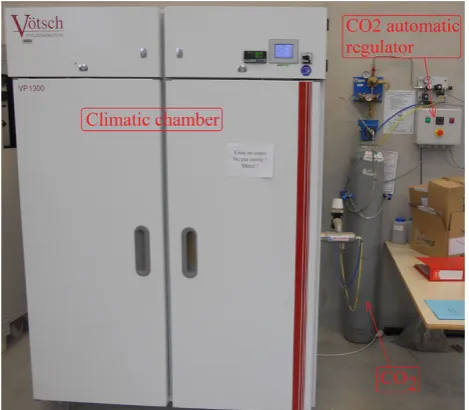
To implement the test, the specimens were subjected to CO2 in an environmentally controlled chamber at 20°C, 65 % relative humidity and 20 % CO2 concentration for 32 days to ensure a complete carbonation. The carbonation device consists of a climatic chamber Vo¨tsch VP1300 con-nected to a CO2tank (Fig.1). The concentration of CO2in the chamber is controlled by an automatic CO2regulator.
Samples collected in carbonated and non-carbonated specimens were then grinded into powders to 75lm using a mortar—pestle and a sieve, and subsequently used for nitrogen adsorption and water adsorption.
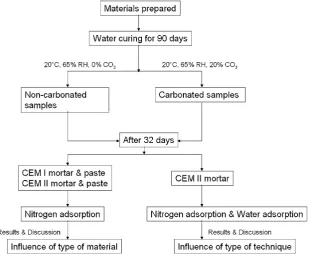
The experimental procedure is summarized in Fig.2.
2.4 Nitrogen Adsorption and Water Adsorption It is well known that cement paste has a multiscale structure that spreads from the nano- and microstructure to the mesoscopic scale and then to the macroscopic scale, which is visible to the naked eye. The nano- and microscopic scales consist of sheets of C–S–H. These sheets associated with packets are called grains and constitute a second level of the observation, which is the mesoscopic scale. To study this scale, we record the nitrogen adsorption–desorption isotherms. The test is performed on grinding powders orig-inating from the test samples. Nitrogen molecules are indeed adsorbed to the surface of grains corresponding to the packets of the sheets of C–S–H and to the packets of
portlandite; however, they do not penetrate the space between the layers. The specific surface area analyser mi-cromeritics gemini VII was used for this test. The powders were vacuum-dried at 105°C for 24 h before the test.
The water vapour adsorption on grinding powders origi-nating from the test samples is also examined to study the microscopic scale. For this test, we used a humidification regulator connected to the microbalance of the thermal ana-lysis Mettler Toledo machine. The regulator controlled auto-matically the temperature at 20°C and changed the relative humidity every one hour. The highest relative humidity which can be generated in this device is 95 %. Change in mass of the sample was automatically followed by the microbalance. This method is also known as the dynamic adsorption.
This study call the pores with radius\2 nm micropores, the pores with radius between 2 and 25 nm mesopores, and the pores with radius[25 nm macropores, basing on the classification of IUPAC—International Union of Pure Applied Chemistry. In reality, the classification of porous domains varies depending on the authors. A strict classifi-cation is hardly respected because there are various synthe-ses found in the literature on this topic, it seems difficult to clearly distinguish these different porosities.
3. Results and Discussion
3.1 Influence of the Type of Material 3.1.1 Pore Size Distribution
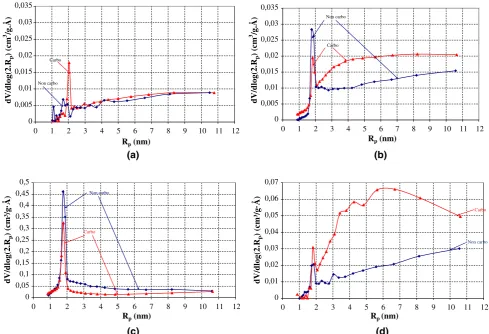
The pore size distributions obtained by nitrogen adsorp-tion are presented in Fig.3.
It is observed that:
(a) The carbonation caused a decrease in the volume of micropores (radius <2 nm). This decrease in the
volume of micropores is easily explained by the clogging due to calcite crystals formed from the carbonation of C–S–H.
(b) The evolution of the volume of the mesopores (radius >2 nm) varies depending on the nature of the cement. The CEM II mortar and CEM II paste show a clear
increasein the volume of these pores. In the contrary,
this increase is very slight in the case of the CEM I mortar, while the CEM I paste shows a cleardecrease in the volume of these pores.
If the decrease in the volume of pores with radius[2 nm can also be easily explained by the clogging due to calcite crystals formed from the carbonation of Ca(OH)2, the increase in the volume of these pores has been interpreted differently by various authors. According to Eitel (1966), the increase in meso and macroporosity volume is caused by the porous structure of the silica gels that are formed during the car-bonation. Swenson and Sereda (Brunauer et al.1938) reported that the increase in the volume of these larger pores is caused by cracks in the CaCO3gangue that surrounds the portlandite crystals. According to these authors, the water released by the carbonation of the portlandite does not easily diffuse through the calcite layers, which creates a hydric gradient that is the origin of the microcracks and the increase in mesoporosity. Other authors have attributed the increase in meso and mac-ropores to carbonation shrinkage. Bier et al. (1987) observed the creation of meso and macroporosity after carbonation of a mortar, which was not rich in portlandite and contained fly ash (which is the case of CEM II in our study).
To summarize, our results show that the formation of mesoporosity is more significant for compounds cement (fly ash or slag) such as CEM II than for cements CEM I.
This observation was already approached by Thierry (2005) and Drouet (2010). According to these authors, this
behavior probably has its origin in the nature of hydrates formed from mineral additions which is different from that of C–S–H and portlandite appearing during the hydration of cement CEM I.
Another explication can be based on relation with the ratio CaO:SiO2 (C/S) of C–S–H of the cement CEM II. It is reported in the literature that blended cements give the C–S– H with a low ratio C/S (Borges et al. 2010). Effectively, Sagawa and Nawa (2007) showed that the C/S ratio of C–S– H in a blast furnace slag cement is about under 1.6 and remarkably decrease below 1.0 from carbonation, while this value in an ordinary Portland cement is about 1.8 at the age of 91 days in water curing. According to Baltakys et al. (2007), the pozzolans react with calcium hydroxide to form C–S–H with a low CaO/SiO2 ratio. Formation of C–S–H depletes portlandite and the low C/S ratio enables the entrapment of alkalis, both of which reducing the amount of hydroxyl ions available to participate in the alkali–silica reaction. In their work done on poor portlandite materials (Suzuki et al. 1985) indicate that the lower the molar ratio C/S is, the greater the volume of meso and macro pores is created after carbonation. Chen et al. (2006) come to the same conclusion. According to these authors, rapid carbon-ation of C–S–H is expected in highly permeable pastes, accompanied by carbonation shrinkage, which is accelerated when the molar ratio C/S is less than 1.2. As blended
cements (CEM II) have a low C/S ratio, it is deduced that the carbonation shrinkage (creation of meso and macro pores) is more pronounced for materials based on these cements.
3.1.2 Specific Surface Area
The values of the specific surface area are presented in Table1. It is observed that the evolution of the BETN2after carbonation depends on the type of material. While the CEM II paste shows a clear increase in BETN2, the CEM I paste shows in the contrary a clear decrease in the BETN2. Change in BETN2 of CEM I mortar is not really significant, while CEM II mortar shows a slight increase of the BETN2.
The decrease in BETN2of CEM I paste is mainly due to the decrease of the volume of mesopores with radius[2 nm. There is less space for nitrogen molecules to be adsorbed, therefore the BETN2decreases.
The increase in BETN2of others materials (CEM I mortar, CEM II mortar, and especially CEM II paste) is due to two reasons: (1) The volume of pores with radius [2 nm increases, so there is more space for nitrogen molecules to be adsorbed, therefore the BETN2 decreases; (2) The carbon-ation of portlandite is manifested by the crystalliscarbon-ation of numerous calcite crystals on the portlandite platelets (Christophe et al.2006). It is therefore understandable that the carbonation results in an increase in the specific surface area BETN2and a modification of the pore network. 0
0,005 0,01 0,015 0,02 0,025 0,03 0,035
0 1 2 3 4 5 6 7 8 9 10 11 12 Rp (nm)
dV/dlog(2.R
p
) (cm
3 /g.Å)
Non carbo Carbo
0 0,005 0,01 0,015 0,02 0,025 0,03 0,035
0 1 2 3 4 5 6 7 8 9 10 11 12 Rp (nm)
dV/dlog(2.R
p
) (cm
3 /g.Å)
Non carbo
Carbo
(a) (b)
0 0,05 0,1 0,15 0,2 0,25 0,3 0,35 0,4 0,45 0,5
0 1 2 3 4 5 6 7 8 9 10 11 12 Rp (nm)
dV/dlog(2.R
p
) (cm³/g·
Å
) Non carbo
Carbo
0 0,01 0,02 0,03 0,04 0,05 0,06 0,07
0 1 2 3 4 5 6 7 8 9 10 11 12 Rp (nm)
dV/dlog(2.R
p
) (cm³/g·
Å
)
Carbo
Non carbo
(c) (d)
Fig. 3 Pore size distribution determined by nitrogen adsorption of CEM I mortar (a), CEM II mortar (b), CEM I paste (c) and CEM II
3.2 Influence of the Techniques Implemented In this section, the results obtained by two different techniques (nitrogen adsorption and water adsorption) on the same material (CEM II mortar) are compared.
3.2.1 Pore Size Distribution
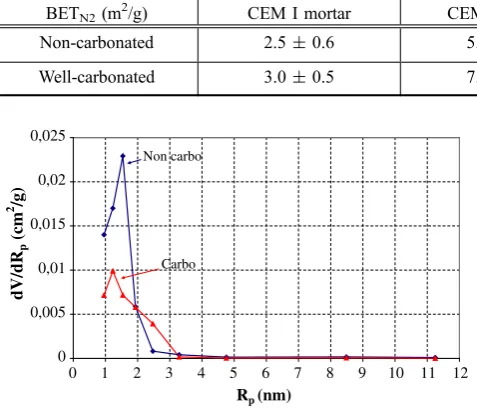
The pore size distribution of the CEM II mortar obtained by nitrogen adsorption was already presented in the Fig.3b, so we present here only the pore size distribution obtained by water adsorption in Fig.4.
The clogging of the pores due to calcite crystals formed from the carbonation of C–S–H and Ca(OH)2 results in a reduction of microporosity, which is clearly visible in the pore size distribution curve (Fig.4). Indeed, we observe that in the domain of 0–2 nm, the peak of carbonated sample is much smaller than that of the non-carbonated sample. This observation confirms the result obtained by nitrogen adsorption which also showed a decrease in the microporosity.
Regarding the pores of radius[2 nm, the water adsorption does not give clear information about how this porous domain changes due to carbonation. According to Thierry (2005), the appearance of these larger pores is not detectable by the water adsorption technique, because changes to these pores correspond already to a relative humidity close to 100 %. This inconvenience of the water adsorption is solved by using the nitrogen adsorption, which clearly showed that the evolution of the volume of the pores with radius[2 nm depended on the nature of the materials.
3.2.2 Specific Surface Area
The values of the specific surface area of CEM II mortar before and after carbonation are presented in Table2. These values were obtained by two different techniques: nitrogen adsorption and water adsorption.
When comparing the specific surface areas of the carbon-ated sample and non-carboncarbon-ated sample, we observe different evolutions depending on whether the test was performed by water vapour adsorption or nitrogen adsorption.
In the water adsorption test, the carbonation causes a clear reduction in the specific surface area, which reflects a partial closure of pores and cracks due to calcite crystals formed from carbonation, therefore a reduction in the accessibility of the intra-layer spaces of the C–S–H (microscopic domain).
In the nitrogen adsorption test, an opposite observation occurs: the carbonation causes an increase in the specific area. This is because new mesoporous (radius[2 nm) sur-faces are created by the crystallisation of calcite minerals or by an increase in mesopores due to carbonation shrinkage (at the expense of micropores (radius\2 nm).
The results also show that the specific surface area determined by water adsorption is higher than that obtained by nitrogen adsorption. Effectively, because of larger radius than water molecules, nitrogen molecules are adsorbed mainly into meso-porous spaces but do not easily enter the intra-layer spaces. This difference between nitrogen adsorption and water adsorption was already addressed by De Belie et al. (2010) who also found that the BET specific surface area measured by nitrogen adsorption is lower than that measured by water adsorption. According to the authors, it is possible that the nitrogen mole-cules can not enter the spaces between C–S–H inter-layers and therefore do not cover all of the anfractuosities in this porous domain. However, to our knowledge, there has never been a study in which these two methods (nitrogen and water adsorp-tions) were used simultaneously to examine microstructural changes caused by carbonation of cement materials.
The mysterious microstructure of the hardened cement paste, especially the C–S–H gel, also contributes to the difficulty of interpreting the divergent observations on the influence of carbonation on the specific surface. According to Tennis and Jennings (2000), in hydrated cement matrix there are two distinct types of C–S–H with different densi-ties, in one type the nitrogen molecules can enter and in another type they can not.
Table 1 Specific surface area obtained by nitrogen adsorption.
BETN2(m2/g) CEM I mortar CEM II mortar CEM I paste CEM II paste
Non-carbonated 2.5±0.6 5.1±0.8 50.47±0.26 7.62±0.16
Well-carbonated 3.0±0.5 7.7±0.7 41.98±0.32 17.06±0.22
0 0,005 0,01 0,015 0,02 0,025
0 1 2 3 4 5 6 7 8 9 10 11 12 Rp (nm)
dV/dR
p
(cm
2 /g)
Non carbo
Carbo
Fig. 4 Pore size distribution of CEM II mortar determined
from the water adsorption desorption.
Table 2 Specific surface area obtained by nitrogen adsorption and water adsorption.
CEM II mortar BETH2O(m
2
/g) BETN2(m
2
/g)
Non-carbonated 25.9±1.5 5.1±0.8
4. Conclusions
The results of this study indicate that the influence of car-bonation on specific surface area and pore size distribution depends not only on the material in question but also on the technique utilized for the characterization. It is therefore not sufficient to simply say that the surface area increases or decreases after carbonation, since this subject causes many controversies in the observations obtained by different authors. Effectively, using nitrogen adsorption on different materials, while a decrease in the micropores (radius \2 nm) was observed, the results in this study indicate that the creation of mesoporosity (radius[2 nm) is more significant in CEM II materials than CEM I materials. This creation of mesoporosity influences the evolution of the surface area. The more the creation of mesoporosity is significant, the more the surface area increases after carbonation. This is the case of CEM I mortar, CEM II mortar, and especially CEM II paste. In the case of CEM I paste, the surface area BETN2decreases after carbonation because there is no creation of mesoporosity.
The results also indicate that the water adsorption do not necessarily cover the same realities as the nitrogen adsorp-tion. Thus, measured on CEM II mortar, the specific surface area that is determined by nitrogen adsorption is smaller than that obtained by water adsorption and this specific surface increases when carbonation occurs. In contrast, the specific surface area that is obtained by water adsorption is higher than that determined by nitrogen adsorption, and this specific surface decreases when carbonation occurs.
It appears that the porous domains explored using these two techniques are different and help to complementarily evaluate the effects of carbonation. According to several authors, the small size of water molecules allows them to penetrate into the microporosity (radius\2 nm) of the C–S–H sheets, while nitrogen molecules, which are relatively larger, can access mainly the mesoporous domain (radius[2 nm) and cover more completely all the anfractuosities in this domain.
Open Access
This article is distributed under the terms of the Creative Commons Attribution License which permits any use, distribution, and reproduction in any medium, provided the original author(s) and the source are credited.
References
Arandigoyen, M., Bicer-Simsir, B., Alvarez, J. I., & Lange, D. A. (2006). Variation of microstructure with carbonation in lime and blended pastes. Applied Surface Science, 252, 7562–7571.
Baltakys, K., Jauberthie, R., Siauciunas, R., & Kaminskas, R. (2007). Influence of modification of SiO2on the formation of calcium silicate hydrate. Materials Science-Poland, 25(3), 663–670.
Bier, T. A., Kropp, J., Hilsdorf, H. K. (1987). Carbonation and realkalinization of concrete and hydrated cement paste. In: J. C. MASO (Ed.), Durability of construction materials (pp. 927–934, volume 3). London, UK: RILEM, Chapman & Hall Publishers.
Borges, P. H. R., Costa, J. O., Milestone, N. B., Lynsdale, C. J., & Streatfield, R. E. (2010). Carbonation of CH and C–S–H in composite cement pastes containing high amounts of
BFS.Cement and Concrete Research, 40, 284–292.
Brunauer, S., Emmett, P. H., & Teller, E. (1938). Adsorption of gases in multimolecular layers. Journal of American Chemical Society, 60, 309–319.
Chen, J. J., Thomas, J. J., & Jennings, H. M. (2006). Decalci-fication shrinkage of cement paste.Cement and Concrete Research, 36, 801–809.
Chindaprasirt, P., & Rukzon, S. (2009). Pore structure changes of blended cement pastes containing fly ash, rice husk ash, and palm oil fuel ash caused by carbonation. Journal of Materials in Civil Engineering, 21(11), 666–671.
Christophe, C., (2006). La carbonatation. Le Magazine Be´ton[s], Volume 2, Pages 53–54.
Da Silva, C. A. R., Reis, R. J. P., Lameiras, F. S., & Va-sconcelos, W. L. (2002). Carbonation-related microstruc-tural changes in long-term durability concrete. Materials Research, 5(3), 287–293.
Darkhmouche, F. Z. (2009). Carbonatation des be´ton adjuvants a` base de ressources locales alge´riennes. The`se de Doctorat, Universite´ d’Orle´ans, Orle´ans, France.
De Belie, N., Kratky, J., & Van Vlierberghe, S. (2010). Influ-ence of pozzolans and slag on the microstructure of par-tially carbonated cement paste by means of water vapour and nitrogen sorption experiments and BET calculations.
Cement and Concrete Research, 40, 1723–1733.
Drouet, E. (2010). Impact de la tempe´rature sur la carbonatation des mate´riaux cimentaires—Prise en compte des transferts hydriques. The`se de Doctorat, Ecole Normale Supe´rieure de Cachan, Cachan, France.
Eitel, W. (1966). Silicate science: Ceramics and hydraulic binders. New York, NY: Academic press.
Hiromitu, N., & Masako, H. (1991). Analysis of adsorption isotherms of water vapour for nonporous and porous adsorbents. Journal of Colloid and Interface Science, 145(2), 405–412.
Hyvert, N. (2009). Application de l’approche probabiliste a` la durabilite´ des produits pre´fabrique´s en be´ton. The´se de Doctorat, Universite´ Paul Sabatier—Toulouse III, Tou-louse, France.
Jaafar, W. (2003).Influence de la carbonatation sur la porosite et la perme´abilite´ des be´tons, Diploˆ me d’e´tudes approfon-dies (Master of advanced stuapprofon-dies). Paris, France: Labora-toire Central des Ponts et Chausse´es.
Johannesson, B., & Utgenannt, P. (2001). Microstructutals changes caused by carbonation of cement mortar.Cement and Concrete Research, 31, 925–931.
Miragliotta, R. (2000). Mode´lisation des processus physico-chimiques de la carbonatation des be´tons pre´fabrique´s— Prise en compte des effets de paroi. The`se de Doctorat de l’Universite´ de la Rochelle, La Rochelle, France.
Parrott, L. (1944). Moisture conditioning and transport proper-ties of concrete test specimens.Materials and Structure, 27, 460–468.
Rarick, R. L., Thomas, J. J., Christensen, B. J., & Jennings, H. M. (1996). Deterioration of the nitrogen BET surface area of dried cement paste with storage time.Advanced Cement Based Materials, 3, 72–75.
Saillio, M. (2012). Interactions physiques et chimiques ions-matrice dans les be´ton sains et carbonate´s—Influence sur le transport ionique. The`se de Doctorat, L’Universite´ Paris-Est Marne La Valle´e, La Valle´e, France.
Sagawa, T., Nawa, T. (2007). Effect of curing condition and carbonation on hydration of blast furnace slag. Cement Concrete Research and Technology, 18(3), 23–35. (Issue 45).
Suzuki, K., Nishikawa, T., & Ito, S. (1985). Formation and carbonation of C–S–H in water. Cement and Concrete Research, 15, 213–224.
Tennis, P. D., & Jennings, H. M. (2000). A model for two types of calcium silicate hydrate in the microstructure of Portland cement pastes. Cement and Concrete Research, 30, 855–864.
Thierry, M. (2005). Modelling of atmospheric carbonation of cement based materials considering the kinetic effects and modifications of the microstructure. PhD Thesis, L’e´cole nationale des ponts et chausses, Paris, France.
Thomas, J. J., Hsieh, J., & Jennings, H. M. (1996). Effect of carbonation on the nitrogen BET surface area of hardened portland cement paste.Advanced Cement Based Materials, 3, 76–80.