R E S E A R C H
Open Access
Understorey phylogenetic diversity in
thermophilous deciduous forests:
overstorey species identity can matter
more than species richness
Andrea Coppi
1, Lorenzo Lazzaro
1, Evy Ampoorter
2, Lander Baeten
2, Kris Verheyen
2and Federico Selvi
3*Abstract
Background:Understorey vegetation is a key biodiversity component of forest ecosystems. Previous studies examined its relations with the overstorey mainly in terms of taxonomic diversity, composition or productivity. So far, none focused on the phylogenetic aspect, which represents the deepest component of diversity in a community. Here, we explored the relations between overstorey species richness and identity and the phylogenetic structure of the understorey vegetation. As a model system we used a network of 36 plots in thermophilous deciduous forests of central Italy that are part of a European project on forest biodiversity and functions. The plots, characterized by similar site conditions, represent a gradient of overstorey richness from 1 to 4-species mixtures, with variable composition. After surveying the understorey in each plot, measures of phylogenetic diversity and structure (Phylogenetic Diversity, PD; Net Relatedness Index, NRI; and Nearest Taxon Index, NTI) were calculated from a fully resolved seed-plant phylogeny obtained from a ITS-5.8S nrDNA dataset including original sequences from local plant material.
Results:The resulting understorey phylogenetic tree allowed reliable estimation of PD, NRTI and NTI. Phylogenetic diversity was dependent on species richness and the strength of this relationship did not change along the gradient of overstorey tree species richness. Net Relatedness and Nearest Taxon indices were both mostly positive but non-significant, indicating random phylogenetic structure of the understorey. The presence ofQuercus petraea, usually found in more favorable site conditions, was associated with a significant phylogenetic clustering at the species level. Conclusions:Overstorey species richness was not related to understorey phylogenetic structure, while species identity (Q. petraea) was associated with an increase in evolutionary relatedness in this forest layer, possibly due to competitive exclusion in favorable site conditions. Further studies should examine whether and how understory phylogenetic structure is affected by variables such as small scale variations in site conditions and presence of a shrub layer, both present but not accounted for in our model system. A better understanding of the role of these variables and their interaction may contribute to fill the current gap between the theoretical field of phylogenetic ecology and forest management.
Keywords:Community phylogenetics, Forest biodiversity, Herb layer, Overstorey effects, Phylogenetic clustering, Species identity
© The Author(s). 2019Open AccessThis article is distributed under the terms of the Creative Commons Attribution 4.0 International License (http://creativecommons.org/licenses/by/4.0/), which permits unrestricted use, distribution, and reproduction in any medium, provided you give appropriate credit to the original author(s) and the source, provide a link to the Creative Commons license, and indicate if changes were made.
* Correspondence:federico.selvi@unifi.it
3Department of Agriculture, Food, Environment and Forestry, Laboratories of
Botany, University of Florence, Florence, Italy
Background
Understorey plants play a key role for the diversity of temperate forests, representing up to 80% of the total species richness of the community (Gilliam2007). Despite their negligible contribution to the total forest biomass (Welch et al.2007), they support a number of ecosystem functions and services, such as nutrient and carbon cycles and provision of food and habitat resources (Gilliam2014; Muller 2014). Hence, maintaining the integrity of the understorey is increasingly acknowledged as a major goal in sustainable forest management and biodiversity conser-vation programs in Europe (Ministerial Conference on the Protection of Forests in Europe 2011). Several studies have investigated the mechanisms and factors that determine the diversity and composition of the under-storey community, mostly in the forests of the central and northern countries (e.g. Mölder et al.2008; Barbier et al. 2009; Vockenhuber et al. 2011; Verstraeten et al. 2013; Ampoorter et al. 2014,2015, 2016). Vertical struc-ture and species composition of the overstorey can have major effects on the herb layer, because canopy trees have a species-specific influence on the quality and availability of resources, especially water, nutrients and light, as well as on the physical properties of the litter and soil (Barbier et al. 2008). Most understorey plant species show a high sensitivity to these conditions and respond to variations in tree community structure and composition with changes in abundance, frequency, reproductive efficiency and/or phenological cycles (Verstraeten et al.2013). However, the effects of overstorey richness and composition are still un-clear and cannot be generalized (e.g. Barbier et al.2008). Some studies in temperate forests have described a gener-ally positive overstorey-understorey diversity relationship and provided support to the environmental heterogeneity hypothesis (Mölder et al.2008; Vockenhuber et al.2011). This means that the mixing of tree species and their additive identity effects results in a fine-scale mosaic of environmental conditions at the stand level, which promotes the coexistence of more understorey species
(Huston 1979; Silvertown 2004; Levine and Hille Ris
Lambers2009). On the other hand, recent studies across European forests found negative or neutral effects and
corroborated the “novel environment creation”
hy-pothesis, by which the mixing of tree species leads to new conditions as a result of averaging of tree species effects or interactive effects between these species (Ampoorter et al. 2015, 2016).
However, previous studies dealing with overstorey-understorey relationships focused on taxonomic or func-tional diversity in especially central European forests, whereas no investigations have considered the phylo-genetic dimension so far. According to Faith (1992), phylogenetic diversity (PD) can be defined as the total amount of evolutionary distance among plant species in
a community. Such a“deep” component of diversity has been suggested to be relevant for ecosystem services (Faith et al.2010), stability (Cadotte et al.2013) and func-tional processes such as species interactions and resource use (Srivastava et al. 2012). In addition, preserving and maximizing phylogenetic diversity within and across com-munities is considered one of the most important goals in conservation biology, since this may enhance stability under changing habitat conditions across ecologic and evolutionary time scales (Rodrigues and Gaston 2002). Hence, gaining new insights into the organization of forest communities from an evolutionary perspective and under-standing the drivers of understorey PD and structure may have relevant implications for their conservation in the long-term. While previous studies have examined how these components are affected by climate (Tallents et al. 2005; Zhang et al.2016), disturbance by fragmenta-tion (Arroyo Rodríguez et al. 2012) and biotic invasion (Lapiedra et al.2015; Selvi et al.2016), the role of potential biotic filters such as overstorey tree species richness and/ or identity is still unknown (Garnier et al.2015). This gap has disadvantageous implications for forest management, since silviculture acts directly on species richness and composition of the canopy with unpredictable con-sequences on understorey phylogenetic structure. In particular, it is unknown whether favoring monocultures of given overstorey trees or mixed stands may influence the level and patterns of evolutionary relatedness in the herbaceous layer. This study represents a first attempt to fill this gap by using thermophilous deciduous forests as model system. To date, little attention has been paid to overstorey-understorey relationships in this important Euro-Mediterranean forest type. Compared with broadleaf forests at more northern latitudes in Europe, this is characterized by relatively high diversity of woody species
in the dominant (mainly Quercus sp. pl.), subdominant
(Acer, Fraxinus, Ostrya, Sorbus, etc.) and shrub layers (Barbati et al.2007; Carrari et al.2016), which may involve different mechanisms and responses in the understorey.
compared to the effect of more closely related species that are expected to occur in the more homogenous environ-ment of pure stands or species-poor mixtures. In terms of phylogenetic structure, overstorey species richness and consequent broader range of niches available in the lower layers should translate into an increase of phylogenetic evenness in the understorey. In fact, distantly related species are likely to better exploit complementary niches and reduce reciprocal competition thanks to their more widely differentiated traits and environmental require-ments, compared to closely related species (Wiens et al. 2010; Garnier et al.2015). This is supported by the Niche
Conservatism assumption (Harvey and Pagel 1991;
Prinzing et al. 2001), which predicts retention of eco-logical traits over time among related species and increase of phylogenetic clustering following coexistence in the
same community (Webb et al. 2002). Under the novel
environment creation hypothesis, instead, the new con-ditions created by the mixing of more interacting tree species do not allow to predict variations in the phylogenetic structure of the community, which may remain unaltered or becoming either more clustered or over-dispersed.
However, both phylogenetic diversity and structure of the understorey can be affected by overstorey species identity, rather than richness (Selvi et al. 2016). In fact, each tree species acts as a more or less selective biotic filter depending on how it modifies the local conditions through its trait values (“species identity effect”; Kirwan et al. 2009). In principle, the stronger this filter, the higher the level of phylogenetic clustering can be expected under the Niche Conservatism assumption. On the other hand, there is evidence that phylogenetic dispersion can be limited also in favorable habitats without strong filters,
due to mechanisms of competitive exclusion that often limits also species richness (Mayfield and Levine2010).
This paper investigates the issues above using a tree diversity-oriented network of research plots in thermophi-lous deciduous forests of central Italy as model system. This was designed ad-hoc for the FunDivEUROPE exploratory platform to allow the separate analysis of diversity versus identity (and compositional) effects on various ecosystem functions, while controlling as much as possible for variation in environmental factors (Baeten et al.2013). After the field inventory of the understorey com-munity in these plots, we built a phylogenetic tree of seed plants in this layer using a DNA sequence dataset including accessions from public databases and original gene sequencing work performed on plant material col-lected in the sampling sites. As in a recent study (Selvi et
al. 2016) such an approach allowed to obtain a fully
resolved phylogeny and reliable indices of understorey phylogenetic diversity and structure. To sum up, the specific aims of this study were: (i) to test whether the relationship between understorey species richness and PD varies along a gradient of canopy species richness; (ii) to examine the link between overstorey species richness and understorey phylogenetic structure in relation to the en-vironmental heterogeneity or novel environment creation hypothesis; and (iii) to evaluate the role of major over-storey tree species in our model system in shaping the phylogenetic structure of the understorey.
Methods
Study site, sampling design and data collection
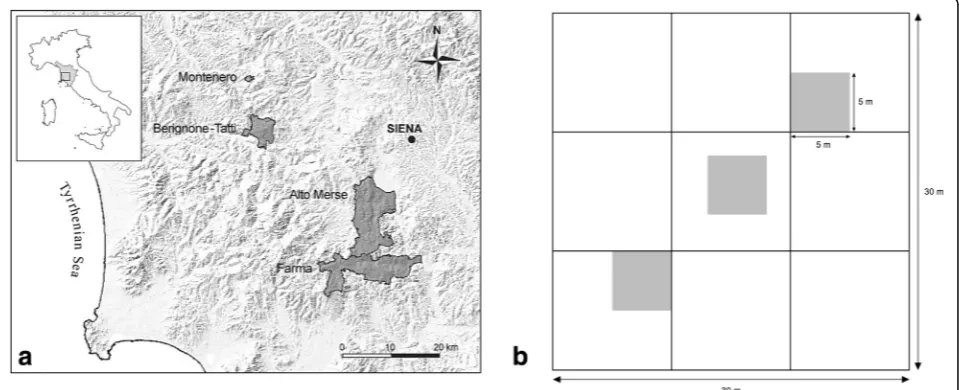
The study area is located in the Colline Metallifere area of Tuscany in central Italy (Lat. 43.2° N, Long. 11.2° E), at an altitude of 260–525 m a.s.l. (Fig.1). Vegetation data
were collected in a network of 36 permanent forest plots of 30 m × 30 m, subdivided each in 9 subplots of 10 m × 10 m for the purposes of other sampling campaigns in the FunDivEUROPE project. The plots are representative of the category of “thermophilous deciduous forests” as defined in the European Environment Agency classifi-cation (EEA), which covers large areas especially in Italy (40% of the ICP Level I plots) and the Balkans (Barbati et al. 2007). The plots were included in nearly mature stands that originated from the abandonment of the traditional coppice management, that occurred at least 50 years ago, and are mostly included in nature reserves and/or in the Rete Natura 2000 sites (Bussotti et al. 2012; Fig.1). All details about the guiding criteria of the experimental design of the FunDivEurope exploratory platform and the selection of plots can be found in
Baeten et al. (2013). To sum up, Italian plots were
selected to cover a tree species richness gradient from 1 to 5 dominant tree species with diverging traits, here named “focal trees”: Quercus cerris, Q. ilex, Q. petraea,
Castanea sativa andOstrya carpinifolia. The number of plots for each species richness level was 10 (pure stands), 9 (2-sp. and 3-sp. mixtures), 7 (4-sp. mixtures) and 1 (5-sp. mixtures). For the purpose of this work, the only 5-species mixture plot was pooled together with the 4-species plots. Each species richness level was replicated with different species combinations of these trees to be able to separate species diversity from composition effects; the 22 species combinations represented in our design and the frequency of each species in the four richness levels are given in Table1. Basal area proportions between the different tree species in the mixed plots were within predetermined thresholds (given in Baeten et al.2013) to ensure species a minimum evenness and avoid strong dominance of only one species. While plot selection was focused on dominant canopy trees, other sub-dominant woody species such asFraxinus ornusL.,Sorbus tormina-lis (L.) Crantz, Ilex aquifoliumL., Arbutus unedo L. and others were usually admixed with the above dominant trees for not more than 10% of the total basal area; this sig-nificantly increased species richness in the layers > 1.3 m. In addition, a shrub layer usually < 4 m, with ground cover
of 1%–30%, and formed by moderately shade-tolerant
species such asCornus masL.,Crataegus laevigata(Poir.) DC.,Phillyrea latifolia L.,Ligustrum vulgareL., Juniperus communisL. and others was present in most of the plots, as typical in thermophilous deciduous forests of southern Europe (Carrari et al. 2016). The tree regeneration layer over 1.3 m height was instead very sparse, and hence not likely to affect the understorey.
Environmental variables (soil, topography, altitude) were kept as constant as possible among the sites, to avoid significant covariation between the diversity gradient and environmental variables. To sum up, plots
were located at an altitude range of 250–520 m a.s.l., mostly on N-facing slopes with low to average inclination (5–20°); they were all included in a submediterranean
climatic area with 800–900 mm of mean annual
rain-fall, and 12.5–13.5 °C of mean annual temperature.
Bedrock was almost exclusively of siliceous nature, mainly quartzitic sandstones, and the dominant soil type was Cambisol. Using permutational analysis of variance, Carrari et al. (2016) showed no significant differ-ences between plots in terms of site and soil conditions and stand structure characteristics. However, small scale Table 1Overview of the number of plots (N) for each
combination of focal tree species (numbers in the matrix); the frequency of each species is given for each species richness level (SR) and for the entire set of plots (overall)
Q. cerris Q. ilex Q. petraea C. sativa O. carpinifolia
SR = 1 (N= 10) 2 2
2
2
2
Freq. 2 2 2 2 2
SR = 2 (N= 9) 1 1
1 1
1 1
1 1
1 1
1 1
1 1
1 1
1 1
Freq. 4 4 3 4 3
SR = 3 (N= 9) 1 1 1
1 1 1
2 2 2
1 1 1
1 1 1
1 1 1
1 1 1
1 1 1
Freq. 6 6 5 4 4
SR = 4–5 (N= 8) 2 2 2 2
2 2 2 2
2 2 2 2
1 1 1 1
1 1 1 1 1
Freq. 7 8 6 6 6
variations were unavoidable due to the complex geomorphology of our hilly region and the long-lasting anthropic activities in the forests. Understorey data collec-tion followed the protocol described in Ampoorter et al. (2016): in each plot, three 5 m × 5 m sampling quadrats were placed in three distinct subplots at a regular distance along a diagonal from the lower left corner to the upper right corner, respectively (Fig. 1); this design allowed to minimize the edge effect and to sufficiently account for the heterogeneity of micro-topographic conditions inside the plot. However, major heterogeneities such as large tree trunks, tracks and paths, streams and ponds, peaty pools, boulders and cliffs were excluded from the quadrats, so that only terricolous plants growing on mineral and organic soil of the undisturbed forest floor were present. In May 2012 all vascular understorey species (< 1.3 m) in the 108 quadrats were recorded and scored for percentage of ground cover. Mean values of the three quadrats were used to represent the respective plot in the following analyses.
Molecular analyses, sequence alignment and phylogeny construction
Phylogenetic diversity of the spermatophyte communi-ties in the plots (e.g, excluding four fern species) was in-ferred from a fully resolved super-tree that we built using three markers from the Internal Transcribed Spacers of the nrDNA, the ITS1, 5.8S and ITS2 regions. These are by far the most widely used for phylogenetic inference and barcoding in spermatophytes (Li et al.
2011), allowing us to assemble the sequence dataset
retrieving accessions of most species in our plots from the GenBank. Also, the (generally) greater discriminatory power of ITS-5.8S over other genomic regions at the species level (Hollingsworth et al. 2011), allowed to avoid polytomic groups and to resolve relationships even in those genera with two or more species in our dataset (e.g.,Quercus,Carex,Vicia, and others). Although recently developed synthesis trees work well in many cases (Li et al.2018), this option would have not provided a full reso-lution of species-level relationships in our case, and was therefore not adopted.
Sequence data for 103 out of 109 species in our vegetation sample were taken from GenBank (http://www.ncbi.nlm. nih.gov/), using the accession numbers in Additional file9.
Hence, isolation of genomic DNA was performed for six understorey species that were not available from the latter database: Cruciata glabra (L.) Opiz (Rubiaceae),
Dioscorea communis (L.) Caddick & Wilkin (Dioscorea-ceae),Hieracium racemosumWaldst. et Kit. (Asteraceae),
Melica uniflora Retz. (Poaceae), Rubus hirtus Waldst. et Kit. (Rosaceae), Ruscus aculeatus L. and Scilla bifolia
L. (Asparagaceae). Isolation followed a modified 2 × CTAB protocol (Doyle and Doyle 1990) while ITS amplification
was performed using the primers ITS4 and ITS5 (White et al. 1990). Polymerase chain reactions were performed in a total volume of 25μL containing 2.5μL of 10× reac-tion buffer (Dynazyme II, Finnzyme, Espoo, Finland), 1.5 mmol∙L−1 MgCl2, 10 pmol of each primer, 200μmol∙L−1 dNTPs, 1 U of TaqDNA polymerase (Dynazyme II) and 10 ng of template DNA. Reactions were performed in a MJ PTC-100 thermocycler (Peltier ThermalCycler, MJ Re-search, Massachusetts, USA) Subsequently, 5μL of each amplification mixture were analyzed by agarose gel elec-trophoresis in TAE buffer (1.5% w/v) containing 1μg∙mL− 1
ethidium bromide, by comparison with a known mass standard. After purification, the PCR reactions were quan-tified with a spectrophotometric method (Biophotometer, Eppendorf ). Unfortunately, amplification was not success-ful forRuscus,ScillaandDioscorea(see Li et al. 2011for problems with the latter genus). Automated DNA sequen-cing of the three other species was performed directly from the purified PCR products using BigDye Terminator v.2 chemistry and an ABI310 sequencer (PE-Applied Bio-systems, Connecticut, USA). Original sequences were checked for homology with Blast (http://blast.ncbi.nlm.nih. gov/Blast.cgi) and edited with BioEdit v.7.0 (Hall 1999). Original sequences were deposited in GenBank and can be retrieved using the accession number in Additional file9.
The final dataset consisted of 110 accessions (Add-itional file9) and included two species of Asparagaceae and one of Dioscoreaceae that were not present in our plots but added in order not to lose important phylogenetic infor-mation caused by the missing sequences of Ruscus, Scilla
and Dioscorea, respectively. The above higher-order taxa would have been otherwise not represented. Multiple align-ment of the ITS-5.8S dataset was performed with MAFFT v. 7.0 (Katoh and Standley2013) using the L-INS-i strategy and then carefully checked by visual inspection with BioE-dit. Gaps were coded as separate characters according to
Simmons and Ochoterena (2000) using FastGap v.1.0.8
(Borchsenius2009), and appended at the end of the dataset. Tree construction was finally performed using Neighbor-Joining (NJ) and bootstrap analysis with 1000 replicates, as implemented in PAUP vers. 4.0 (Swofford2000). NJ is a fast and effective method to infer reliable phylogenetic trees with branch lengths reflecting evolutionary divergence among species (Mihaescu et al.2009), as shown by the large congruence between our tree and those by APG IV (2016) in terms of topology of the major clades retrieved.
Indices of phylogenetic diversity and structure
PD is the simplest measure of the cumulative evolution-ary age in a community and is commonly used in
conservation and ecological research (Faith 1992;
Forest et al. 2007; Rodrigues and Gaston 2002). The
Net Relatedness Index (NRI) and the Nearest Taxon Index (NTI) were used to quantify the degree of community weighted phylogenetic relatedness among species within each forest plot. Both indices are measures of phylogenetic divergence (Tucker et al. 2016) successfully used for the assessment of sustainability and health of forest
eco-systems (Potter and Koch 2014) or for the impact of
forest plantations on understorey phylogenetic
struc-ture (Piwczyński et al. 2016). NRI measures the
standardized effect size of the mean phylogenetic distance (MPD), which estimates the average phylogenetic related-ness between all possible pairs of taxa in an assemblage; this index is dominated by the deep phylogenetic relation-ships between taxa since its calculation considers all
pairwise distances within the community (Webb 2000;
Stadler et al.2017). NTI is a standardized measure of the branch-tip phylogenetic clustering of the species on the plot (usually indicated as Mean Nearest Taxon Distance, MNTD) and is independent from the arrangement of the higher-level groups in the phylogenetic tree (Webb et al. 2002). Positive values of NRI and NTI indicate that MPD and MNTD, respectively, are lower than expected by chance (null model) and that phylogenetic clustering of species occurs. Conversely, negative values of NRI and NTI result when the observed Mean Phylogenetic Distance and Mean Nearest Taxon Distance are greater than expected by chance, hence indicating phylogenetic overdispersion or evenness. AsC should have values < -1.96 and > + -1.96 to be significantly divergent from a ran-dom phylogenetic structure. To compare the values of the two variables above to null community data, we used a simple null model of randomly drawing species (phyl-ogeny branch tips), holding plot species richness con-stant as suggested in the Phylocom software (Webb et al. 2008). All phylogenetic metrics were obtained with
the package Picante (Kembel et al. 2010) in R vers.
3.4.3 (R Core Team2017).
Statistical analyses
Our first aim was to examine the relationship between understorey species richness (USR) and PD along a gra-dient of overstorey species richness (OSR). To this purpose, we fitted a linear mixed model with normal distribution of the errors, using PD as response variable and OSR and USR as fixed effect terms, focusing on their interaction term and including a random effect term for the overstorey composition. To account for the presence and possible effects of non-dominant admixed tree species and of the variable proportions of the focal species in the OSR was determined at three levels, as: 1) the number of
focal tree species contributing to the total basal area for at least 10% (target species); 2) the total number of focal tree species, including those with basal area < 10% (focal species), and 3) all tree species with dbh≥7 cm reaching the subdominant or dominant layer (up to 10 species).
Next, we explored the effect of OSR on the phylo-genetic structure of the understorey, i.e. the NTI and NRI metrics (aim 2). To this purpose we fitted a series of linear mixed models, again with normal distribution of the errors, using OSR as fixed effect (using the same three richness levels described above) and including a random effect term for the overstorey composition. Since NRI and NTI represent standardized measures of MPD and MNTD not related to species richness, we excluded USR from the analyses, as we did not expect any relevance of this factor on the variation of such indexes. In both linear mixed models, the significance of the fixed effect terms and of their interaction term was estimated adopting an ANOVA table, with Satterthwaite approximation for denominator degree of freedom.
To evaluate the importance of the target species identity in the overstorey (aim 3) we set a series of linear models, with normal distribution of the errors, using the presence/ absence data of each of the five target species as expla-natory variables. We used the Information Theoretic
Approach (Burnham and Anderson 2002) to select the
best combination of effects from the global model inclu-ding all five target species. Models were compared using the corrected Akaike Information Criterion (AICc), with all possible combinations of predictors identified using the
“dredge” function in MuMIn (Barton 2016). Based on
ΔAICc (which represents the difference between each
model and the most parsimonious model), we selected all the models with a ΔAICc value < 4, considered to be equally parsimonious (Burnham and Anderson2002). The coefficients for each target species in the overstorey were averaged from the best-fitting models and significance of the estimated coefficient was calculated with a z Wald test. In addition, the relative importance was calculated for each species.
All statistical analyses and graphics were generated using R Studio version R 3.4.3 (R Core Team2017), with
the additional packages lme4 (Bates et al. 2015) and
MuMIn (Barton2016).
Results
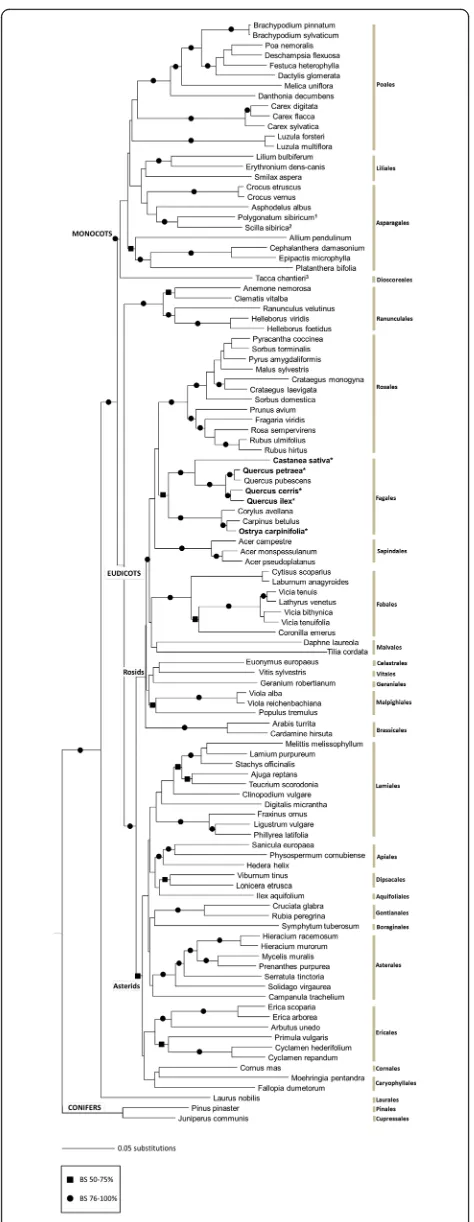
Phylogenetic relationships of the understorey
which included members of 4 and 24 orders of the APG system, respectively; within the eu-dicots, Ranunculales were sister to the major clades of Asterids and Rosids.
Effects of overstorey species richness
Model results showed that phylogenetic diversity was strongly dependent on species richness (P < 0.001; Table 2, Fig. 3). As indicated by a non-significant inter-action effect, the strength of this positive relationship did not change along the overstorey tree richness gradient, when considering the target trees only (Fig. 3), the focal trees and all the trees (Additional files1,7).
The three models produced consistent results, con-firming a strong correlation between PD and USR but no variation related to the number of species in the overstorey, regardless of whether this includes target, focal or all species in the canopy (Table2, Fig.3).
Concerning phylogenetic structure, values of both NRI and NTI were mostly positive but non-significant (Fig.4), indicating randomness with tendency to a clustered pat-tern. Results in Table2 showed no effects of overstorey species richness on these response variables (P > 0.05), regardless of whether the number of target species, focal species or all species in the canopy was considered as explanatory variable (Additional file2). Only a few plots with two or three target species and a variable number of other admixed (“all”) species showed negative NRI values (Fig.4).
Effects of overstorey species identity
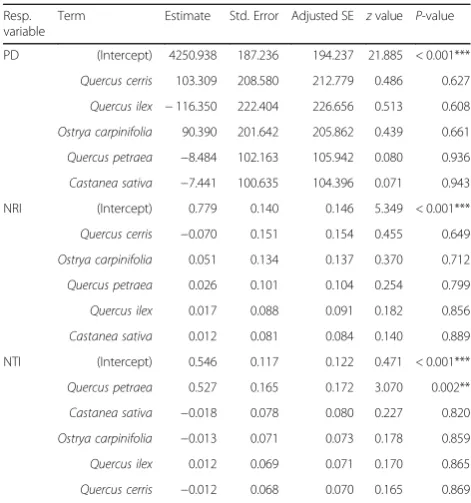
The results of the multiple modelling approach and selection to assess the identity effects on USR, PD, NRI and NTI are reported in Additional files 3, 4, 5 and6, respectively. Phylogenetic diversity was not significantly influenced by the identity of the species in the canopy. However, it was slightly higher in the plots withOstrya carpinifolia and, even more, in those with Q. cerris
(2.4% higher than intercept) as a consequence of their higher species richness in the understorey (P= 0.085; Additional file8). The NRI index was not influenced by the presence/absence of a given species in the overstorey. On the contrary, NTI was significantly influenced by
Q. petraea (Table 3). Indeed, the mean NTI index was higher in plots with this oak species present (Fig.5), in-dicating a closer relatedness between species (branch-tips of the phylogenetic tree) in the understorey of plots includ-ing this tree.
Fig. 2Neighbor Joining phylogenetic tree of the seed plant species recorded in the 36 plots based on ITS-5.8S DNA sequences. Major angiosperm clades and orders are indicated according to the APG IV system. Focal tree species forming the richness gradient in the plot system are in bold and marked with an asterisk;1replacingRuscus
Discussion
In relation to our first aim, results showed that the phylogenetic diversity of the understorey was invariably dependent on species richness, and that the strength of this relationship was not influenced by the number of species in the forest canopy. In previous studies show-ing decouplshow-ing between species richness and evolution-ary diversity, different causes were involved, including large-scale eco-geographical patterns and environmental drivers such as climate and soil type (Forest et al. 2007; Knapp et al.2008; Potter and Woodall2014). In contrast, evidence from more local studies in forest communities under relatively homogeneous conditions supports our finding that PD is almost a linear function of species rich-ness (Qian et al. 2014; Selvi et al. 2016). In our model
system, the slope of this function linking the two under-storey variables is not affected by species richness in the overstorey, hence the latter cannot serve as an indicator of the amount of plant evolutionary diversity at the forest floor. A positive decoupling of PD from USR along the OSR gradient would have occurred if the species that “enter” in the understorey of 3- or 4-species mixtures plots added a proportionally greater amount of evolution-ary diversity than those growing in pure stands or 2-species mixtures. Our non-significant result was likely due to incorrect prediction that more distantly related species are more able to use different niches, and/or to the incon-sistency of the environmental heterogeneity hypothesis as already suggested in other studies on overstorey-understorey diversity relationships in temperate forests (Barbier et al.2008; Ampoorter et al.2016).
In terms of phylogenetic structure, we found that randomness was the prevalent pattern in the stands examined here, showing that the understorey is formed by taxa that are related to each other as predicted by chance, both at species-level and deeper phylogenetic levels. However, the mainly positive values of NRI and NTI indicated a tendency to clustering which may be due to the coexistence of loosely related species adapted to the common set of conditions in our plots, such as low light availability, soil characteristics and, possibly,
Fig. 3Interaction plot for the linear models showing the non-significant effect of overstorey species richness (OSR), considering only the target trees, on the relationship between understorey species richness (USR) and understorey phylogenetic diversity (PD), always strongly positive. To facilitate its interpretation, the interaction effect is here presented showing a resampling of OSR values in four classes
Table 2ANOVA table from the linear mixed models evaluating the effect of overstorey species richness (OSR) on the
relationship between USR and PD in the understorey, and on NRI and NTI of the understorey
Response Term Sum Sq Mean Sq NumDF DenDF Fvalue P-value PD USR 4,606,196 4,606,196 1 30.984 49.261 < 0.001 ***
OSR 146,464 146,464 1 30.44 1.566 0.220
USR: OSR 169,664 169,664 1 31.074 1.814 0.188
NRI OSR 0.297 0.297 1 33.000 0.443 0.511
NTI OSR 0.119 0.119 1 15.140 0.276 0.607
Sum Sqsum of squares,Mean Sqmean squares,NumDFnumerator degree of freedom, DenDFdenominator degree of freedom
Significance code:‘***’highly significant
the legacy effects of the cyclic disturbance caused by centuries of coppice management.
Secondly, our results indicate that a potential biotic driver such as overstorey species diversity has inconsistent effects on the phylogenetic structure of the understorey community, suggesting again that the mixing of more tree species does not necessarily increase environmental heterogeneity or resource availability in the understorey. This is in line with recent findings by Sercu et al. (2017) who found that heterogeneity of light availability at the forest floor is not higher in mixed stands, and that abiotic niche variability may be independent from overstorey spe-cies richness. The non-significant influence of overstorey richness (as well as functional dispersion) on understorey species richness recently observed in European forests (Ampoorter et al.2014,2015, 2016) could also be related to the inconsistency of the environmental heterogeneity hypothesis. As in these studies, our finding can be better interpreted in light of the novel environment creation hypothesis, by which the new habitat conditions created by the mixing of more tree species (“true”diversity effect; Ball et al. 2008) do not allow to predict variations in species richness, composition and phylogenetic structure of the understorey, compared to the component species pure stands. In interpreting the lack of overstorey diversity effect observed here, however, the possible role of the shrub layer on understorey vegetation should be acknow-ledged. Though this layer was not considered in our study for practical reasons, it still represents a constitutive element of southern European thermophilous deciduous forests (Barbati et al.2007) and most of our plots (Carrari et al.2016). Shrubs may contribute to niche differentiation and facilitation, but negative effects on the abundance and diversity of the understorey by competition for light, water and soil nutrients can occur (Barbier et al.
2009). Hence, whether these minor woody species can
contribute in influencing the phylogenetic structure of the ground forest vegetation cannot be excluded and requires further investigation.
When looking at the effects of overstorey species iden-tity, the marginally positive effect ofQ. cerrison USR may have a number of reasons. One is the later budburst of this oak species compared with the other focal trees in our plots (Gellini and Grossoni1997), which means more light availability at the forest floor during the spring. More significant was the effect ofQ. petraeaon the NTI index. The presence of the sessile oak in the overstorey was found to be associated with an increase of clustering at the species-level, while the non-significant response of NRI indicated that the deeper phylogenetic nodes of the understorey community under this tree were not affected. In plant communities, clustering can result from various constraints among which habitat filtering driven by biotic and abiotic disturbance (e.g. fire; Verdú and Pausas2007) Table 3Results for the estimate of model coefficients and their
significance to assess the effect of overstorey species identity on PD, NTI e NRI
Resp. variable
Term Estimate Std. Error Adjusted SE zvalue P-value
PD (Intercept) 4250.938 187.236 194.237 21.885 < 0.001***
Quercus cerris 103.309 208.580 212.779 0.486 0.627
Quercus ilex −116.350 222.404 226.656 0.513 0.608
Ostrya carpinifolia 90.390 201.642 205.862 0.439 0.661
Quercus petraea −8.484 102.163 105.942 0.080 0.936
Castanea sativa −7.441 100.635 104.396 0.071 0.943 NRI (Intercept) 0.779 0.140 0.146 5.349 < 0.001***
Quercus cerris −0.070 0.151 0.154 0.455 0.649
Ostrya carpinifolia 0.051 0.134 0.137 0.370 0.712
Quercus petraea 0.026 0.101 0.104 0.254 0.799
Quercus ilex 0.017 0.088 0.091 0.182 0.856
Castanea sativa 0.012 0.081 0.084 0.140 0.889 NTI (Intercept) 0.546 0.117 0.122 0.471 < 0.001***
Quercus petraea 0.527 0.165 0.172 3.070 0.002**
Castanea sativa −0.018 0.078 0.080 0.227 0.820
Ostrya carpinifolia −0.013 0.071 0.073 0.178 0.859
Quercus ilex 0.012 0.069 0.071 0.170 0.865
Quercus cerris −0.012 0.068 0.070 0.165 0.869
Significance codes:‘***’highly significant;‘**’significant
or limiting environmental factors along ecological gra-dients (e.g. altitude; Qian et al. 2014; drought; Nagaraju Shivaprakash et al.2018) or successional stages (Stadler et al.2017). On the other hand, it can also result from com-petitive exclusion in non-restrictive, stable habitats (May-field and Levine 2010). In temperate forests of North America, for example, clustering was predominant in favorable conditions, while evenness was prevalent in stands from harsher environments (Potter and Koch
2014). Evidence about the auto-ecology and
morpho-functional traits of Q. petraea support this relationship, since in central Italy the sessile oak forms pure or mixed forests only in favorable conditions in terms of humidity, soil depth and fertility, and creates a habitat which sup-ports mesophilous geophytes and hemicryptophytes in the herb layer (Pignatti 1998; Blasi 2010). Hence, it is most unlikely that this widespread European tree can act as a biotic filter sieving stress-tolerant understorey species with phylogenetically conserved adaptive traits. Instead, it can be assumed that interspecific competition among plants under this tree is stronger than in the stands dominated by our other target species in less favorable conditions. For example, factors such as the heavy shading by the evergreen holm-oak (Quercus ilex), the soil acidification driven by the sweet chestnut (Castanea sativa), the dryer soil under the Turkey oak (Q. cerris) or the steep slopes often supporting O. carpinifolia are likely to limit inter-specific competition in the understorey. Competitive ex-clusion in environments with wide resource availability can decrease species diversity (Grime 1973; Gross et al. 2000) and can also result in phylogenetic clustering under the Niche Conservatism assumption. In fact, the set of morphological and functional traits enabling some species to exploit the resources better than others will be likely the result of a close phylogenetic relatedness between
them. Hence, the understorey species under Q. petraea
are more closely related to each other than expected by chance and are likely to share common traits that give them a competitive advantage in the use of the resources.
Conclusions
Due to its observational nature and small number of plots, this study cannot address the causal effects between overstorey tree species diversity/identity on understorey phylogenetic structure. Potential confounding factors are the small-scale variation of site conditions between plots and the presence of a significant shrub layer. Species diversity and identity effects in the latter have never been considered to date, though they may potentially interact with those driven by the overstorey trees and ultimately affect the understorey in an unpredictable way.
Despite these limits, however, our study opens a first window on the phylogenetic structure of the understorey vegetation of thermophilous deciduous forests and
provides original genetic data for its herbaceous species. Also, it represents a first attempt to explore the relation-ships between forest overstorey and understorey from a phylogenetic community perspective, using an ad-hoc sys-tem of plots in a native forest ecosyssys-tem inside protected areas. In detecting no influence of tree species richness, we suggest that mixed stands may not harbor a phylogen-etically more even or diverse understorey than
monocul-tures. The presence of an important forest tree, Q.
petraea, was instead found to increase the species-level evolutionary relatedness in the understorey, suggesting species identity to be more important than species rich-ness. This is not in line with evidence from non-native tree plantations in central Europe, where species identity did not affect the understorey phylogenetic structure (Piwczyński et al. 2016). Hence, further studies on wider geographic and environmental scales are needed to better understand the relationship between overstorey and understorey from an evolutionary standpoint. In particu-lar, the influence of given species combinations and single forest trees with a relevant role for silviculture should be analyzed in relation to the site conditions in which they are found. Evidence from these studies may help to fill the current gap between the mostly theoretical field of plant community phylogenetics and forest management.
Additional files
Additional file 1:ANOVA table from the linear models evaluating the effect of overstorey species richness (OSR) on the relationship between Species Richness (SR) and Faith’s phylogenetic diversity (PD) in the understorey, in the two cases in which OSR includes only the focal species or all species in the canopy. (DOCX 14 kb)
Additional file 2:ANOVA table from the linear models evaluating the effect of overstorey species richness (OSR) on Net Relatedness Index (NRI) and Nearest Taxon Index (NTI) of the understorey, in the two cases in which OSR is described accounting the focal species, or all species in the canopy. (DOCX 14 kb)
Additional file 3:Model selection table from analyses of the effect of target species identity in the overstorey (CS =Castanea sativa; OC =Ostrya carpinifolia; QC =Quercus cerris; QI =Quercus ilex; QP =Quercus petraea) on the Species Richness of the understorey. Only models with aΔAICc < 4 were used to calculate the averaged coefficient estimates. (DOCX 21 kb)
Additional file 4:Model selection table from analyses of the effect of target species identity in the overstorey (CS =Castanea sativa; OC =Ostrya carpinifolia; QC =Quercus cerris; QI =Quercus ilex; QP =Quercus petraea) on the Faith’s phylogenetic diversity (PD) of the understorey. Only models with aΔAICc < 4 were used to calculate the averaged coefficient estimates. (DOCX 21 kb)
Additional file 5:Model selection table from analyses on the effect of the target species identity in the overstorey (CS =Castanea sativa; OC =Ostrya carpinifolia; QC =Quercus cerris; QI =Quercus ilex; QP =Quercus petraea) on the Net Relatedness Index (NRI) of the understorey. Only models with aΔAICc < 4 were used to calculate the averaged coefficient estimates. (DOCX 21 kb)
understorey. Only models with aΔAICc < 4 were used to calculate the averaged coefficient estimates. (DOCX 21 kb)
Additional file 7:Interaction plot for the linear mixed models showing the non-significant effect of overstorey species richness (OSR) on the relationship between species richness and phylogenetic diversity (PD) in the understorey, always strongly positive. OSR was described considering A) all of the five focal trees and B)“all trees”with dbh≥7 cm reaching the subdominant or dominant layer. In order to facilitate the interpretation of the interaction term the figures show a resampling of OSR values in three and four classes respectively. (DOCX 153 kb)
Additional file 8:Effect of overstorey species identity on understorey species richness (A), phylogenetic diversity (B) and Net Relatedness Index (C). Species abbreviations are as in Fig.5. (DOCX 143 kb)
Additional file 9:List of seed plants (excluding ferns) recorded in the plots, with GenBank accessions used for tree construction and subsequent calculation of phylogenetic diversity metrics. Originally sequenced taxa are in bold; for these species vouchers details are given. (DOCX 27 kb)
Abbreviations
AICc:Akaike information criterion; APG: Angiosperm phylogeny group; MNTD: Mean nearest taxon distance; MPD: Mean phylogenetic distance; NRI: Net Relatedness Index; NTI: Nearest taxon index; OSR: Overstorey species richness; PD: Faith’s phylogenetic diversity metric; USR: Understorey species richness
Acknowledgements
Authors wish to acknowledge Filippo Bussotti and Martina Pollastrini (Firenze) for help during field work for the FunDIV Europe Project and discussion of the data.
Authors’contributions
AC and FS conceived the work; AC, LB and FS acquired the data; AC and LL analyzed the data; FS, AC and LL drafted the manuscript; EA, KV and LL critically revised the article and contributed to the drafting of the manuscript. All authors read and approved the final manuscript.
Funding
Plot establishment and understorey data collection were performed in the framework of FunDivEUROPE, an FP7/2007–2013 project under agreement n°265171. Laboratory work was supported by research grants to AC and FS from the University of Florence and the Italian Ministry for University and Scientific Research. KV was supported by an ERC Consolidator Grant (PASTFORWARD-project; No: 614839).
Availability of data and materials
The datasets used and/or analysed during the current study are available from the corresponding author on reasonable request.
Ethics approval and consent to participate
Not applicable.
Consent for publication
Not applicable.
Competing interests
The authors declare that they have no competing interests.
Author details
1Department of Biology, University of Florence, Florence, Italy.2Department
of Environment, Forest and Nature Lab, Ghent University, Ghent, Belgium. 3Department of Agriculture, Food, Environment and Forestry, Laboratories of
Botany, University of Florence, Florence, Italy.
Received: 24 October 2018 Accepted: 19 June 2019
References
Ampoorter E, Baeten L, Koricheva J, Vanhellemont M, Verheyen K (2014) Do diverse overstoreys induce diverse understoreys? Lessons learnt from an
experimental-observational platform in Finland. For Ecol Manag 318:206–215. https://doi.org/10.1016/j.foreco.2014.01.030
Ampoorter E, Baeten L, Vanhellemont M, Bruelheide H, Scherer-Lorenzen M, Baasch A, Erfmeier A, Hock M, Verheyen K (2015) Disentangling tree species identity and richness effects on the herb layer: first results from a German tree diversity experiment. J Veg Sci 26:742–755.https://doi. org/10.1111/jvs.12281
Ampoorter E, Selvi F, Auge H, Baeten L, Berger S, Carrari E, Coppi A, Fotelli M, Radoglou K, Setiawan NN, Vanhellemont M, Verheyen K (2016) Driving mechanisms of overstorey-understorey diversity relationships in European forests. Perspect Plant Ecol Evol Syst 19:21–29.https://doi.org/10.1016/j. ppees.2016.02.001
APG IV (2016) An update of the angiosperm phylogeny group classification for the orders and families of flowering plants. Bot J Linn Soc 181:1–20.https:// doi.org/10.1111/boj.12385
Arroyo Rodríguez V, Cavender-Bares J, Escobar F, Melo FPL, Tabarelli M, Santos BA (2012) Maintenance of tree phylogenetic diversity in a highly fragmented rain forest. J Ecol 100:702–711. https://doi.org/10.1111/j.1365-2745.2011.01952.x
Baeten L, Verheyen K, Wirth C, Bruelheide H, Bussotti F, Finer L, Jaroszewicz B, Selvi F, Valladaresh F, Allan E, Ampoorter E, Auge H, Avacariei D, Barbaro L, Barnoaiea I, Bastias CC, Bauhus J, Beinhoff C, Benavides R, Benneter A, Berger S, Berthold F, Boberg J, Bonal D, Braggernann W, Carnol M, Castagneyrol B, Charbonnier Y, Checko E, Coomess D, Coppi A, Dalmaris E, Danila G, Dawud SM, de Vries W, De Wandeler H, Deconchat M, Domisch T, Duduman G, Fischer M, Fotelli M, Gessler A, Gimeno TE, Granier A, Grossiord C, Guyot V, Hantsch L, Hattenschwiler S, Hector A, Hermy M, Holland V, Jactel H, Joly FX, Jucker T, Kolb S, Koricheva J, Lexer MJ, Liebergesell M, Milligan H, Muller S, Muys B, Nguyen D, Nichiforel L, Pollastrini M, Proulx R, Rabasa S, Radoglou K, Ratcliffe S, Raulund-Rasmussen K, Seiferling I, Stenlid J, Vesterdal L, von Wilpert K, Zavala MA, Zielinski D, Scherer-Lorenzen M (2013) A novel comparative research platform designed to determine the functional significance of tree species diversity in European forests. Perspect Plant Ecol Evol Syst 15:281–291.https://doi.org/10.1016/j.ppees.2013.07.002 Ball BA, Hunter MD, Kominoski JS, Swan CM, Bradford MA (2008) Consequences
of non-random species loss for decomposition dynamics: experimental evidence for additive and non-additive effects. J Ecol 96:303–313.https://doi. org/10.1111/j.1365-2745.2007.01346.x
Barbati A, Corona P, Marchetti M (2007) European Forest Types Categories and types for sustainable forest management reporting and policy, EEA Technical report no. 9/2006, 2nd edn. European Environment Agency, Copenhagen Barbier S, Chevalier R, Loussot P, Bergès L, Gosselin F (2009) Improving
biodiversity indicators of sustainable forest management: tree genus abundance rather than tree genus richness and dominance for understory vegetation in French lowland oak hornbeam forests. For Ecol Manag 258:S176–S186
Barbier S, Gosselin F, Balandier P (2008) Influence of tree species on understorey vegetation diversity and mechanisms involved–a critical review for temperate and boreal forests. For Ecol Manag 254:1–15.https://doi.org/10. 1016/j.foreco.2007.09.038
Barton K (2016) MuMIn: multi-Model Inference. R package version 1.15.6.https:// CRAN.R-project.org/package=MuMIn. Accessed 01 Oct 2018
Bates D, Mächler M, Bolker B, Walker S (2015) Fitting linear mixed-effects models using lme4. J Stat Softw 67:1–48.https://doi.org/10.18637/jss.v067.i01 Blasi C (2010) La Vegetazione d’Italia. Palombi, Roma
Borchsenius F (2009) FastGap, version 1.2. Department of Biological Sciences, University of Aarhus, Denmark.https://www.aubot.dk/FastGap_home.htm. Accessed 01 Oct 2018
Burnham KP, Anderson DR (2002) Model selection and multimodel inference - a practical information-theoretic approach, 2nd edn. Springer-Verlag, Berlin Bussotti F, Coppi A, Pollastrini M, Feducci M, Baeten L, Scherer-Lorenzen M,
Verheyen K, Selvi F (2012) Le aree forestali italiane di FunDivEUROPE: un nuovo progetto FP7 sul significato funzionale della biodiversità forestale in Europa. Forest@ 9:251–259.https://doi.org/10.3832/efor0704-009 Cadotte MW, Dinnage R, Tilman D (2013) Phylogenetic diversity promotes
ecosystem stability. Ecology 93:S223–S233
Carrari E, Ampoorter E, Coppi A, Selvi F (2016) Diversity of secondary woody species in relation to species richness and cover of dominant trees in thermophilous deciduous forests of central Italy. Scand J For Res 31:484–494. https://doi.org/10.1080/02827581.2015.1081981
Faith DP (1992) Conservation evaluation and phylogenetic diversity. Biol Conserv 61:1–10.https://doi.org/10.1016/0006-3207(92)91201-3
Faith DP, Magallon S, Hendry AP, Conti E, Yahara T, Donoghue MJ (2010) Evosystem services: an evolutionary perspective on the links between biodiversity and human well-being. Curr Opin Environ Sustain 2:66–74. https://doi.org/10.1016/j.cosust.2010.04.002
Forest F, Grenyer R, Rouget M, Davies TJ, Cowling RM, Faith DP (2007) Preserving the evolutionary potential of floras in biodiversity hotspots. Nature 445:757– 760.https://doi.org/10.1038/nature05587
Garnier E, Navas ML, Grigulis K (2015) Plant functional diversity. Oxford University Press, UK
Gellini R, Grossoni P (1997) Botanica Forestale vol 2. Angiosperme, Cedam Padova Gilliam FS (2007) The ecological significance of the herbaceous layer in temperate forest ecosystems. BioScience 57:845–858.https://doi.org/10.1641/B571007 Gilliam FS (2014) The herbaceous layer in forests of eastern North America.
Oxford University Press, New York
Grime JP (1973) Competitive exclusion in herbaceous vegetation. Nature 242: 344–347.https://doi.org/10.1038/242344a0
Gross KL, Willig MR, Gough L, Inouye R, Cox SB (2000) Patterns of species diversity and productivity at different spatial scales in herbaceous plant communities. Oikos 89:417–427.https://doi.org/10.1034/j.1600-0706.2000.890301.x Hall TA (1999) BioEdit: a user-friendly biological sequence alignment editor
analysis program for windows 95/98/NT. Nucleic Acids Symp Ser 41:95–98 Harvey PH, Pagel MD (1991) The comparative method in evolutionary biology. In:
Oxford series in ecology and evolution, vol 1. Oxford University Press, UK Hollingsworth PM, Graham SW, Little DP (2011) Choosing and using a plant DNA
barcode. PLoS One 6(5):e19254.https://doi.org/10.1371/journal.pone.0019254 Huston M (1979) A general hypothesis of species diversity. Am Nat 113:81–101.
https://doi.org/10.1086/283366
Katoh K, Standley DM (2013) MAFFT multiple sequence alignment software version 7: improvements in performance and usability. Mol Biol Evol 30:772– 780.https://doi.org/10.1093/molbev/mst010
Kembel SW, Cowan PD, Helmus MR, Cornwell WK, Morlon H, Ackerly DD (2010) Picante: {R} tools for integrating phylogenies and ecology. Bioinformatics 26: 1463–1464.https://doi.org/10.1093/bioinformatics/btq166
Kirwan L, Connolly J, Finn J, Brophy C, Lüscher A, Nyfeler D, Sebastia MT (2009) Diversity-interaction modeling: estimating contributions of species identities and interactions to ecosystem function. Ecology 90:2032–2038.https://doi. org/10.1890/08-1684.1
Knapp S, Kühn I, Schweiger O, Klotz S (2008) Challenging urban species diversity: contrasting phylogenetic patterns across plant functional groups in Germany. Ecol Lett 11:1054–1064.https://doi.org/10.1111/j.1461-0248.2008.01217.x Lapiedra O, Sol D, Traveset A, Vilà M (2015) Random processes and phylogenetic
loss caused by plant invasions. Glob Ecol Biogeogr 24:774–785.https://doi. org/10.1111/geb.12310
Levine JM, Hille Ris Lambers J (2009) The importance of niches for the maintenance of species diversity. Nature 46:254–257.https://doi.org/10.1038/nature08251 Li D, Trotta L, Marx HE, Allen JM, Sun M, Soltis DE, Soltis P, Guralnick RP, Baiser B
(2018) For comparing phylogenetic diversity among communities, go ahead and use synthesis phylogenies. BioRxiv.https://doi.org/10.1101/370353 Li DZ, Gao LM, Li HT, Wang H, Ge XJ, Liu JQ, Chen ZD, Zhou SL, Chen SL, Yang
JB, Fu CX, Zeng CX, Yan HF, Zhu YJ, Sun YS, Chen SY, Zhao L, Wang K, Yang T, Duan GW (2011) Comparative analysis of a large dataset indicates that internal transcribed spacer (ITS) should be incorporated into the core barcode for seed plants. Proc Natl Acad Sci U S A 49:19641–19646.https:// doi.org/10.1073/pnas.1104551108
Mayfield MM, Levine JM (2010) Opposing effects of competitive exclusion on the phylogenetic structure of communities. Ecol Lett.https://doi.org/10.1111/j. 1461-0248.2010.01509.x
Mihaescu R, Levy D, Pachler L (2009) Why neighbour-joining works. Algorithmica 59:1–24.https://doi.org/10.1007/s00453-007-9116-4
Ministerial Conference on the Protection of Forests in Europe (2011) State of Europe’s forests 2011 - Status and trends in Sustainable Forest Management in Europe.https://www.foresteurope.org/documentos/State_of_Europes_ Forests_2011_Report_Revised_November_2011.pdf. Accessed 01Oct 2018 Mölder A, Bernhardt-Römermann M, Schmidt W (2008) Herb-layer diversity in deciduous forests: raised by tree richness or beaten by beech? For Ecol Manag 256:272–281.https://doi.org/10.1016/j.foreco.2008.04.012 Muller RN (2014) Nutrient relations of the herbaceous layer in deciduous forest
ecosystems. In: Gilliam FS (ed) the herbaceous layer in forests of eastern North America. Oxford University Press, New York, pp 13–34
Nagaraju Shivaprakash K, Ramesh BR, Umashaanker R, Dayanandan S (2018) Functional trait and community phylogenetic analyses reveal environmental filtering as the major determinant of assembly of tropical forest tree communities in the Western Ghats biodiversity hotspot in India. For Ecosyst 5:25.https://doi.org/10.1186/s40663-018-0144-0
Pignatti S (1998) I boschi d′Italia: Sinecologia e biodiversità. [the forests of Italy: synecology and biodiversity]. Utet. Italian, Torino
Piwczyński M, Puchałka R, Ulrich W (2016) Influence of tree plantations on the phylogenetic structure of understorey plant communities. For Ecol Manag 376:231–237.https://doi.org/10.1016/j.foreco.2016.06.011
Potter KM, Koch FH (2014) Phylogenetic community structure of forests across the conterminous United States: regional ecological patterns and forest health implications. For Sci 60:851–861.https://doi.org/10.5849/forsci.13-115 Potter KM, Woodall CW (2014) Does biodiversity make a difference? Relationships
between species richness, evolutionary diversity and aboveground live tree biomass across U.S. forests. For Ecol Manag 321:117–129.https://doi.org/10. 1016/j.foreco.2013.06.026
Prinzing A, Durka W, Klotz S, Brandl R (2001) The niche of higher plants: evidence for phylogenetic conservatism. Theory Proc R Soc Lond B 268:2383–2389. https://doi.org/10.1098/rspb.2001.1801
Qian H, Hao Z, Zhang J (2014) Phylogenetic structure and phylogenetic diversity of angiosperm assemblages in forests along an elevational gradient in Changbaishan, China. J Pl Ecol:1–14.https://doi.org/10.1093/jpe/rtt072 R Core Team (2017) A Language and Environment for Statistical Computing. R
Foundation for Statistical Computing, Viennahttp://www.R-project.org. Accessed 01 Oct 2018
Rodrigues ASL, Gaston KJ (2002) Maximising phylogenetic diversity in the selection of networks of conservation areas. Biol Conserv 105:103–111. https://doi.org/10.1016/S0006-3207(01)00208-7
Selvi F, Carrari E, Coppi A (2016) Impact of pine invasion on the taxonomic and phylogenetic diversity of a relict Mediterranean forest ecosystem. For Ecol Manag 367:1–11.https://doi.org/10.1016/j.foreco.2016.02.013
Sercu BK, Baeten L, van Coillie F, Martel A, Lens L, Verheyen K, Bonte D (2017) How tree species identity and diversity affect light transmittance to the understorey in mature temperate forests. Ecol Evol.https://doi.org/10. 1002/ece3.3528
Silvertown J (2004) Plant coexistence and the niche. Trends Ecol Evol 19:605–611. https://doi.org/10.1016/j.tree.2004.09.003
Simmons MP, Ochoterena H (2000) Gaps as characters in sequence-based phylogenetic analyses. Syst Biol 49:369–381.https://doi.org/10.1093/ sysbio/49.2.369
Srivastava DS, Cadotte MW, MacDonald AAM, Marushia RG, Mirotchnicket N (2012) Phylogenetic diversity and the functioning of ecosystems. Ecol Lett 15:637–648.https://doi.org/10.1111/j.1461-0248.2012.01795.x
Stadler J, Klotz S, Brandl R, Knapp S (2017) Species richness and phylogenetic structure in plant communities: 20 years of succession. Web Ecol 17:37–46. https://doi.org/10.5194/we-17-37-2017
Swofford DL (2000) PAUP* 4.0: Phylogenetic analysis using parsimony(* and other methods), version 4.0. Sinauer, Sunderland
Tallents LA, Lovett JC, Hall JB, Hamilton AC (2005) Phylogenetic diversity of forest trees in the Usambara mountains of Tanzania: correlations with altitude. Bot J Linn Soc 149:217–228
Tucker CM, Cadotte MW, Carvalho SB, Davies TJ, Ferrier S, Fritz SA, Grenyer R, Helmus MR, Jin LS, Mooers AO, Pavoine S, Purschke O, Redding DW, Rosauer DF, Winter M, Mazel F (2016) A guide to phylogenetic metrics for conservation, community ecology and macroecology. Biol Rev 92:698–715. https://doi.org/10.1111/brv.12252
Verdú M, Pausas JG (2007) Fire drives phylogenetic clustering in Mediterranean Basin woody plant communities. J Ecol 95:1316–1323.https://doi.org/10. 1111/j.1365-2745.2007.01300.x
Verstraeten G, Baeten L, De Frenne P, Vanhellemont M, Thomaes A, Boonen W, Muys B, Verheyen K (2013) Understorey vegetation shifts following the conversion of temperate deciduous forest to spruce plantation. For Ecol Manag 289:363–370.https://doi.org/10.1016/j.foreco.2012.10.049 Vockenhuber EA, Scherber C, Langenbruch C, Meiner M, Seidel D, Tscharntke T
(2011) Tree diversity and environmental context predict herb species richness and cover in Germany’s largest connected deciduous forest. Perspect Plant Ecol Evol Syst 13:111–119.https://doi.org/10.1016/j.ppees.2011.02.004
Webb CO, Ackerly DD, Kembel SW (2008) Phylocom: software for the analysis of phylogenetic community structure and trait evolution. Bioinformatics 24: 2098–2100.https://doi.org/10.1093/bioinformatics/btn358
Webb CO, Ackerly DD, McPeek MA, Donoghue MJ (2002) Phylogenies and community ecology. Annu Rev Ecol Evol Syst 33:475–505.https://doi.org/10. 1146/annurev.ecolsys.33.010802.150448
Welch NT, Belmont JM, Randolph JC (2007) Summer ground layer biomass and nutrient contribution to above-ground litter in an Indiana temperate deciduous forest. Am Midl Nat 157:11–26. https://doi.org/10.1674/0003-0031(2007)157[11:SGLBAN]2.0.CO;2
White TJ, Bruns T, Lee S, Taylor J (1990) Amplification and direct sequencing of fungal ribosomal RNA genes for phylogenetics. In: Innis MA, Gelfand DH, Sninsky JJ, White JW (eds) PCR protocols: a guide to methods and applications. Academic Press, New York, pp 315–322.https://doi.org/10.1016/ b978-0-12-372180-8.50042-1
Wiens JJ, Ackerly DD, Allen AP, Anacker BL, Buckley LB, Cornell HV, Damschen EI, Davies TJ, Grytne JA, Harrison SP, Hawkins BA, Holt RD, McCain CM, Stephens PR (2010) Niche conservatism as an emerging principle in ecology and conservation biology. Ecol Lett 13:1310–1324. https://doi.org/10.1111/j.1461-0248.2010.01515.x