ReseaRch aRticle
F
IRER
ESPONSE TOL
OCALC
LIMATEV
ARIABILITY:H
UASCARÁNN
ATIONALP
ARK,P
ERUJohn All1*, Michael Medler2, Sylvie Arques2, Rebecca Cole3, Tommy Woodall4,
Justin King4, Jun Yan4, and Carl Schmitt5
1 Department of Environmental Sciences, Huxley College, Western Washington University, 516 High Street, Bellingham, Washington 98225-9085, USA
2 Department of Environmental Studies, Huxley College, Western Washington University, 516 High Street, Bellingham, Washington 98225-9085, USA
3 Department of Natural Resources and Environmental Management, University of Hawaii at Manoa,
1910 East-West Road., Honolulu, Hawaii 96822, USA
4 Western Kentucky University,
1906 College Heights Boulevard, Bowling Green, Kentucky 42101, USA
5 National Center for Atmospheric Research, Earth Systems Laboratory, Mesoscale and Microscale Meteorology,
3090 Center Green Drive, Boulder, Colorado 80301-3000, USA
*Corresponding author: Tel.: +1-270-745-5975; e-mail: mt.clim8@gmail.com
ABSTRACT
In Huascarán National Park (HNP), Peru, grazing and anthropogenic burn-ing have been interactburn-ing for decades with natural ignitions and climate
vari-ability to reconfigure the fire regimes of
the vegetative communities. However, over the last few decades, human
alter-ations to the region’s fire regime were
perceived by resource managers to
have led to an overall increase in fire occurrence and fire extent. Resource
managers are now very concerned about the impacts of increasing
anthro-pogenic fires in the National Park be
-cause these fires seem to disrupt eco
-logical processes and tourism. To test
these beliefs and examine the fire activ
-ity from 2002 to 2014, we used a time
RESUMEN
En el Parque Nacional Huascarán de Perú, el pastoreo y las quemas antropogénicas han in-teractuado por décadas con igniciones
natura-les y la variabilidad climática, para configurar
series of several different data products including the MODIS Terra and Aqua platforms (Active Fire and Burned Area) as well as local air temperature and precipitation data. The
intra-annu-al distribution of fires in the HNP and
its buffer zone (BZ) showed a consis-tent increase in the number of active
fires and burned areas during the dry
season (Peruvian winter). The active
fire anomalies showed higher fire activ
-ity in the HNP over the period 2002 to 2014. However, burned area anomalies
showed consistently higher fire activity in the BZ during the high fire years in
2003, 2005, 2010, and 2014. The spa-tial distribution of areas burned in the HNP and the BZ from 2002 to 2014 showed that most recurrent burning was inside the BZ, which is in compli-ance with the HNP’s policy but in con-tradiction with local resource manag-ers’ perceptions. Although human
ac-tivity may influence local fire dynam
-ics, fire responses seemed to be mainly influenced by local climate oscillations. Our results suggest a clear fire response
to local climate and, in particular, to precipitation variability. However, it
appears that there was a low fire return
interval for any given location and that the total area burned for a given year is relatively small. Therefore, small-scale
fires created an appearance of larger fire impacts than actually occur within
the HNP and its BZ. In this instance,
fire perception and fire reality are not
aligning and the new challenge for re-source managers is how best to recon-cile these two factors to more effective-ly manage the parklands.
datos incluyendo los de la plataforma del MO-DIS Terra and Aqua (incendios activos y área quemada), y también datos locales de tempera-tura del aire y precipitación. La distribución intra-anual de incendios en el Parque Nacional Huascarán (HNP) y de su zona buffer (BZ) mostró un incremento consistente en el núme-ro de incendios activos y áreas quemadas du-rante la estación seca (invierno en el Perú). Las anomalías activas de fuegos mostraron mayor actividad en el HNP en el período 2002 al 2014. Sin embargo, las anomalías en el área quemada mostraron incrementos consistentes en la actividad de fuegos en la BZ en los años de alta actividad de incendios en 2003, 2005, 2010, y 2014. La distribución espacial de las áreas quemadas en el HNP y en la BZ desde 2002 hasta 2014 mostró que los incendios más recurrentes fueron dentro de la BZ, lo que está de acuerdo con las políticas del parque, pero que se contradicen con las percepciones de los gestores de recursos. Aunque la actividad
hu-mana puede influenciar la dinámica local de
los incendios, las respuestas del fuego
parecie-ran estar mayormente influenciadas por las os
-cilaciones del clima local y, en particular, por la variabilidad en la precipitación. Sin embar-go, pareciera que hay un bajo intervalo de re-torno del fuego para un lugar en particular, y que el área total quemada en un año en parti-cular es relativamente baja. Por lo tanto, fue-gos de pequeña escala crean la apariencia de impactos mayores (causados por grandes in-cendios) cuando en realidad éstos no ocurren dentro del HNP o la BZ. En este caso, la per-cepción de la ocurrencia de los incendios y los que en realidad ocurren no concuerdan, y el nuevo desafío para los gestores de recursos es como encontrar la mejor manera de reconciliar estos dos factores para manejar más efectiva-mente estos parques.
Keywords: Andes, climate variability, fire extent, fire occurrence, MODIS, Peru, satellite imagery
Citation: All, J., M. Medler, S. Arques, R. Cole, T. Woodall, J. King, J. Yan, and C. Schmitt. 2017. Fire response to local climate variability: Huascarán National Park, Peru. Fire Ecology
INTRODUCTION
The Peruvian Andes provide critical eco-system services for human populations and harbor high levels of biodiversity, including endemic and threatened species. Because of the strong interdependence of human and nat-ural systems, this region is particularly vulner-able to the impacts of climate change and en-vironmental degradation. Deforestation, con-version of land for agricultural uses, and in-creased grazing pressure have extensively al-tered high altitude vegetation cover (Byers 2000, Sarmiento and Frolich 2002, Postigo et al. 2008, Young 2009). In addition, the Cor-dillera Blanca (CB) is undergoing rapid chang-es due to rising temperaturchang-es (Vuille et al. 2008a, Rabatel et al. 2013, Schauwecker et al. 2014, Vuille et al. 2015) and glacial retreat (Postigo et al. 2008, Racoviteanu et al. 2008, Silverio and Jaquet 2012, Burns and Nolin
2014). One of the most significant ecological
consequences of these changes is a change in
fire activity (Román-Cuesta et al. 2014).
The response of fire activity to short-term climate variability and human influence is still
poorly understood in the CB due to the
ab-sence of historical data and ground-based fire
references. Consequently, changes at the local level remain to be documented. Our goal was to assess preexisting conceptions and help lo-cal Huascarán National Park (HNP), Peru, land managers better understand how the
spa-tial and temporal patterns of local fires and fire
regimes have been changing over the last de-cade in response to both anthropogenic and
climatic influences. We offer some insights into the relationship between changes in fire activity, human influence, and local climate variability on fire in the HNP and its buffer
zone (BZ) over the period 2002 to 2014. Such improved information could help Park re-source managers better manage the parklands into the near future. The main objectives of this research can be summarized as follows: 1)
analyze the patterns in fire occurrence, season
-ality, and spatial distribution from 2002 to 2014; and 2) assess the relationships between
temperature and precipitation and fire activity.
First, we hypothesized that the HNP
expe-riences higher fire occurrences than the BZ.
Secondly, we hypothesized that there has been
an increase in the fire frequency and extent
over the last decade. Finally, based on
previ-ous research, we surmised that fire activity is strongly influenced by local climate variability.
Human Drivers and Fire Activity
In the tropical Andes, anthropogenic fires
have been interacting with natural ignitions for
millennia to reconfigure the fire regime and
population dynamics of the vegetation com-munities (Byers 2000, Young and Lipton 2006, DiPasquale et al. 2008, Young 2009). In the Peruvian Andes, Paduano et al. (2003) found low abundances of local and regional charcoal in the sediments of Lake Titicaca at circa 17 700 yr BP. Bush et al. (2005) reported a progressive increase in pollen concentration and charcoal between circa 15 000 yr BP and 11 000 yr BP that corresponds to an increase in vegetative cover and biomass. They also re-ported a sharp increase in charcoal abundance circa 3500 yr BP (mid to late Holocene) that corresponds with archaeological evidence of expanding human presence in the area. In-creased anthropogenic disturbance and major
influx of larger charcoal fragments are report
-ed throughout the Andes during the late Holo-cene (since circa 1200 yr BP; Chepstow-Lusty et al. 1998, Bush et al. 2005, Villota and Beh-ling 2014). Humans influence fire regimes
(spread, intensity and severity, number and
spatial and temporal patterns of fires) by modi
-fying key variables (e.g., fuel type, fuel struc-ture and continuity, ignition, etc.) that affect
fire activity (Bowman et al. 2011). Ignition
sources, for example, tend to increase drasti-cally in human-altered landscapes (Cochrane
the tropical Andes (Román-Cuesta et al. 2004, Román-Cuesta et al. 2011). In the Peruvian
Andes, natural fires are often ignited by light
-ning strikes and occur mainly in the rainy sea-son when the storms are usually associated with heavy rains (Manta Nolasco and León 2004). However, much controlled burning and
extensive fires are due to livestock owners who ignite fires all year long, especially during
the dry season, to eliminate dry biomass and improve grass regrowth for the following year (Sarmiento and Frolich 2002).
Climate Change and Local Climate Variability
Paleoecological and paleoenvironmental
studies show that fire activity has varied glob
-ally and continuously in response to global
and regional climatic fluctuations (Weng et al.
2004, Power et al. 2008, Marlon et al. 2009, Villota and Behling 2014). However, few studies have explored the recent changes in
fire activity (increases or decreases) in the
tropical Andes and their connection to climate change and local climate oscillations (Román-Cuesta et al. 2014).
The average global surface temperature has increased by 0.85 °C over the period 1880 to 2012 (Hewitson et al. 2014). Analysis of
near-surface temperature records from 279 sta-tions in the tropical Andes (Ecuador, Peru, Bo-livia) for the period 1930 to 2006 revealed a consistent increase after the mid 1970s, with an average warming of 0.10 °C per decade over the last 70 years, and an overall tempera-ture increase of 0.68 °C since 1939 (Vuille et al. 2008a). In the CB, the average air tem-perature has increased by 0.31 °C per decade between 1969 and 1998 but the recent rate has decelerated at over 100 observation stations to 0.13 °C per decade over the period 1983 to 2012 (Schauwecker et al. 2014). Schauweck-er et al. (2014) point out that the increase of air temperature in the last 30 years is dominant in the dry season (JJA [July through August] and SON [September through November]).
Due to the large spatial variability, no distinct long-term trends in precipitation have been observed on a regional scale for the tropical Andes (Vuille et al. 2003). However, Schau-wecker et al. (2014) found a strong increase in precipitation during the wet and transition sea-sons (SON, DJF [December through Febru-ary], and MAM [March through May]) in the CB over the last 30 years (60 mm decade−1 be-tween 1983 and 2012; Schauwecker et al. 2014). This increase is due to stronger easter-ly winds that facilitate the advection of moist air from the Amazon basin (Schauwecker et al.
2014). Consequently, changes in fire activity
because of warmer or wetter conditions are likely to occur in the CB. Román-Cuesta et al.
(2014) showed a synchronous fire response to
climate forcing in Ecuador, Peru, and Bolivia. More importantly, their results indicated a
clear climate influence, not a human-driven in
-fluence, on fire activity both in the dry and wet
seasons, and that fuel build-up did not play a
significant role.
METHODS
Study Area
Huascarán National Park is located in the Cordillera Blanca range within the Department
of Ancash, Peru (8°08ꞌS to 9°58ꞌS and 77°00ꞌW to 77°52ꞌW; Figure 1). The Park (340 000 ha)
was established in 1975; accepted as a United
Nations Educational, Scientific, and Cultural
Organization (UNESCO) Biosphere Reserve in 1977; and designated as a UNESCO World Heritage site in 1985. The BZ covers an area of approximately 170 000 ha. The 1990 Mas-ter Plan established its limits and the INRENA (Peruvian National Institute of Natural
Re-sources) made its description official in 2001
number of hot springs (UNESCO 2014). The CB is also the largest glaciated area in the tropics (Morales Arnao and Hastenrath 1999).
The diversity of its flora and fauna, and its
ecological and geological characteristics with-in tropical latitudes, make this region especial-ly unique.
The Andes Mountains have a cool to cold climate with rainy summers (austral summer) and very dry winters (Garreaud 1999, Pid-wirny 2011). Precipitation in the CB is
associ-ated with the intensification of the South
American summer monsoon (Garreaud et al. 2009), with average values of 770 mm yr-1 in the northern portions of the park, and 470 mm yr-1 in the southern valleys. The wet season occurs during the spring and summer (October to March) and usually peaks between February and March, whereas the April to September (fall and winter) part of the year is generally characterized by very dry conditions. The wet season brings 70 % to 80 % of the annual pre-cipitation (Kaser et al. 1990, Kaser and Georg-es 1997). Generally, relatively cool years in
the Cordillera Blanca are wetter than normal, while relatively warm years are drier than nor-mal (Vuille et al. 2008a). Precipitation in the Cordillera Blanca originates primarily from very humid Amazonian air masses, and the hy-grometric seasonality is due to the seasonal
in-fluence of the South American monsoon.
There is no marked thermal seasonality. Tem-perature is inversely proportional to the alti-tude, varying from temperate (annual average of 18 °C) in the valleys to frigid (annual aver-age below 0 °C) in the highest elevations (Pid-wirny 2011).
Fire Data Sources
We used satellite-based fire datasets due to the lack of local ground-based fire references
in the CB (Table 1). We chose both the Na-tional Aeronautics and Space Administration’s Moderate Resolution Imaging Spectrometer (MODIS) Active Fire detections (MYD14A2) and MODIS Burned Area locations
(MC-D45A1) to assess the seasonal fire frequency
and annual fire patterns in HNP and its BZ be
-tween 2002 and 2014. The MODIS active fire
MYD14A2 uses a contextual algorithm (Gi-glio et al. 2006a) that exploits the strong
emis-sion of mid-infrared radiation from fires (Mat
-son and Dozier 1981). The
under-representa-tion of fires may occur because of the size of the fires (too small) or the lack of time overlap between the satellite overpass and the fires.
Fire visibility might also be affected by per-sistent cloud cover, dense smoke, or canopy cover (Roy et al. 2002). Giglio et al. (2006b)
added that, although the “fire count” product
captures many aspects of the spatial
distribu-tion and seasonality of burning, it is difficult to
relate it to actual area burned due to the vari-ability in fuel conditions and the differences in
fire behavior.
The MODIS burned area product MC-D45A1, generated from 500 m MODIS
cloud-free reflectance time series data, uses a differ
-ent algorithm that relies on change in surface
reflectance and a static wavelength threshold
70°0'0"W 70°0'0"W
75°0'0"W 75°0'0"W
80°0'0"W 80°0'0"W
0°0'0" 0°0'0"
5°0'0"S 5°0'0"S
10°0'0"S 10°0'0"S
15°0'0"S 15°0'0"S
³
0 130 260 520 Kilometers Study area
Peru
Figure 1. Site location in the Cordillera Blanca,
(Roy et al. 2005). Studying fires using the
coarse 500 m resolution of MODIS fire prod
-ucts is truly a problem in mountainous terrain. MODIS pixels often include 6500 m mountain
peaks and 3500 m valley floors, discarding the
obscuring effect caused by shadows. Howev-er, despite the acknowledged caveats, numer-ous studies have shown their utility in
assess-ing fire trends at the global scale (Carmo
-na-Moreno et al. 2005; Roy et al. 2005, Giglio et al. 2006b, 2009; Roy and Boschetti 2009; Mouillot et al. 2014), the regional scale (Roy and Boschetti 2009, Pricope and Binford 2012, Tsela et al. 2014), and in the tropical Andes (Armenteras-Pascual et al. 2011, Meri-no-de-Miguel et al. 2011, Román-Cuesta et al. 2014).
Fire Data Analysis Methods
Our fire datasets included 558 images from the MODIS Active Fire product (.hdf files) and
312 images from the MODIS Burned Area product (Geotiff = Georeferenced Tagged Im-age File Format).
Creating data subsets. We used ERDAS Imagine® (Hexagon Geospatial, Madison, Ala-bama, USA) to clip the data into area of inter-est using its Create Subset Tool. We created two subsets using the MODIS Active Fire data (MYD14A2): HNP boundary and HNP BZ
boundary. Similarly, using ArcGIS® 10.2 (ESRI, Redlands, California, USA), we clipped the MODIS Burned Area data with the HNP boundary and HNP BZ boundary. The HNP contained only pixels in the park area, while the initial BZ boundary contained pixels from the Park area and the BZ.
Building attribute tables for MODIS Active Fire products. We created attribute tables for
each of the new subsets of the Imagine files (.img files) using a batch implementation of
the Build Raster Attribute Tables in ArcGIS 10.2 ArcToolbox. This operation attached a .
vatdbf file to each of the raster images. The
.vatdbf table simply erases all of the values that are equal to zero and displays a condensed cell value table of the raster image. The
MO-DIS Active Fire products contain an active fire mask that identifies fires and other relevant
pixels (e.g., cloud). In it, individual 1 km pix-els are assigned one of nine classes (Giglio
2010). A value of 7 to 9 indicates fire occur
-rence and the level of confidence at which it
occurs (Giglio 2010).
MODIS Active Fire product geoprocessing method. To avoid manually viewing the attri-bute table for each image and typing the three
fire cell values into another spread sheet, a
geoprocessing model was created using Arc-GIS® Model Builder to automate this process.
Data Data type Data source time spanData resolutionSpatial resolutionTemporal
Fir
e pr
oducts
MODIS active
fires (MYD14A2)
Level 3
Reverb: https://reverb.echo.nasa.gov (Justice et al. 2002, Morisette et al. 2005, Giglio et al. 2006a)
Jan 2002 to Dec 2014
1 km × 1 km
8-day composite MODIS burned
area (MCD45A1) Level 3
Reverb: https://reverb.echo.nasa.gov (Roy et al. 2008, Roy and Boschetti 2009, Boschetti et al. 2013)
Jan 2002 to
Dec2014 500 m Monthly
Climate data
Temperature (°C) Precipitation (mm)
Simone Schauwecker (Meteodat GmbH, University of Zürich, Switzerland) and National Meteorological and Hydrological Service of Peru. Recuay Station (3404 m)
Jan 2002 to
Dec 2012 Local Monthly
The geoprocessing model counted the three
fire cell values (7, 8, and 9) and extracted the
Julian calendar date associated with each
im-age file name and attached it to the output ta
-ble. This allowed the temporal data for each
file to be maintained. The final product was a
table including the meaningful cell value counts with their Julian date attached. We ran this model on each of the two data subsets and hence subtracted the HNP values from the BZ
values to get the actual number of fire cells oc
-curring in the BZ. Until this point, the BZ val-ues had included the HNP valval-ues. Once the HNP values were subtracted, counts for the BZ and the HNP were independently available and could be used to observe and compare their individual trends.
MODIS Burned Area product geoprocess-ing method. A Geotiff version of the MCD45 burned area product is derived from the stan-dard MCD45A1 .hdf version by University of Maryland (Boschetti et al. 2013). This prod-uct does not include any overlap between con-secutive months and gives information regard-ing year and Julian day, spatial extent (Win05 and Win 06 for our study area) and quality as-sessment (Burned Area pixel Quality
Assess-ment) of the burned area (recent fires only) for
each pixel with information on detection
con-fidence (1 = most confident, 4 = least confi
-dent). Likewise, the geoprocessing model counted the burned area pixel values in each attribute table of the data and created a new dataset for each. The model also extracted the
Julian date, by year, for each burned area file
-name and added it to the attribute table as a
field.
For both the Burned Area and Active Fire
products, we added a “season” field to the total
burned pixel attribute table or the cell value counts table to assess the seasonality of burn-ing. We aggregated the seasons as follow: summer (DJF), fall (MAM), winter (JJA), and spring (SON). The dry season (fall and
win-ter) usually runs from April to September, and the wet season occurs during the spring and summer (October to March) and peaks be-tween February and March.
We estimated standardized active fire
anomalies and standardized burned area anom-alies over the period 2002 to 2014 by modify-ing the equation created by Román-Cuesta et al. (2014):
, (1)
where A is the annual or monthly active fire or
burned area anomaly, P is the active fire or
burned area pixel count, M is the active fire or
burned area mean pixel count, t represents each year or each month, j represents each
ac-tive fire or burned area, and σ is the standard deviation of active fire or burned area.
The standardized fire anomalies were cal
-culated based on the mean for the CB and on the mean for each area separately (HNP and BZ).
Climate Data
Monthly air temperature and precipitation data for the base station of Recuay (3404 m) were provided by Simone Schauwecker (Me-teodat GmbH, University of Zürich, Switzer-land) to analyze climate variability in the CB over the period 2002 to 2013. Schauwecker et al. (2014) used a unique dataset from the Na-tional Meteorological and Hydrological Ser-vice of Peru to assess climate trends and gla-cier retreat in the Cordillera Blanca since the 1960s.
We used the Spearman’s rank correlation
coefficient to test the relationship between
monthly temperature and precipitation data
and fire activity from 2002 to 2013. We fo
-cused on the fire season (dry season) and fire
months (April to September) and conducted correlation analyses to temperature and
precip-���� � ���� � �σ �
itation data. Our first analysis included all of
the months from April to September (i.e.,
months with fire and months without fire).
Our second analysis included only the months
showing fire activity (i.e., months with fire
only).
RESULTS
Fire Occurrence, Seasonality, and Spatial Distribution from 2002 to 2014
The annual standardized active fire and
burned area anomalies for the HNP and the BZ datasets indicated a marked cyclicity, with
high fire activity years in 2003, 2005, 2010, 2012, and 2014, and low fire activity years in
2002, 2004, 2006, 2007, 2008, 2009, 2011,
and 2013 (Figures 2 and 3). The active fire
anomalies based on the mean for the CB and the mean per area showed a consistent higher
fire activity in the HNP over the period 2002
to 2014 except in the years 2008, 2011, and 2014 (Figure 2). Our results for the burned area anomalies based on the mean for the CB
showed a consistently higher fire activity in the BZ during the high fire years in 2003,
2005, 2010, and 2014. However, the burned
area fire anomalies based on the mean per area
had a more complex pattern over the period (Figure 3). The monthly standardized active
fire and burned area anomalies aligned well
and showed a marked seasonal cyclicity, with
higher fire activity during the dry season (JJA;
Figure 4).
-1.50 -1.00 -0.50 0.00 0.50 1.00 1.50 2.00
2002 2003 2004 2005 2006 2007 2008 2009 2010 2011 2012 2013 2014
S
tandar
di
zed
ac
tiv
e
fir
e
anom
al
y
Year
HNP (mean CB) BZ (mean CB) HNP (mean HNP) BZ (mean BZ)
Figure 2. Standardized annual active fire anomalies for the Huascarán National Park (HNP) and the buf
The intra-annual distribution of fires in the
HNP and the BZ showed a consistent peak in
the number of active fires (fire counts), with
nominal-confidence fire value 8 and high-con
-fidence fire value 9, during the Peruvian winter
and the early spring (dry season; Figure 5a). As expected, results from the burned area product aligned well with the results from the
active fire dataset. The majority of burned
pixels occurred between Julian days 185 and 290; the season with the most burned pixels was winter, with spring being the next highest (Figure 5b).
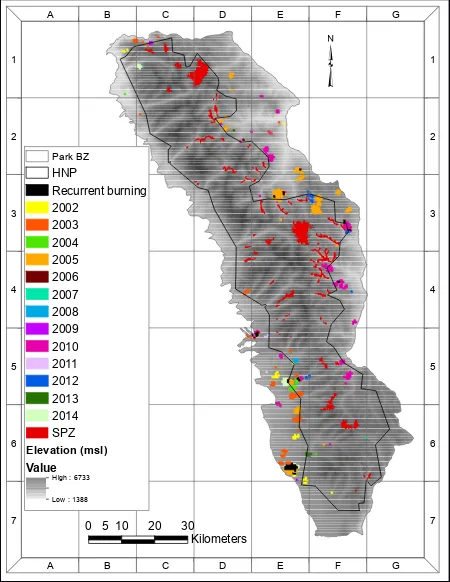
The spatial distribution of areas burned for the HNP and the BZ from 2002 to 2014 showed the pattern of most recurrent burning inside the BZ, which is in compliance with the HNP policy (Figure 6) but in contradiction
with the local resource managers’ observations
(Table 2). We found a low fire return interval
for any given location as few areas burned more than once during our study time period (Figure 6, grid map E2, E3, E5, E6, F3, and F4). Over the decade, six areas reburned in
the following peak fire years: E3 (2005, 2010,
and 2014), E5 top left (2003 and 2010), E5 bottom right (2005 and 2014), E6 (2003, 2005, and 2014), F3 (2005, 2010, and 2012), and F4 (2010 and 2014).
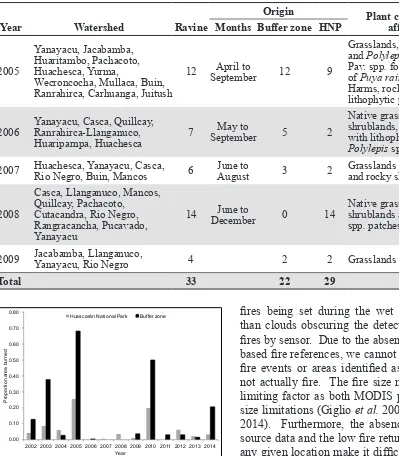
Finally, our analysis also showed that, most years, the BZ experiences more area burned than the HNP (Figure 7). If we sub-tract the glaciated and lake areas (52 762 ha, ANA 2014), between 23 ha and 1363 ha burn (0.14 %) on an annual basis inside the HNP (287 238 ha without snow, ice, and lakes), and
-1.00 -0.50 0.00 0.50 1.00 1.50 2.00 2.50 3.00 3.50 4.00
2002 2003 2004 2005 2006 2007 2008 2009 2010 2011 2012 2013 2014
S
tandar
di
zed annual
bur
ned ar
ea
anom
al
y
Year
HNP (mean CB) BZ (mean CB) HNP (mean HNP) BZ (mean BZ)
Figure 3. Standardized annual burned area anomalies for the Huascarán National Park (HNP) and the
-1.00 0.00 1.00 2.00 3.00 4.00 5.00 6.00 7.00 8.00
Jan
-02
Jul
-02
Jan
-03
Jul
-03
Jan
-04
Jul
-04
Jan
-05
Jul
-05
Jan
-06
Jul
-06
Jan
-07
Jul
-07
Jan
-08
Jul
-08
Jan
-09
Jul
-09
Jan
-10
Jul
-10
Jan
-11
Jul
-11
Jan
-12
Jul
-12
Jan
-13
Jul
-13
Jan
-14
Jul
-14
S
tandar
di
zed anom
al
y
Month
Burned area Active fire
Figure 4. Standardized monthly active fire (solid line) and burned area (dashed line) anomalies from
2002 to 2014, HNP and BZ, Cordillera Blanca, Peru.
between 23 ha and 3646 ha (0.42 %) inside the BZ (248 638 ha) (Figure 7). The proportion of the total area burned between 2002 and 2014 for both the HNP and the BZ (total CB) was 0.81 % and 2.03 %, respectively.
Effects of Local Climate Variability on Fire Activity during the Dry Season
Our first correlation analysis showed a sig
-nificant negative relationship between tem
-perature and active fire data (Figure 8a). Cor
-relation analyses to determine if precipitation
had a major influence on fire activity during
the dry season showed significant negative re
-lationships between precipitation and burned areas (Figure 8b), as well as between
precipi-tation and active fire (Figure 8c). To test if
only months in which fire occurred (mostly
July to September) responded better to local climate variability during the dry season, we ran a second correlation analysis. Our results
showed no significant relationship between climate data and fire activity.
DISCUSSION
Fire Trends in Huascarán National Park and Buffer Zone
Overall, the analysis of the active fire and
burned area anomalies for the period 2002 to 2014 for the HNP and the BZ shows a
consis-tent pattern in fire occurrence and seasonality with peak fire activity during the Peruvian
be-Figure 5. Fire seasonality in the Huascarán National Park and buffer zone, Peru. (A) Number of pixels of
active fires by date, season and confidence level (7, 8, and 9); and (B) number of burned area product pix
-els by date and season (confidence lev-els 1 to 4). A black diamond (♦) represents one burned area product
pixel. 0 5 10 15 20 25 30 35 40 45 50
0 50 100 150 200 250 300 350
N
um
ber
of
pi
xel
s
of
ac
tiv
e
fir
e
Julian day of burning Low-confidence fire (7) HNP
Nominal-confidence fire (8) HNP Nominal-confidence fire (8) BZ High-confidence fire (9) HNP High-confidence fire (9) BZ
Summer Fall Winter Spring
0 5 10 15 20 25
0 50 100 150 200 250 300 350
N
um
ber
of
bur
ned ar
ea
pr
oduc
t pi
xel
s
Julian day of burning
Summer Fall Winter Spring
A
tween July and September. These results are
consistent with other findings in South Ameri
-ca (Carmona-Moreno et al. 2005) and the trop-ical Andes (Bradley and Millington 2006, Ar-menteras-Pascual et al. 2010, Román-Cuesta et al. 2014). The active fire anomalies show a consistent higher fire activity in the HNP over
the period 2002to 2014. However, our results concerning the burned area anomalies show a
consistently higher fire activity in the BZ during the high fire years in 2003, 2005, 2010,
and 2014. The spatial distribution of areas burned between 2002 and 2014 shows the pat-tern of most recurrent burning was inside the BZ, which is in compliance with the HNP’s policy but in contradiction with local resource managers’ perceptions. However, some of the areas that burned between 2002 and 2014 were located close to the Park’s Strict Protection Zones (SPZ; Figure 6, grid map C1, E3, E5, F3, F4 and F5). In the HNP, the areas zoned for strict protection are spaces in which the ecosystems have been largely or completely undisturbed, or include unique, rare, or fragile species or ecosystems that must be protected
from outside influences and require original
environmental quality and characteristics for survival. The only activities allowed in these zones are management and environmental monitoring, and, under certain circumstances,
scientific research (SERNANP 2010). The
SPZs cover 4.76 % of the HNP total area. The
increase in fire occurrence and the marked sea
-sonality during the Peruvian winter are
proba-bly related to fire use. Wildfires that affect for
-ests, native vegetation, and habitats typically
begin when herders set fire to grasslands at the
end of the dry season to fertilize and promote growth for the following grazing season (Sarmiento and Frolich 2002). The vegetation is dry and extremely sensitive to ignition, and
these fires can spread rapidly. Most fires in the
tropical Andes are human induced (Román-Cuesta et al. 2003, Manta-Nolasco and León 2004, Bradley and Millington 2006, Manta-Nolasco et al. 2010, Román-Cuesta et
A A B B C C D D E E F F G G 7 7 6 6 5 5 4 4 3 3 2 2
1
³
10 510 20 30 Kilometers Park BZ HNP Recurrent burning 2002 2003 2004 2005 2006 2007 2008 2009 2010 2011 2012 2013 2014 SPZ Elevation (msl) Value
High : 6733
Low : 1388
Figure 6. Total area burned annually and recurrent
burning in the Huascarán National Park and buffer zone, Peru, from 2002 to 2014 based on MODIS MCD45A1 product. The outline of the Digital El-evation Model Clip represents the BZ boundary. The interior line is the boundary of the Huascarán National Park. Few areas burned more than once during our study time period (grid map E2, E3, E5, E6, F3, and F4). Over the decade, six areas
re-burned in the following peak fire years: E3 (2005,
2010, and 2014), E5 top left (2003 and 2010), E5 bottom right (2005 and 2014), E6 (2003, 2005, and 2014), F3 (2005, 2010, and 2012), and F4 (2010 and 2014). Sources: Huascarán National Park and
buffer zone shapefiles (SERNANP 2014), Strict
al. 2011) and natural ignition may frequently be limited to the rainy season (Young 2009). In Peru and Bolivia, Bradley and Millington (2006) found that the coincidence of persistent
cloud cover and low fire occurrences most
likely corresponds with the low probability of
fires being set during the wet season rather
than clouds obscuring the detection of active
fires by sensor. Due to the absence of ground-based fire references, we cannot report missed fire events or areas identified as fire that are not actually fire. The fire size may also be a
limiting factor as both MODIS products have size limitations (Giglio et al. 2009, Tsela et al. 2014). Furthermore, the absence of ignition
source data and the low fire return interval for any given location make it difficult to confirm that the fires are human induced, even if some
clusters suggest otherwise (Figure 6). Román-Cuesta et al. (2014) followed up major
fire event locations in the Puna and Paramo
over a nine-year period and concluded that,
while fire cycles of 4 yr to 6 yr might occur,
they are unlikely to correspond to the repeated burning of the same locations. They also con-cluded that fuel build-up effects exist but should be larger than 9 yr to 12 yr. Although
human activity may locally influence fire dy
-Year Watershed Ravine
Origin Plant community
affected Months Buffer zone HNP
2005
Yanayacu, Jacabamba, Huaritambo, Pachacoto, Huachesca, Yurma,
Wecroncocha, Mullaca, Buin, Ranrahirca, Carhuanga, Juitush
12 SeptemberApril to 12 9
Grasslands, shrublands and Polylepis Ruiz & Pav.spp. forests, patches of Puya raimondii
Harms, rocky slopes with lithophytic plants
2006 Yanayacu, Casca, Quillcay, Ranrahirca-Llanganuco,
Huariparnpa, Huachesca 7
May to
September 5 2
Native grasslands, shrublands, rocky slopes with lithophytic plants,
Polylepis spp. patches 2007 Huachesca, Yanayacu, Casca, Rio Negro, Buin, Mancos 6 AugustJune to 3 2 Grasslands and shrublands and rocky slopes
2008
Casca, Llanganuco, Mancos, Quillcay, Pachacoto,
Cutacandra, Rio Negro, Rangracancha, Pucavado, Yanayacu
14 DecemberJune to 0 14 Native grasslands, shrublands and Polylepis
spp. patches
2009 Jacabamba, Llanganuco, Yanayacu, Rio Negro 4 2 2 Grasslands and shrublands
Total 33 22 29
Table 2. Number of forest fires in ravines in the buffer zone and the Huascarán National Park between
2005 and 2009. (Data source: translated and modified from SERNANP 2010).
0.00 0.10 0.20 0.30 0.40 0.50 0.60 0.70 0.80
2002 2003 2004 2005 2006 2007 2008 2009 2010 2011 2012 2013 2014
P
ropor
tion
ar
ea
bur
ned
Year
Huascarán National Park Buffer zone
Figure 7. Proportion of areas burned in the HNP
namics, Román-Cuesta et al. (2014) found that
the synchrony and cyclicity of fire responses
in the high tropical Andes were mainly influ
-enced by regional climate.
Fire Response to Local Climate Variability
Numerous studies have reported
connec-tions between climate fluctuaconnec-tions and the spa
-tial and temporal behavior in fire activity in
South America (Román-Cuesta et al.2003, Carmona-Moreno et al. 2005, Bradley and Millington 2006, Armenteras-Pascual et al. 2011). In Peru, Román-Cuesta et al. (2014)
found that Climate clearly influenced fire ac
-tivity. The confounding factor seems to be the sawtooth pattern of precipitation, which led to
an increase of rainfall before the peak fire sea
-sons, followed by drought and unusual low
temperature during the fire peak years. Our
results align well with their findings and sug
-gest that there is a clear fire response to local
climate, and particularly to precipitation vari-ability during the dry season. Román-Cuesta et al. (2014) suggested that several particular combinations of temperature and precipitation in the year of the peak and the year
immediate-ly before clearimmediate-ly influenced fire activity in the
tropical Andes.
CONCLUSION
While fires continue to be an active part of
the ecosystem in the CB, their actual environ-mental impact is less than the impact currently perceived by local land managers. This is a function of both their proximity to SPZs with-in the Park and, conversely, to areas highly frequented by tourists. In both cases, Park personnel must address the perception gap and better educate tourists, local herders, and other stakeholder groups. More research is needed to determine the true ecological impact of
win-ter fires on the landscape versus the historical summer fire regime. This would improve Park
fire management planning and inform respons
-Figure 8. Scatter plots of (a) number of monthly
pixels of active fires versus mean monthly tem
-perature, (b) number of monthly burned area prod-uct pixels versus mean monthly precipitation, and
(c) number of monthly pixels of active fires versus
mean monthly precipitation. Dry season, April to
September, including months with fire and months
without fire. Spearman’s rank correlation (rs),
P-values, and df are given for each set of points.
0 20 40 60 80 100 120
0 20 40 60 80 100 120
N um be r o f b ur ne d a re a pr od uc t p ix el s Precipitation (mm)
rs= −0.312
P= 0.021 df = 52
0 10 20 30 40 50 60 70 80 90 100
0 20 40 60 80 100 120 140
Nu mb er o f p ix el s o f a ct iv e f ire Precipitation (mm)
rs= −0.577
P< 0.001 df = 64 0 10 20 30 40 50 60 70 80 90 100
11 11.5 12 12.5 13 13.5 14
Nu mb er o f p ix el s o f a ct iv e f ire Temperature (°C)
rs= −0.352
P= 0.003 df = 64 A
B
es. Other potential areas of future study
in-clude the fire patterns at higher elevations that
are proximate to formerly glaciated areas of the Park. Another critical area of research will
be to compare vegetation cover data to fire be
-havior data to examine both vegetation cover
impacts on fire frequency and area burned as well as fire impacts on land cover changes
over time. Finally, while we have
demonstrat-ed that there is a significant climate component
to fire behavior in the HNP, the short period of
record and the high spatial heterogeneity of the
landscape and both fire and meteorological patterns require a finer scale, on-the-ground
analysis. However, in the HNP, with the active participation of Park personnel, the research presented here can inform resource manage-ment and lead to more effective biodiversity and conservation outcomes.
ACKNOWLEDGEMENTS
This project is part of a larger research program studying the effects of climate and anthropo-genic changes in alpine environments in Peru and Nepal founded by USAID. We would like to thank S. Schauwecker and the National Meteorological and Hydrological Service of Peru for kindly providing us with climate data. For comments and suggestions on earlier drafts, we would like to thank S. Schauwecker and M. Vuille and several anonymous reviewers.
LITERATURE CITED
ANA [Autoridad National del Agua]. 2014. Inventario de glaciares del Perú (2DA actualización), Huaraz. <http://ponce.sdsu.edu/INVENTARIO_GLACIARES_ANA.pdf>. Accessed 26 Au-gust 2016. [In Spanish.]
Armenteras-Pascual, D., J. Retana-Alumbreros, R. Molowny-Horas, R.M. Román-Cuesta, F.
Gonzalez-Alonso, and M. Morales-Rivas. 2011. Characterizing fire spatial pattern interac
-tions with climate and vegetation in Colombia. Agricultural and Forest Meteorology 151: 279–289. doi: 10.1016/j.agrformet.2010.11.002
Boschetti, L., D. Roy, A.A. Hoffmann, and M. Humber. 2013. MODIS collection 5.1. Burned
area product—MCD45 user’s guide version 3.0.1. <http://modis-fire.umd.edu/files/MODIS_
Burned_Area_Collection51_User_Guide_3.0.pdf>. Accessed 18 November 2014.
Bowman, D.M.J.S., J. Balch, P. Artaxo, W.J. Bond, M.A. Cochrane, C.M. D’Antonio, R. DeFries, F.H. Johnston, J.E. Keeley, M.A. Krawchuk, C.A. Kull, M. Mack, M.A. Moritz, S. Pyne, C.I.
Roos, and A.C. Scott. 2011. The human dimension of fire regimes. Journal of Biogeography
38: 2223–2236. doi: 10.1111/j.1365-2699.2011.02595.x
Bradley, A.V., and A.C. Millington. 2006. Spatial and temporal scale issues in determining bio-mass burning regimes in Bolivia and Peru. International Journal of Remote Sensing 27: 2221–2253. doi: 10.1080/01431160500396550
Burns, P., and A. Nolin. 2014. Using atmospherically-corrected Landsat imagery to measure gla-cier area change in the Cordillera Blanca, Peru from 1987 to 2010. Remote Sensing of Envi-ronment 140: 165–178. doi: 10.1016/j.rse.2013.08.026
Byers, A.C. 2000. Contemporary landscape change in the Huascarán National Park and buffer zone, Cordillera Blanca, Peru. Mountain Research and Development 20(1): 52–63. doi: 10.1659/0276-4741(2000)020[0052:CLCITH]2.0.CO;2
Carmona-Moreno, C., A. Belward, J.-P. Malingreau, A. Hartley, M. Garcia-Alegre, M.L. Anton-ovskiy, V. Buschshtaber, and V. Pivovarov. 2005. Characterizing interannual variations in
global fire calendar using data from Earth observing satellites. Global Change Biology 11:
1527–1555. doi: 10.1111/j.1365-2486.2005.001003.x
Chepstow-Lusty, A.J., K.D. Bennett, J. Fjelda, A. Kendall, W. Galiano, and A. Tupayachi Herre-ra. 1998. Tracing 4,000 years of environmental history in the Cuzco area, Peru, from the pollen record. Mountain Research and Development 18: 159–172. doi: 10.2307/3673971
Cochrane, M.A., and W.F. Laurance. 2008. Synergisms among fire, land use, and climate change
in the Amazon. Ambio 37: 522–527. doi: 10.1579/0044-7447-37.7.522
DiPasquale, G., M. Marziano, S. Impagliazzo, C. Lubritto, A. de Natale, and M.Y. Bader. 2008.
The Holocene treeline in the northern Andes (Ecuador): first evidence from soil charcoal. Pa
-laeogeography, Palaeoclimatology, Palaeoecology 259: 17–34. doi: 10.1016/j.palaeo. 2006.12.016
Garreaud, R.D. 1999. Multiscale analysis of the summertime precipitation over the central An-des. Monthly Weather Review 127: 901–921. doi: 10.1175/1520-0493(1999)127<0901: MAOTSP>2.0.CO;2
Garreaud, R.D., M. Vuille, R. Compagnucci, and J. Marengo. 2009. Present-day South America climate. Paleogeography, Paleoclimatology, Paleoecology 281: 180–195. doi: 10.1016/j. palaeo.2007.10.032
Giglio, L. 2010. MODIS collection 5 active fire product user’s guide version 2.4. Science Sys
-tems and Applications, Inc. University of Maryland, Department of Geography.
<http://mo-dis-fire.umd.edu/files/MODIS_Burned_Area_Collection51_User_Guide_3.0.pdf>. Accessed
18 November 2014.
Giglio, L., T. Loboda, D.P. Roy, B. Quayle, and C.O. Justice. 2009. An active-fire based burned
area mapping algorithm for the MODIS sensor. Remote Sensing of Environment 113: 408– 420. doi: 10.1016/j.rse.2008.10.006
Giglio, L., I. Csiszar, and C.O. Justice. 2006a. Global distribution and seasonality of active fires
as observed with the Terra and Aqua MODIS sensors. Journal of Geophysical Research— Biogeosciences 111: G02016. doi: 10.1029/2005JG000142
Giglio, L., G.R. van der Werf, J.T. Randerson, G.J. Collatz, and P. Kasibhatla. 2006b. Global
es-timation of burned area using MODIS active fire observations. Atmospheric Chemistry and
Physics 6: 957–974. doi: 10.5194/acp-6-957-2006
Hewitson, B., A.C. Janetos, T.R. Carter, F. Giorgi, R.G. Jones, W.T. Kwon, L.O. Mearns, E.L.F. Schipper, and M. van Aalst. 2014. Regional context. Pages 1133–1197 in: V.R. Barros, C.B. Field, D.J. Dokken, M.D. Mastrandrea, K.J. Mach, T.E. Bilir, M. Chatterjee, K.L. Ebi, Y.O. Estrada, R.C. Genova, B. Girma, E.S. Kissel, A.N. Levy, S. MacCracken, P.R. Mastrandrea, and L.L. White, editors. Climate change 2014: impacts, adaptation, and vulnerability. Part B: regional aspects. Contribution of Working Group II to the Fifth Assessment Report of the In-tergovernmental Panel on Climate Change. Cambridge University Press, Cambridge, En-gland, United Kingdom.
Justice, C.O., L. Giglio, S. Korontzi, J. Owens, J.T. Morisette, D.P. Roy, J. Descloitres, S.
Alleau-me, F. Petitcolin, and Y. Kaufman. 2002. The MODIS fire products. Remote Sensing of En
Kaser, G., A. Ames, and M. Zamora. 1990. Glacier fluctuations and climate in the Cordillera
Blanca, Peru. Annals of Glaciology 14: 136–140. doi: 10.1017/S0260305500008430
Kaser, G., and C. Georges. 1997. Changes of the equilibrium-line altitude in the tropical Cordil-lera Blanca, Peru, 1930–50, and their spatial variations. Annals of Glaciology 24: 344–349. doi: 10.1017/S0260305500012428
Manta Nolesco, M.I., and H. León. 2004. Los incendios forestales en el Perú: grave problema por resolver. Floresta 34: 179–186. [In Spanish.]
Manta Nolesco, M.I., M. Rozas, and M. Loayza. 2010. Evaluación de los incendios forestales en las areas naturales protegidas por el estados peruano. <https://www.scribd.com/docu-ment/43687102/Evaluacion-de-los-incendios-forestales-en-las-areas-protegidas-en-el-Peru>. Accessed 21 May 2014. [In Spanish.]
Marlon, J.R., P.J. Bartlein, M.K. Walsh, S.P. Harrison, K.J. Brown, M.E. Edwards, P.E. Higuera, M.J. Power, R.S. Anderson, C. Briles, A. Brunelle, C. Carcaillet, M. Daniels, F.S. Hu, M. La-voie, C. Long, T. Minckley, P.J.H. Richard, A.C. Scott, D.S. Shafer, W. Tinner, C.E.
Umban-howar Jr., and C. Whitlock. 2009. Wildfire responses to abrupt climate change in North
America. Proceedings of the National Academy of Sciences USA 106: 2519–2524. doi: 10.1073/pnas.0808212106
Matson, M., and J. Dozier. 1981. Identification of subresolution high temperature sources using
a thermal IR sensor. Photogrammetric Engineering and Remote Sensing 47: 1311–1318. Merino-de-Miguel, S., F. González-Alonso, M. Huesca, D. Armenteras, and C. Franco. 2011.
MODIS reflectance and active fire data for burn mapping in Colombia. Earth Interactions 15:
1–17. doi: 10.1175/2010EI344.1
Morales-Arnao, B., and S. Hastenrath. 1999. Glaciers of Peru. Pages 151–179 in: R.S. Williams Jr. and J.G. Ferrigno, editors. Satellite image atlas of glaciers of the world. US Geological Survey Professional Paper 1386-I-4, US Department of the Interior, United States
Govern-ment Printing Office, Washington, D.C., USA.
Morisette, J.T., L. Giglio, I. Csiszar, A. Setzer, W. Schroeder, D. Morton, and C.O. Justice. 2005.
Validation of MODIS active fire detection products derived from two algorithms. Earth Inter
-actions 9: 1–23. doi: 10.1175/EI141.1
Mouillot, F., M.G. Schultz, C. Yue, P. Cadule, K. Tansey, P. Ciais, and E. Chuvieco. 2014. Ten years of global burned area products from spaceborne remote sensing—a review: analysis of user needs and recommendations for future developments. International Journal of Applied Earth Observation and Geoinformation 26: 64–79. doi: 10.1016/j.jag.2013.05.014
Paduano, G.M., M.B. Bush, P.A. Baker, S.C. Fritz, and G.O. Seltzer. 2003. A vegetation and fire
history of Lake Titicaca since the last glacial maximum. Palaeogeography, Palaeoclimatolo-gy, Palaeoecology 194: 259–279. doi: 10.1016/S0031-0182(03)00281-5
Pidwirny, M. 2011. Köppen Climate Classification System. <https://www.slideshare.net/Kel
-laRandolph/koppen-classification-system>. Accessed 20 June 2014.
Power, M.J., J. Marlon, N. Ortiz, J. Bartlein, S.P. Harrison, E. Mayle, A. Ballouche, R.H.W. Brad-shaw, C. Carcaillet, C. Cordova, S. Mooney, P.I. Moreno, C. Prentice, K. Thonicke, W. Tin-ner, C. Whitlock, Y. Zhang, Y. Zhao, A.A. Ali, R.S. Anderson, R. Beer, H. Behling, C. Briles, K.J. Brown, A. Brunelle, M. Bush, P. Camill, G.Q. Chu, J. Clark, D. Colombaroli, S. Connor, A.-L. Daniau, M. Daniels, J. Dodson, E. Doughty, M.E. Edwards, W. Finsinger, D. Foster, J. Frechette, M.-J. Gaillard, D.G. Gavin, E. Gobet, S. Haberle, D.J. Hallett, P. Higuera, G. Hope, S. Horn, J. Inoue, P. Kaltenrieder, L. Kennedy, Z.C. Kong, C. Larsen, C.J. Long, J. Lynch, A. Lynch, M. McGlone, S. Meeks, S. Mensing, E.G. Meyer, T. Minckley, J.P. Mohr, D.M. Nel-son, J. New, R. Newnham, R. Noti, W. Oswald, J. Pierce, P.J.H. Richard, C. Rowe, M.F. San-chez, Goñi, B.N. Shuman, H. Takahara, J. Toney, C. Turney, D.H. Urrego-SanSan-chez, C. Um-banhowar, M. Vandergoes, B. Vanniere, E. Vescovi, M. Walsh, X. Wang, N. Williams, J.
Wilmshurst, and J.H. Zhang. 2008. Changes in fire regimes since the Last Glacial Maxi
-mum: an assessment based on a global synthesis and analysis of charcoal data. Climate Dy-namics 30: 887–907. doi: 10.1007/s00382-007-0334-x
Pricope, N.G., and M.W. Binford. 2012. A spatio-temporal analysis of fire recurrence and extent
for semi-arid savanna ecosystems in southern Africa using moderate-resolution satellite imag-ery. Journal of Environmental Management 100: 72–85. doi: 10.1016/j.jenvman.2012.01.024 Rabatel, A., B. Francou, A. Soruco, J. Gomez, B. Cáceres, J.L. Ceballos, R. Basantes, M. Vuille,
J.E. Sicart, C. Huggel, M. Scheel, Y. Lejeune, Y. Arnaud, M. Collet, T. Condom, G. Consoli, V. Favier, V. Jomelli, R. Galarraga, P. Ginot, L. Maisincho, J. Mendoza, M. Ménégoz, E. Ramirez, P. Ribstein, W. Suarez, M. Villacis, and P. Wagnon. 2013. Current state of glaciers in the tropical Andes: a multi-century perspective on glacier evolution and climate change. The Cryosphere 7: 81–102. doi: 10.5194/tc-7-81-2013
Racoviteanu, A.E., Y. Arnaud, M.W. Williams, and J. Ordonez. 2008. Decadal changes in glacier parameters in the Cordillera Blanca, Peru, derived from remote sensing. Journal of Glaciolo-gy 54: 499–510. doi: 10.3189/002214308785836922
Román-Cuesta, R.M., M. Gracia, and J. Retana. 2003. Environmental and human factors influ
-encing fire trends in ENSO and non-ENSO years in tropical Mexico. Ecological Applications
13: 1177–1192. doi: 10.1890/1051-0761(2003)13[1177:EAHFIF]2.0.CO;2
Román-Cuesta, R.M., J. Retana, and M. Gracia. 2004. Fire trends in tropical Mexico—a case study of Chiapas. Journal of Forestry 102(1): 26–32.
Román-Cuesta, R.M., N. Salinas, H. Asbjornsen, I. Oliveras, V. Huaman, Y. Gutiérrez, L. Puelles, J. Kala, D. Yabar, M. Rojas, R. Astete, D.Y. Jordán, M. Silman, R. Mosandl, M. Weber, B.
Stimm, S. Günter, T. Knoke, and Y. Malhi. 2011. Implications of fires on carbon budgets in
Andean cloud montane forest: the importance of peat soils and tree resprouting. Forest Ecol-ogy and Management 261(11) 1987–1997. doi: 10.1016/j.foreco.2011.02.025
Román-Cuesta, R.M., C. Carmona-Moreno, G. Lizcano, M. New, M. Silman, T. Knoke, Y. Malhi,
I. Oliveras, H. Asbjornsen, and M. Vuille. 2014. Synchronous fire activity in the tropical
high Andes: an indication of regional climate forcing. Global Change Biology 20: 1929– 1942. doi: 10.1111/gcb.12538
Roy, D.P., P.E. Lewis, and C.O. Justice. 2002. Burned area mapping using multi-temporal
mod-erate spatial resolution data—a bi-directional reflectance model-based expectation approach.
Remote Sensing of Environment 83: 263–286. doi: 10.1016/S0034-4257(02)00077-9
Roy, D.P., Y. Jin, P.E. Lewis, and C.O. Justice. 2005. Prototyping a global algorithm for
system-atic fire-affected area mapping using MODIS time series data. Remote Sensing of Environ
Roy, D.P., L. Boschetti, C.O. Justice, and J. Ju. 2008. The collection 5 MODIS burned area
product—global evaluation by comparison with the MODIS active fire product. Remote
Sensing of Environment 112: 3690–3707. doi: 10.1016/j.rse.2008.05.013
Roy, D.P., and L. Boschetti. 2009. Southern Africa validation of the MODIS, L3JRC and Glob-Carbon burned area products. IEEE Transactions on Geoscience and Remote Sensing 47: 1032–1044.
Sarmiento, F., and L. Frolich. 2002. Andean cloud forest tree lines: naturalness, agriculture and the human dimension. Mountain Research and Development 22: 278–287. doi: 10.1659/0276-4741(2002)022[0278:ACFTL]2.0.CO;2
Schauwecker, S., M. Rohrer, D. Acuña, A. Cochachin, L. Dávila, H. Frey, C. Giráldez, J. Gómez, C. Huggel, M. Jacques-Coper, E. Loarte, N. Salzmann, and M. Vuille. 2014. Climate trends and glacier retreat in the Cordillera Blanca, Peru, revisited. Global and Planetary Change 119: 85–97. doi: 10.1016/j.gloplacha.2014.05.005
SERNANP [Servicio Nacional de Áreas Naturales Protegidas por el Estado]. 2010. Plan Mae-stro del Parque Nacional Huascarán 2010–2015. Servicio Nacional de Áreas Naturales Prote-gidas por el Estado, Lima, Peru. [In Spanish.]
SERNANP [Servicio Nacional de Áreas Naturales Protegidas por el Estado]. 2014. Áreas Natu-rales Protegidas—Peru. <http://www.geogpsperu.com/2014/10/areas-natuNatu-rales-protegidas- descargar.htm>. Accessed 4 May 2014. [In Spanish.]
Shoobridge, D. 2005. Protected Area Profile—Peru. Huascáran National Park, Huaraz, Peru.
Silverio, S., and J.M. Jaquet. 2012. Multi-temporal and multi-source cartography of the glacial cover of Nevado Coropuna (Arequipa, Peru) between 1955 and 2003. International Journal of Remote Sensing 33: 5876–5888. doi: 10.1080/01431161.2012.676742
Tsela, P., K. Wessels, J. Botai, S. Archibald, D. Swanepoel, K. Steenkamp, and P. Frost. 2014. Validation of the two standard MODIS satellite burned-area products and an empirically-de-rived merged product in South Africa. Remote Sensing 6: 1275–1293. doi: 10.3390/ rs6021275
UNESCO [United Nations Educational, Scientific, and Cultural Organization]. 2014. World
Heritage List: Huascarán National Park. <http://whc.unesco.org/en/list/333>. Accessed 20 June 2014.
Villota, A., and H. Behling. 2014. Late glacial and Holocene environmental change inferred from the Páramo of Cajanuma in the Podocarpus National Park, southern Ecuador. Caldasia 36: 345–364. doi: 10.15446/caldasia.v36n2.47491
Vuille, M., R. Bradley, M. Werner, and F. Keimig. 2003. 20th century climate change in the tropical Andes: observations and model results. Climatic Change 59: 75–99. doi: 10.1023/A:1024406427519
Vuille, M., B. Francou, P. Wagnon, I. Juen, G. Kaser, B.G., Mark, and R.S., Bradley. 2008a. Cli-mate change and tropical Andean glaciers: past, present and future. Earth-Science Reviews 89: 79–96. doi: 10.1016/j.earscirev.2008.04.002
Weng, C., M.B. Bush, and A.J. Chepstow-Lusty. 2004. Holocene changes of Andean alder (Al-nus acuminata) in highland Ecuador and Peru. Journal of Quaternary Science 19: 685–691. doi: 10.1002/jqs.882
Wolter, K. 1987. The Southern Oscillation in surface circulation and climate over the tropical
Atlantic, eastern Pacific, and Indian oceans as captured by cluster analysis. Journal of Cli
Young, K.R. 2009. Andean land use and biodiversity: humanized landscapes in a time of change. Annals of the Missouri Botanical Garden 96: 492–507. doi: 10.3417/2008035