ORIGINAL ARTICLE
Assessment of Rheological
and Piezoresistive Properties of Graphene based
Cement Composites
Sardar Kashif Ur Rehman
1,6*, Zainah Ibrahim
1*, Mohammad Jameel
2, Shazim Ali Memon
3,
Muhammad Faisal Javed
7, Muhammad Aslam
4, Kashif Mehmood
5and Sohaib Nazar
5Abstract
The concrete production processes including materials mixing, pumping, transportation, injection, pouring, mould-ing and compaction, are dependent on the rheological properties. Hence, in this research, the rheological proper-ties of fresh cement paste with different content of graphene (0.03, 0.05 and 0.10% by weight of cement) were investigated. The parameters considered were test geometries (concentric cylinders and parallel plates), shear rate range (300–0.6, 200–0.6 and 100–0.6 s−1), resting time (0, 30 and 60 min) and superplasticizer dosage (0 and 0.1% by weight of cement). Four rheological prediction models such as Modified Bingham, Herschel–Bulkley, Bingham model and Casson model were chosen for the estimation of the yield stress, plastic viscosity and trend of the flow curves. The effectiveness of these rheological models in predicting the flow properties of cement paste was verified by considering the standard error method. Test results showed that the yield stress and the plastic viscosity increased with the increase in graphene content and resting time while the yield stress and the plastic viscosity decreased with the increase in the dosage of superplasticizer. At higher shear rate range, the yield stress increased while the plastic viscosities decreased. The Herschel–Bulkley model with the lowest average standard error and standard deviation value was found to best fit the experimental data, whereas, Casson model was found to be the most unfitted model. Graphene reduces the flow diameter and electrical resistivity up to 9.3 and 67.8% and enhances load carrying capac-ity and strain up to 16.7 and 70.1% of the composite specimen as compared with plain cement specimen. Moreover, it opened a new dimension for graphene-cement composite as smart sensing building construction material. Keywords: rheological properties, yield stress, graphene nanoplatelets, rheological models, self-sensing, piezoresistive properties
© The Author(s) 2018. This article is distributed under the terms of the Creative Commons Attribution 4.0 International License (http://creat iveco mmons .org/licen ses/by/4.0/), which permits unrestricted use, distribution, and reproduction in any medium, provided you give appropriate credit to the original author(s) and the source, provide a link to the Creative Commons license, and indicate if changes were made.
1 Background
Concrete is the most common building material used globally. The important processes of concrete produc-tion, such as materials mixing, pumping, transportaproduc-tion, injection, pouring, moulding and compaction, are based on the rheology of the materials. It is known that the rhe-ology of cement paste has a strong impact on the prop-erties of the concrete (Ferraris 1999). Various terms like flowability, mobility, workability and pumpability have
been used to explain the rheology of concrete (Tattersall et al. 1983). However, it is generally agreed to define rhe-ology in terms of yield stress and plastic viscosity (Ban-fill 2006). Various theoretical and empirical models have been developed to determine yield stress and plastic vis-cosity, however, these values are greatly dependent on model assumptions, rheometer specifications and accu-racy of experimental data.
With the advancement in nanotechnology, research emphasis has been moved to the effect of nanomaterials on cement composite (Kawashima et al. 2013). For exam-ple, the effect of different nanomaterials on the rheo-logical properties of cement paste is reported by various researchers (Ormsby et al. 2011; Konsta-Gdoutos et al.
Open Access
*Correspondence: kashif@engineersdaily.com
1 Department of Civil Engineering, University of Malaya, 50603 Kuala
Lumpur, Malaysia
2010; Shang et al. 2015; Wang et al. 2016, 2017). Ormsby
et al. (2011) used MWCNTs in cement mix and
investi-gated the rheological properties of composite material using parallel plate geometry and found a meaningful influence on the rheological behaviour of polymerizing cement. Shang et al. (2015) explored the rheological char-acteristics of graphene oxide and graphene oxide encap-sulated silica fume based cement pastes. The authors found that in comparison to plain cement paste, gra-phene oxide reduced the fluidity of the cement paste by 36.2%. Wang et al. (2016) found that addition of graphene oxide in cement paste resulted in flocculated structures. These flocculated structures were depended on the con-tent of graphene oxide and as a result, it enhanced the yield stress, plastic viscosity and area of the hysteresis loop of the flow curve. Wang et al. (2017) determined the influence of fly ash on flow properties of graphene oxide cement paste. They observed that for 0.01% of GO and 20% of fly ash (by weight), the yield stress and plastic viscosity of the cement paste decreased in comparison to control specimen by 85.81% and 5.58%, respectively. Rehman et al. (2018) concluded from his research that viscosity of graphene oxide based cement composite was significantly more as compared with control mix. The same team investigated the rheological properties of cement paste using one mix design, test geometry and various rheological models to determine the flow behaviour of graphene cement composites (Rehman et al.
2017).
Most of the above literature is focused on the per-formance of CNTs and graphene oxide and very lim-ited focus were given for rheological properties of graphene cement paste. The properties of graphene, like Young’s module (~ 1.0 TPa), large specific surface area (2630 m2 g−1), and high electrical transport make it more
valuable than other nanomaterials (Lee et al. 2008). Gra-phene significantly enhanced the mechanical properties of cement based composite and hence the self-weight of structure can be reduced, which will preserve the natu-ral resources (Rehman et al. 2018; Yang et al. 2017). Due to high-early strength and reduced porosity of graphene cement composite, the cost of formwork, maintenance and repair activities dropped significantly (Yang et al.
2017). Furthermore, high thermal conductivity and ultra-strong features of graphene cement composite improved resistance against fire, cyclones and earthquakes (Rehman et al. 2018; Javed et al. 2017b, 2017a; Yang et al.
2017).
Various researchers have also investigated the elec-trical properties of cement based composites incorpo-rated with nanomaterials to detect damages and cracks in the composite specimen. Several non-destructive tests are available for quickly and effectively detection
of damages in concrete (Rehman et al. 2016). However, If cement is reinforced with conducting fillers then it can observe its own strain by monitoring electrical resistivity values (Chung 2002). Sixuan (2012) inves-tigated the effect of crack depth of the graphite nano-platelets based cement mortar on the change in the electrical resistance. It was reported that the electrical resistance of concrete increases with increase in crack depth. The effect of different concentration of graphene nanoplatelets on the self-sensing behaviour of the cementitious composite was studied by Du et al. (2013) and Le et al. (2014). Test results showed that electri-cal resistivity of cement composites decreased with the addition of 2.4–3.6% of graphene. Rehman et al.
(2017) studied the practical application of graphene
cement smart sensor in reinforced concrete beam and concluded that the variation in fractional change in resistance values with the applied load will enable the graphene cement composite to assess the condition of concrete structures.
From the analysis of above literature, it can seen that on the rheological and piezoresistive properties of graphene cement composite is scarce. Hence, in this research, we investigated the flow properties of the graphene cement paste by using four different rheological models. The gra-phene nanoplatelets were utilized to measure the varia-tion in the flow curves of the cement paste. In addivaria-tion, the rheological properties of graphene cement paste with numerous resting time, shear rate range and superplas-ticizer were also evaluated using two test geometries including concentric cylinders and parallel plates. There-after, the self-sensing properties of the graphene nano-platelets based cementitious material were determined. The electrical resistance was measured with the help of four-probe method while self-sensing characteris-tics were observed using damage-sensing and change in resistance.
2 Rheological Models
The workability and flowability of concrete are straight-forwardly influenced by the rheological properties of cement paste. Rheological models are based on the fac-tors, which influence the cement paste rheology. Param-eters like shear rate, chemical admixtures, water-cement ratio and supplementary cementitious materials greatly
influence the rheology of cement paste (Papo 1988).
2.1 Bingham Model
In 1919, Bingham (1922) proposed model named
Bing-ham Model. He was the pioneer to introduce the visco-plastic materials and class of non-Newtonian materials (Mitsoulis 2007). This model requires two parameters, the yield stress (τ0) and plastic viscosity (µp). Yield stress
is the critical value of stress below which material does not flow (Mitsoulis 2007) and plastic viscosity is the slope of the line in shear stress-shear rate curve. This model has characteristics of Newtonian equation and the only difference is yield stress. Mathematical equations for both Newtonian and Bingham models are given in Eqs. (1) and (2), respectively (Ferraris 1999). The Bingham model was highly used by a number of researchers to compute the plastic viscosity and the yield stress of the cement paste (Yahia and Khayat 2001, 2003; Rao 2014). Bingham math-ematical equation is linear as shown in Eq. (2) (Bingham
1922) and, comparatively, it is convenient to use for the analytical solutions (Yahia and Khayat 2003).
where, τ is shear stress (Pa); τ0 is yield shear stress (Pa);
µp is lastic viscosity (Pa·s) and ϔ is hear rate (s−1).
In any case, it falls flat to fit into the nonlinear par-cel of the stream bend at a high shear rate and cannot anticipate abdicating shear stress precisely particularly for shear thickening conduct (Yahia and Khayat 2001). According to Feys et al. (2007), Bingham model underes-timates the shear stress and resulted in the negative yield stress, which was physically impossible. Therefore, this model is not valid to describe the rheological properties, especially in nonlinear portion.
2.2 Herschel–Bulkley (HB) Model
To solve the problem of Bingham model, the nonlinear model can be used. Power equation was frequently used for the liquids to study the rheological behaviour (Fer-raris 1999). However, it is not valid for the visco-plastic materials. In 1926, Herschel–Bulkley (HB) provides the relationship to determine the rheological properties for Bingham materials in nonlinear portion (Herschel and Bulkley 1926). HB equation is the upgraded form of the power model containing both yield stress and power equation. This model contains three parameters: yield shear stress ‘τ0’, power rate index ‘n’ and consistency ‘K’.
n is an important parameter and estimates the degree of fluid for shear thinning and shear thickening. Mathemat-ical representation of both power model and HB model is given in Eqs. (3) and (4) respectively (Ferraris 1999). This model is also known as yield power law because it has
(1)
τ=µpϒ¨
(2)
τ=τ0+µpϒ¨
the characteristics of both Bingham and Power models (Yahia and Khayat 2003), therefore, it offers an advantage over the Bingham and Power law models (Hemphill et al.
1993).
where, K is consistency (Pa·sn) and n is power rate index
or pseudo-plastic index.
HB model can quantify the shear thickening behaviour of the cement paste. If the power rate index (n) value is more than 1, the fluid will present the shear thickening behaviour, whereas, if the value is less than 1, the shear thinning behaviour will be found. As per a study con-ducted by Yahia and Khayat (2001), this model results in the lowest yield stress in shear thinning in contrast to other mathematical models on the same flow data. This discrepancy is due to mathematical formulation. Zero shear viscosity (inclination of flow data curve at zero shear rate), is always either zero or infinite based on power index value. For the shear thickening fluids (n > 1), zero shear velocity is zero and for shear thinning materi-als it is infinite. Thus, this model is not the best model to describe the non-linear behaviour of flow curve (Yahia and Khayat 2001; Feys et al. 2007).
2.3 Modified Bingham Model
To overcome the deficiency of Herschel–Bulkley model, a linear term was added in the HB mathematical equa-tion. This new model is called Modified Bingham model because the Bingham equation was modified and second order of the shear rate was used to measure the pseudo-plastic or shear thickening behaviour. As the modified Bingham model contains the characteristics of Bingham model and HB model, therefore, it can provide a better description of the nonlinear behaviour (Feys et al. 2013). Equation (5) presents the mathematical expression of this model (Yahia and Khayat 2001).
where, c is regression constant.
Although this model has a limitation that fluid should not be highly-shear thickening, it can only be possible by keeping power index value less than 2 (Feys et al. 2013). Therefore, it restrained the response of the fluid to sec-ond order polynomial, which will limit its fitting to the flow data.
2.4 Casson Model
In 1959, Casson (1959), proposed the equation related to shear stress and shear rate for the suspensions. Casson suggested a special structure for the suspension in fluid
(3)
τ=Kϒ¨n
(4)
τ=τ0+Kϒ¨n
(5)
called “particles” combine to form flocculates of certain cohesive strength (Scott Blair 1966). The Casson model has two adjustable parameters a shown in Eq. (6) and it has the capability to estimate the viscosity at a high shear rate (Papo 1988). However, for concentrated suspensions, outcome values by this model are not accurate. (Papo
1988). As per Scott Blair (1966) observations, the Cas-son’s model fits well for the various types of fluid and is more appropriate to be utilized as compared to the HB model, although, sometimes in most cases, it is difficult to judge.
2.5 Standard Error
The capacity of any expository demonstrate to precisely coordinate the nonlinear relapse at high shear rate will characterize its precision. As this capacity is shifting with each scientific expression, in this manner, the calculated rheological parameters offer distinctive values for diverse models. Standard error for each rheological model has
been determined utilizing Eq. (7) (Yahia and Khayat
2001). At last, best fitted and successful demonstrate was determined.
(6)
√
τ=√τ0+
µpϒ¨
(7)
Standard error
=
1000∗
(measured value−calculated value)2
(number of data points−2)
1/2
(Maximum measured value−Minimum measured value)
3 Experimental Methodology 3.1 Materials Used
The ordinary Portland cement (OPC) conforming to
MS-522: Part 1 (2003) (MS-522:) with compressive
strength 48 MPa, specific gravity 3.14, specific surface area 1.89 m2 g−1 was used. A third-generation
polycar-boxylate ether-based superplasticizer Sika ViscoCrete (Sika ViscoCrete®-2055, brown liquid), was used.
Mean-while, graphene was purchased from Graphene Labora-tories, Inc. USA. The properties of graphene are given in Table 1.
3.2 Preparation of Samples
For the preparation of specimen’s, the cement, graphene and deionized water have been used. The designed mix proportions are shown in Table 2. It is noteworthy to mention here that, Mo, GM3, GM5 and GM10 sample was used to study the rheological characteristics. The piezoresistive characteristics of the graphene were only determined for GM3 and M0 specimens. It is impor-tant to mention here that three identical samples were prepared and an average of their reading was used. Ini-tially, graphene nanoplatelets were poured into the water. Ultrasonication (Fisher Scientific™ Model 505 Sonic
Dis-membrator) was used for 3 min, in order to exfoliate nan-oparticles. To keep the dispersion of graphene uniform in solution, magnetic stirring was also performed. Overall time for sonication was set as 3 min followed by 1 h of the magnetic stirring. Afterthat, the cement was added to the mixture and thoroughly mixed for another 5 min in the spar mixer (SP-800A). The speed of the mixer was used to assure the homogeneity of the cement paste. For first 2 min mixer was run at a lower speed then stopped for 10 s. Afterwards, in remaining mixing duration, it was kept high. As soon as the cement paste was ready, the rheological characteristics were measured. ASTM C 1437-15 (ASTM 2015) was used to investigate the work-ability of the prepared cement paste.
Table 1 Properties of the graphene.
Specific surface area, SSA (m2 g−1) 80
Average flake thickness (nm) 12 (30–50 monolayers)
Average particle (lateral) size (nm) ~ 4500 (1500–10,000 nm)
Colour Black
Purity 99.2%
Table 2 Mix proportions.
Mix design W/C ratio Cement (g) Water (ml) Graphene (mg) Graphene/cement
(%) SP/C (%)
M0 0.4 100 40 0 0 0
GM3 0.4 100 40 30 0.03 0
GM5 0.4 100 40 50 0.05 0
GM10 0.4 100 40 100 0.10 0
M0S 0.4 100 40 0 0 0.1
GM3S 0.4 100 40 30 0.03 0.1
GM5S 0.4 100 40 50 0.05 0.1
The cement paste specimens were casted in the prism of the dimension 160 × 40 × 40 mm. After that, a wire mesh of 11 × 11 mm size having 40 × 70 mm dimen-sion was inserted in the specimen. Figure 1 provides the details and placement of wire meshes in cement paste specimens. Compressive strength was measured using
ASTM C 109 (1999). After the compression test,
sam-ples of size 1 × 1×0.5 cm were collected from the frac-tured specimens to study the surface morphology. For this purpose field emission scanning electron microscope (FE-SEM, AJSM-7600F) was used. Furthermore, energy dispersive X-ray spectrometer (EDS) was the used to study elemental composition.
3.3 Rheological Measurements
Rheometer MCR302 (Anton-Paar) was used to estimate the flow properties of cement paste. MCR302 with its varying geometries is given in Fig. 2. Experimental data points were recorded and analysed using Rheoplus soft-ware. Moreover, two test geometries i.e. smooth paral-lel plates and concentric cylinder were used to calculate the rheological characteristics as shown in Fig. 2b, c. Gap thickness for smooth parallel plates and concentric cylin-ders was 0.6 and 1.2 mm, respectively.
When material got ready, it was divided into three equal portions. First portion was poured on the plates immediately while the second and third portion was poured after 30 and 60 min later. The amount of 15 milli-litre of the graphene-cement mixture was placed on the plate of 25 mm diameter at 25 °C. At initial stage, the composite paste mixture was kept at rest, however, after 10 min it was pre-sheared for 60 s at a shear rate of
100 s−1. Such process was performed to re-homogenize
the specimen and overcome the thixotropic character-istics of cement paste (Roussel et al. 2012). Lately, after 5 min, the shear rate was increased to 20 intervals from 0.6 to 100 s−1 and then it was reversed as 100–0.06 s−1.
From the process, the downslope curve estimation was utilized to record the rheological characteristics. Simi-larly, two varying shear rate ranges such as from 200 to 0.6 s−1 with 40 intervals and 300–0.6 s−1 with 60
inter-vals were applied to graphene-cement mixture. At dif-ferent time interval, 0, 30 and 60 min, flow properties were also determined. In 30 and 60 min resting times, the graphene cement specimens were stirred manually for 15 s before experimentation. Furthermore, for mixes M0, GM3, GM5 and GM10, the effect of the graphene and its approximate quantity on the rheology was also investigated. These samples were subjected to three different shear rate cycle range as shown in Table 3. Moreover, three resting times, the time between sample preparation and casting, were considered in this study to examine their effect on cement-paste rheology. Influence of superplasticizer on rheological properties and dif-ferent test geometries was also studied on these mixes. Table 3 shows the description of the various sample used to observe the effect of resting time, shear rate cycle and superplasticizer on rheological measurements. After-wards, fundamental physical properties of graphene cement paste i.e. yield stress and viscosity were calcu-lated using mathematical models. It is important to men-tion here that few rheological samples were taken from our previous study to provide comparison and validation of the research work (Rehman et al. 2017).
3.4 Test Setup for Electrical Properties
Piezoresistive properties (variation of electrical resistiv-ity with applied strain) of graphene based cement com-posite was investigated using the four-probe method. Contact resistance is not recorded in the four-probe method, which makes it superior to the two-probe method. In four-probe method, outer two contact points are used for monitor the electrical resistance while inner two contact points for voltage measure-ment. Experimental setup for measuring the electrical resistivity is given in Fig. 3a which includes Instron 600 kN, strain gauge, TDS-530 data logger, DC power sup-ply and 10-Ω electrical resistance. Direct current was supplied to the specimen using 15 V DC power battery, while the compressive load was applied from Instron 60 kN machine. All measurements were recorded using TDS-530 datalogger. Electrical properties of graphene cement composite were evaluated after 28-days of casting.
Schematic illustration of circuit diagram is given in Fig. 4. Voltage drop was measured by datalogger using inner wire meshes of the specimen. Meanwhile, current was measured from resistor connected to data logger in a circuit as shown in Fig. 4.
4 Results
4.1 Rheological Characteristics
In this section results related to rheological charac-teristics will be discussed. Several factors like mix
composition, water content, admixture amount, gra-phene content, mixing process, testing technique, resting time, shear rate cycle and mathematical model signifi-cantly alter the flow properties of cement paste (Shaugh-nessy and Clark 1988). Moreover, in-depth studies have been carried out on mix compositions including water to cement ratio, mixing and testing techniques (Nehdi and Rahman 2004; Shaughnessy and Clark 1988). Therefore, these parameters are not covered in this research work, however, graphene content, superplasticizer role, resting time and shear rate cycle range is focused in this work.
4.1.1 Yield Stress
shear rate cycle and test geometries is further discussed in following subsections.
4.1.1.1 Effect of Graphene on Yield Stress It was observed in Table 4 that the yield stress values were increased by the incorporation of graphene to the cement matrix. Moreo-ver, by increasing percentage of graphene in the design mixture, the yield stress values were increased for all the
rheological models. Concentric cylinders recorded higher values of yield stress and observed the similar trend as found in our previous study performed on parallel plates (Rehman et al. 2017). Furthermore, a similar trend was found in the literature. Shang et al. (2015) performed the experimentation to study the influence of graphene oxide on rheological properties of cement paste. For this pur-pose 0.08% of graphene oxide was used in cement paste and increment in yield stress was noted four times of plain cement paste. This increase in yield stress may be related to the higher surface area of graphene nanoplatelets, which increase the overall demand for water for lubrica-tion (Chuah et al. 2014). Besides that, it was noticed due to Vander wall forces graphene nanoplatelets (GNPs) form bundles in aqueous solution. Moreover, when the aqueous solution of GNPs was further mixed with cement the elec-trostatic interactive forces become prominent. As a result, water molecules entrapped in it and reduce the overall quantity of free water. Similar bundles and agglomerated structure of graphene oxide was found in study of Shang et al. (2015) and Wang et al. (2016). Therefore, it is con-cluded that by adding and increasing the content of gra-phene in cement paste, more flocculation was formed, as a result, the yield stress values were significantly improved.
Furthermore, variation of yield stress with mathemati-cal models and graphene content was determined and shown in Table 5. It can be seen clearly that concentric cylinders predicted the yield stress values nearly twice as compared with parallel plates. The main reason for this increment is the gap and test geometry. In parallel plates, gap between two plates is very small and spread diameter is more. Moreover, HB model predicted the lowest values as shown in Table 5. In parallel plate values of Bingham model and modified Bingham model are very close to each other while, in concentric cylinders HB model and modified Bingham model are matching. Therefore, it is concluded that nonlinear models predicted similar values in concentric cylinders and linear models predicted the similar trend in parallel plate geometry.
4.1.1.2 Effect of Shear Rate Range on Yield Stress The variation in shear rate is based on the delivering method of the concrete to the formwork either by pumping or bucket. The shear rate of the cement paste in the ordinary operation of concrete was found about 70 s−1 as estimated
by Ferraris (1999). However, for high performance and self-compacting concrete, cement paste bears high shear rate during pumping, transporting and placing. Moreo-ver, numerous researchers used high shear rate range for their analysis (Yahia and Khayat 2003; Saak et al. 1999). Furthermore, Roussel (2006) reported that while concret-ing, cement paste bears the shear rate three to five times higher than that of the concrete. The concept of yield
Table 3 Description of rheological samples.
Sample Sher rate cycle
range (s−1) Resting time (min)
Effect of graphene percentage
M0 (control) 200–0.6 0
GM3 200–0.6 0
GM5 200–0.6 0
GM10 200–0.6 0
Effect of shear rate
M0a 100–0.6 0
M0b 200–0.6 0
M0c 300–0.6 0
GM3a 100–0.6 0
GM3b 200–0.6 0
GM3c 300–0.6 0
GM5a 100–0.6 0
GM5b 200–0.6 0
GM5c 300–0.6 0
GM10a 100–0.6 0
GM10b 200–0.6 0
GM10c 300–0.6 0
Effect of resting time
M0-0 200–0.6 0
M0-30 200–0.6 30
M0-60 200–0.6 60
GM3-0 200–0.6 0
GM3-30 200–0.6 30
GM3-60 200–0.6 60
GM5-0 200–0.6 0
GM5-30 200–0.6 30
GM5-60 200–0.6 60
GM10-0 200–0.6 0
GM10-30 200–0.6 30
GM10-60 200–0.6 60
Effect of SP
M0 (control) 200–0.6 0
M0S 200–0.6 0
GM3 200–0.6 0
GM3S 200–0.6 0
GM5 200–0.6 0
GM5S 200–0.6 0
GM10 200–0.6 0
stress is a very important parameter, however, its values are directly related to the range of shear rate cycle (Barnes and Walters 1985). Table 6 presents the yield stress values of numerous cement specimens for three different shear rate range. It was noted that shear rate range has a signifi-cant effect on the yield stress values, and the increment in yield stress was observed for both test geometries. Modi-fied Bingham model and Bingham model determined the higher yield stress values for parallel plates and concentric cylinders, respectively. As the modified Bingham model has the characteristics of both Bingham and Herschel– Bulkley model thus, it fits more accurately with the flow
data. The yield stress values for the Casson equation and HB model were found lowest amongst other models for parallel plates and concentric cylinders, respectively, however, they precisely fit the flow data curve. Barnes and Walters (1985) performed the experimental investigation using Bingham model by considering three different shear rate ranges and determined the increase in yield stress values with high shear rate range cycle. In short, the effect of shear rate range on the yield stress is very beneficial for normal and high-performance concretes. Furthermore, this study also opens a new approach for the use of gra-phene-cement composite as a self-consolidating concrete.
a
b
c
Specimen
Instron 600
Data Logger
DC battery
Strain gauge
4.1.1.3 Effect of Resting Time on Yield Stress Generally, it was observed that with the passage of time, molecular structure changes in the cement paste due to chemical interaction, therefore, it is very important to consider the effect of resting time on the yield stress. Resting time is
the time interval between sample preparations to cast-ing. The results showed that the yield stress was increased with various resting time (Table 7). This increment in the yield stress may be attributed to three factors (a) thixo-tropic properties of cement (Wang et al. 2016), (b) pres-ence of suspended particles (graphene) and (c) hydration reaction of cement paste. As cement paste has thixotropic properties (Wang et al. 2016) and structures change in the cement paste, therefore, high shear stress was observed at the same shear rate. It was also noted that for 60 min rest-ing time more yield stress was recorded for GM3, GM5 and GM10 mix samples as compared to control mix (M0). This shows that graphene has a significant effect on yield stress. It was noted that yield stress values were slightly more in parallel plates as compared to the concentric cyl-inders. In parallel plates test geometry, particles sedimen-tation is a significant factor due to more spread surface as compared with the concentric cylinders. This sedimenta-tion effect is more prominent for a higher concentrasedimenta-tion of graphene mixes (Nehdi and Rahman 2004). Thus, it can Fig. 4 Schematic illustration of the electrical connections in four-probe resistivity method (Rehman et al. 2018).
Table 4 Effect of graphene percentage on yield stress values.
Sample Casson Bingham HB Modified BM
Parallel plate
M0 (control) 0.52 1.53 1.22 1.76
GM3 0.62 1.67 1.30 1.79
GM5 0.79 1.84 1.48 1.89
GM10 0.80 1.90 1.53 1.93
Concentric cylinders
M0 (control) 0.58 0.91 0.13 1.21
GM3 1.48 2.42 0.42 0.98
GM5 1.34 2.23 0.34 0.99
be summarized that with an increase in resting time of the mixtures, the yield stress values also increased.
4.1.1.4 Effect of Super‑plasticizer on Yield Stress Several studies (Nehdi and Rahman 2004; Wang et al. 2016, 2017)
reported the effect of water reducing agent on the yield stress of the cement paste and considered a parameter to investigate and estimate its influence on rheological prop-erties. Therefore, its interface with rheological models and test geometries were obtained in this study and yield
Table 5 Variation of yield stress with mathematical models and graphene content.
Sample Variation with mathematical models Variation with graphene content Casson model Bingham
model (BM) HB model Modified Bingham model Casson model Bingham model (BM) HB model Modified Bingham model
Parallel plate
M0 100.00 294.23 234.62 338.46 100.00 100.00 100.00 100.00
GM3 100.00 269.35 209.68 288.71 119.23 109.15 106.56 101.70
GM5 100.00 232.91 187.34 239.24 151.92 120.26 121.31 107.39
GM10 100.00 237.50 191.25 241.25 153.85 124.18 125.41 109.66
Concentric cylinders
M0 100.00 156.90 22.41 208.62 100.00 100.00 100.00 100.00
GM3 100.00 163.51 28.38 66.22 255.17 265.93 323.08 80.99
GM5 100.00 166.42 25.37 73.88 231.03 245.05 261.54 81.82
GM10 100.00 160.93 26.49 66.2 260.34 267.03 307.69 82.64
Table 6 Effect of shear rate range on yield stress values.
Sample Casson Bingham HB Modified BM
Parallel plate
M0a 0.45 1.46 1.17 1.46
M0b 0.52 1.53 1.22 1.76
M0c 0.55 1.60 1.27 1.83
GM3a 0.50 1.51 1.21 1.61
GM3b 0.62 1.67 1.30 1.79
GM3c 0.64 1.74 1.34 1.86
GM5a 0.52 1.53 1.23 1.63
GM5b 0.79 1.84 1.48 1.89
GM5c 0.81 1.87 1.58 1.93
GM10a 0.62 1.45 1.33 1.45
GM10b 0.80 1.90 1.53 1.93
GM10c 0.82 1.95 1.63 1.95
Concentric cylinders
M0a 0.39 0.30 0.04 0.30
M0b 0.58 0.91 0.13 1.21
M0c 1.67 3.76 0.42 0.98
GM3a 0.98 0.76 0.06 0.99
GM3b 1.48 2.42 0.42 0.98
GM3c 3.069 8.307 1.60 0.99
GM5a 0.81 0.63 0.58 0.62
GM5b 1.34 2.23 0.34 0.99
GM5c 3.24 8.70 1.17 8.70
GM10a 0.98 0.75 0.14 0.75
GM10b 1.51 2.43 0.40 1.00
GM10c 3.01 8.33 1.51 8.33
Table 7 Effect of resting time on yield stress values.
Sample Casson Bingham HB Modified BM
Parallel plate
M0-0 0.52 1.53 1.22 1.76
M0-30 1.75 1.65 1.38 1.85
M0-60 1.93 2.54 3.64 2.88
GM3-0 0.62 1.67 1.30 1.79
GM3-30 1.81 1.72 1.42 1.92
GM3-60 4.91 3.78 1.65 2.19
GM5-0 0.79 1.84 1.48 1.89
GM5-30 1.87 2.11 1.66 1.93
GM5-60 4.88 3.23 1.75 2.36
GM10-0 0.80 1.90 1.53 1.93
GM10-30 0.82 1.95 1.63 1.95
GM10-60 3.82 2.95 1.73 2.95
Concentric cylinders
M0-0 0.58 0.91 0.13 1.21
M0-30 0.93 1.39 0.19 1.39
M0-60 0.98 1.79 0.35 1.47
GM3-0 1.48 2.42 0.42 0.98
GM3-30 1.90 2.99 0.46 1.00
GM3-60 1.88 3.07 0.52 1.00
GM5-0 1.34 2.23 0.34 0.99
GM5-30 2.18 3.32 0.56 3.32
GM5-60 2.37 3.62 0.76 3.62
GM10-0 1.51 2.43 0.40 1.00
GM10-30 2.11 3.15 0.62 3.15
stress values are given in Table 8. It was observed that with the addition of super-plasticizer in the mixes, the yield stress reduced for control and graphene based cement mixes in parallel plates and concentric cylinders. This reduction was might be due to the hydrophobic groups of poly-carboxylate super-plasticizer, which, absorbed on the surface of cement particles and extend in outwards direction. Due to the electrostatic repulsion, flocculated structure destroyed as a result free water released, which increase the fluidity and reduce the yield stress (Wang et al. 2016). Wang et al. (2017) determined the yield stress values for graphene oxide based cement composite and determined the effect of fly ash on composite material. They found that yield stress values reduce in fly ash-GO cement composite. Moreover, Bingham model and modi-fied Bingham model estimated the higher yield stress val-ues. It can be concluded that due to hydrophobic groups and electrostatic repulsion, yield stress values reduced with the addition of super-plasticizer.
4.1.1.5 Effect of Test Geometry on Yield Stress It was found from the experimental results that concentric cyl-inders exhibit high yield stress as compared with parallel plates. In case of parallel plates due to less gap and more spread diameter, flocculation structures break quickly which resulted in lower yield stress. Ferraris (1999) com-puted the gap in concrete by using mathematical model
developed by Garboczi and Bentz (1997) and found the
average value of gap is between 0.16 and 0.22 mm. How-ever, concentric cylinders, normally estimate the
rheo-logical properties at large gap i.e. seven times of estimated gap, therefore, it leads to measurement of the bulk values of cement paste and is not the correct values in accordance to concrete rheology (Ferraris 1999). Hung et al. (2015) performed experimental work on asphalt rubber binder and measured its rheology with both concentric cylinder and parallel plates. They found no significant difference between two geometries. It was noticed that the authors used very large gap i.e. 2 mm in parallel plates, due to which, the difference with concentric cylinders vanishes. Therefore, it can be concluded that parallel plates are suit-able for cement paste as it measures the rheological prop-erties with the realistic approach (Ferraris 1999).
4.1.2 Viscosity
Plastic viscosity is referred as resistance to flow of the cement paste. Plastic viscosities for the cement paste and graphene-cement composite were calculated by using concentric cylinders and parallel plates. The viscosities were computed from the flow curves proposed in Cas-son, Bingham and Modified Bingham Models. Gener-ally, for graphene based cement samples the Modified Bingham model estimated the highest plastic viscosities values. However, for large content graphene, Bingham model and modified Bingham model predicted the same viscosities. Furthermore, Casson method estimated the lowest plastic viscosity values for all mixes in both test geometries.
4.1.2.1 Influence of Graphene of Plastic Viscosity The incorporation of graphene in the cement paste increases the plastic viscosities as shown in Table 10. Furthermore, with the increase in amount of graphene the plastic vis-cosity also increases. These results are in support of the research work of Shang et al. (2015). They conducted the experimental work with a varying percentage of graphene oxide and found that with the addition of 0.04% of gra-phene oxide in the plain cement mix, the plastic viscosity values increased by 78%. Increase in plastic viscosity val-ues might be due to the large surface area of the graphene sheets, which results in a dry mix of the graphene cement paste as it requires more amount of water for lubricating the surface. Another reason may be that the addition of graphene reduces the free available water which increases the frictional resistance between graphene and cement matrix which resulted in higher viscosities. Therefore, it can be summarized that due to large surface area of gra-phene sheets and reduction in free available water, over-all plastic viscosity values increased. In addition, with the increase of graphene content, the deformation of the cement pastes become difficult due to external forces (Table 9).
Table 8 Effect of super-plasticizer on yield stress values.
Sample Casson Bingham HB Modified BM
Parallel plate
M0 (control) 0.52 1.53 1.22 1.76
M0S 0.36 1.24 1.17 1.33
GM3 0.62 1.67 1.30 1.79
GM3S 0.51 0.58 0.67 0.89
GM5 0.79 1.84 1.48 1.89
GM5S 0.52 0.74 0.75 0.74
GM10 0.80 1.90 1.53 1.93
GM10S 0.67 0.82 0.76 0.82
Concentric cylinders
M0 (control) 0.58 0.91 0.13 1.21
M0S 0.42 0.73 0.65 0.47
GM3 1.48 2.42 0.42 0.98
GM3S 0.82 0.62 0.04 0.99
GM5 1.34 2.23 0.34 0.99
GM5S 1.24 2.07 0.51 2.07
GM10 1.51 2.43 0.40 1.00
Furthermore, variation of plastic viscosity with math-ematical models and graphene content was computed. In parallel plates, plastic viscosity of graphene cement com-posite was found 1.6 times of plain cement paste while for concentric cylinders, it is found as 2.6 times. More-over, as compared with Casson model, Bingham model, modified Bingham model estimated close values in par-allel plate. While in concentric cylinder, Bingham model and modified Bingham model determine 1.3 times. Fur-thermore, Table 10 indicates that geometric setup has a significant influence on plastic viscosity values.
4.1.2.2 Influence of Shear Rate Range on Plastic Viscos‑ ity Test results of shear rate range on plastic viscosity for various rheological models were determined and pre-sented in Table 11. The apparent viscosity depends upon the shear rate and at a high shear rate, the apparent viscos-ity will be low (Shang et al. 2015). Shang et al. (2015) used the silica fume, graphene oxide and graphene oxide-silica fume in cement paste and found that for all mixes apparent viscosity reduces with the high shear rate range.
Further-more, the addition of graphene produces the flocculated suspensions in the cement matrix, thus, with the increase in shear rate cycle range, those suspended particles were destroyed and resulted in lower apparent viscosity. Thus, due to high shear rate range, deformation of cement
Table 9 Influence of graphene on plastic viscosity values.
Sample Casson Bingham Modified BM
Parallel plate
M0 (control) 0.42 0.50 0.47
GM3 0.71 0.80 0.96
GM5 0.78 0.84 0.84
GM10 0.79 0.85 0.84
Concentric cylinder
M0 (control) 0.18 0.24 0.25
GM3 0.51 0.65 0.66
GM5 0.51 0.64 0.65
GM10 0.49 0.64 0.65
Table 10 Variation of plastic viscosity with mathematical models and graphene content.
Sample Variation with mathematical models Variation with graphene content Casson model Bingham model
(BM) Modified Bingham model Casson model Bingham model (BM) Modified Bingham model
Parallel plate
M0 100.00 119.05 111.90 100.00 100.00 100.00
GM3 100.00 112.68 135.21 169.05 160.00 204.26
GM5 100.00 107.69 107.69 185.71 168.00 178.72
GM10 100.00 107.59 106.33 188.10 170.00 178.72
Concentric cylinder
M0 100.00 133.33 138.89 100.00 100.00 100.00
GM3 100.00 127.45 129.41 283.33 270.83 264.00
GM5 100.00 125.49 127.45 283.33 266.67 260.00
GM10 100.00 130.61 132.65 272.22 266.67 260.00
Table 11 Influence of shear rate range on plastic viscosity.
Sample Casson Bingham Modified BM
Parallel plate
M0a 0.39 0.46 0.30
M0b 0.42 0.50 0.47
M0c 0.43 0.42 0.39
GM3a 0.62 0.71 0.93
GM3b 0.71 0.80 0.96
GM3c 0.89 0.92 0.99
GM5a 0.74 0.78 0.79
GM5b 0.78 0.84 0.84
GM5c 0.79 0.75 0.45
GM10a 0.45 0.54 0.46
GM10b 0.79 0.85 0.84
GM10c 0.75 0.86 0.48
Concentric cylinder
M0a 0.22 0.29 0.29
M0b 0.18 0.24 0.25
M0c 0.12 0.17 0.17
GM3a 0.62 0.80 0.80
GM3b 0.51 0.65 0.68
GM3c 0.38 0.51 0.54
GM5a 0.57 0.74 0.74
GM5b 0.51 0.64 0.65
GM5c 0.41 0.54 0.54
GM10a 0.57 0.75 0.75
GM10b 0.49 0.64 0.65
pastes become easier under external forces. Moreover, in concentric cylinders, this effect was observed more accu-rately as compared with parallel plates. In parallel plates, due to sedimentation of the suspended particles, clear trend is not observed.
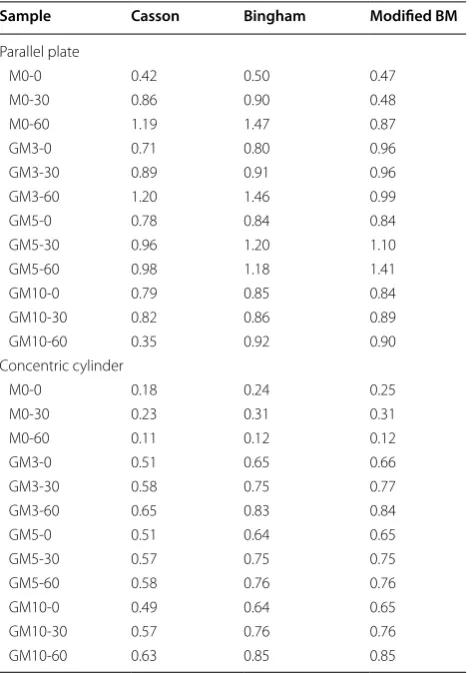
4.1.2.3 Influence of Resting Time on Plastic Viscos‑ ity The resting time also has a direct relationship to the plastic viscosity. Table 12 shows the values of plastic viscosity for both control mix and graphene cement mix. It was noted that plastic viscosity was increasing irre-spective of the test geometry and mathematical model. It mainly involves two factors: the hydration of cement par-ticles and the fractional resistance between cement parti-cles and graphene nanoplatelets. Impact of hydration and fractional resistance was prominent for the 60 min resting time. In concentric cylinders, an anomaly was recorded for M0-60 mix, in which it estimates very less plastic viscosity values. It might be related to some calculation error. As for other mixes, a common trend was found. Cao et al. (2016) reported that the 30 min of resting time can be considered as a dormant period for the
hydra-tion of cement paste. Therefore, the major contribuhydra-tion for 30 min resting was given by the fractional resistance between the cement paste and graphene sheets. Hence, it can be sum up that due to increase in resting time, flow behaviour becomes difficult for the cement paste.
4.1.2.4 Influence of Superplasticizer on Plastic Viscos‑ ity Table 13 shows the influence of superplasticizer on the plastic viscosities of the cement pastes. It was observed that with the addition of superplasticizer, flu-idity enhances. The possible reason for this is a reduc-tion of the internal fricreduc-tion between the particles which dramatically alters the rheological characteristics of the cement paste (Ferraris 1999). Moreover, it can be said that superplasticizer reduced the plastic viscosity values by 40% in parallel plates as compared with control mix. Therefore, the fluidity and workability of cement paste is greatly improved by incorporation of superplasticizer in the cement matrix.
4.1.2.5 Influence of Test Geometry on Plastic Viscos‑ ity Generally, parallel plates determined the higher val-ues for the plastic viscosities as compared with the con-centric cylinders. A possible reason may be the settlement of suspended particles. As parallel plates have the large spread diameter as compared with the concentric cyl-inders. Thus, suspended cement and graphene particles start to settle down and provide great hindrance against the deformation of cement paste. Therefore, it can be con-cluded that the sedimentation or creaming will be a key
Table 12 Influence of resting time on plastic viscosity.
Sample Casson Bingham Modified BM
Parallel plate
M0-0 0.42 0.50 0.47
M0-30 0.86 0.90 0.48
M0-60 1.19 1.47 0.87
GM3-0 0.71 0.80 0.96
GM3-30 0.89 0.91 0.96
GM3-60 1.20 1.46 0.99
GM5-0 0.78 0.84 0.84
GM5-30 0.96 1.20 1.10
GM5-60 0.98 1.18 1.41
GM10-0 0.79 0.85 0.84
GM10-30 0.82 0.86 0.89
GM10-60 0.35 0.92 0.90
Concentric cylinder
M0-0 0.18 0.24 0.25
M0-30 0.23 0.31 0.31
M0-60 0.11 0.12 0.12
GM3-0 0.51 0.65 0.66
GM3-30 0.58 0.75 0.77
GM3-60 0.65 0.83 0.84
GM5-0 0.51 0.64 0.65
GM5-30 0.57 0.75 0.75
GM5-60 0.58 0.76 0.76
GM10-0 0.49 0.64 0.65
GM10-30 0.57 0.76 0.76
GM10-60 0.63 0.85 0.85
Table 13 Influence of superplasticizer on plastic viscosity.
Sample Casson Bingham Modified BM
Parallel plate
M0 (control) 0.42 0.50 0.47
M0S 0.28 0.31 0.21
GM3 0.71 0.80 0.96
GM3S 0.40 0.46 0.47
GM5 0.78 0.84 0.84
GM5S 0.21 0.26 0.26
GM10 0.79 0.85 0.84
GM10S 0.25 0.32 0.36
Concentric cylinder
M0 (control) 0.18 0.24 0.25
M0S 0.17 0.22 0.20
GM3 0.51 0.65 0.66
GM3S 0.30 0.42 0.41
GM5 0.51 0.64 0.65
GM5S 0.40 0.51 0.51
GM10 0.49 0.64 0.65
factor in indicating the higher plastic viscosities for paral-lel plates (Nehdi and Rahman 2004; Barnes 2000).
4.1.3 Consistency and Power Rate Index
The plastic viscosity trend was estimated by consider-ing the HB model. It considers two main factors such as power rate index (n) and the consistency (K). Utiliz-ing these factors the relationship trend between shear rate and viscosity can be determined (Nehdi and Rah-man 2004). In addition, it also estimates the shear defor-mation such as shear thinning and thickening based on index values “n” (Wang et al. 2016). If n > 1 then fluid will have shear thickening behaviour and for shear thinning behaviour n < 1. K has no physical meaning and difficult to compare (Vikan et al. 2007). Generally, both n and K values were increased by the addition of graphene to the cement mix. Additionally, the behaviour of the cement paste was found in shear thinning. Concentric cylinders showed higher values for the K and lower values for the n as compared to the parallel plates. K and n values for dif-ferent mix design are given in Appendix Table 15.
K values were increased with the addition of graphene in the cement mixes as. It was noted that with an increase in the percentage of graphene in mix design K and n values increased for both test geometries. However, these values remained less than 1, which indicates the shear thinning behaviour of the cement paste. Numerous researchers observed the shear thinning behaviour of cement paste. Recently, Govin et al. (2016) studied the effect of guar gum derivates on the fresh state cement mortar. They found that n values were less than 1, and cement paste was behaving as shear thinning material. Therefore, it can be said that incor-poration of graphene results in more suspended structures in the cement paste, which makes it comparatively thicker to flow and enhance the resistance to flow.
The increment in shear rate cycle range has no signif-icant effect on the trend. Moreover, the n values nearly remained stable and consistence. Additionally, it is noted that maximum n values were found for 200–0.6 s−1 shear
rate range. This trend was followed in all graphene mix designs i.e. GM3, GM5 and GM10 mixes. Therefore, it can be concluded that with the higher shear rate cycle range, the cement paste will observe more shear thinning behaviour. The flocculated structures breakdown with the higher shear rate thus cement paste becomes thin-ner. It was observed that with an increase in resting time the behaviour of cement paste was closer to the shear thickening. For 60 min rest time samples, in parallel plate sample, the ‘n’ was more than 1, indicating the shear thickening behaviour. However, concentric cylinders esti-mated the shear thinning behaviour. This shows that it is very important to consider the geometric conditions for
calculation of rheological properties. Moreover, a rela-tionship needs to be discovered for eliminating the test geometry effects. Initially, when cement particles come in contact with water, a membrane of gelatinous calcium silicate hydrate forms on the surface of cement particle (Wallevik 2009). When cement paste is mixed this mem-brane break and cement particles separated and start freely to move. However, with an increase in rest time, this link and membrane become strong and difficult to break. Wallevik (2009) performed the experimental work to study the rheological properties of cement paste at 12, 42, 72 and 102 min after initial mixing. They found that coagulation and links between two cement particles can be reversible and permanent, based on hydration stage. Due to this reason, in cement paste, n values increased. Therefore, it can be concluded that with an increase in rest time, reversible coagulation and links between cement particles become irreversible, permanent and dif-ficult to break which will result in high resistance to flow.
When water reducing agent was added to the mix, it enhanced the flowability of the cement paste. Therefore, it was observed that the K and n values were reduced by the addition of super-plasticizer. Moreover, it causes shear thinning behaviour in all cement mixes. Wallevik (2009) stated that van der Waals and electrostatic repul-sive forces generate potential energy interaction between the cement particles. Due to this total potential energy interaction, cement particles become closer to each other and pasted together in the form of coagulation. The superplasticizer absorbs on the surface of cement particles and changes the total potential energy in such a manner that dispersion becomes easier. This trend was prominently observed in M0, GM3, GM5 and GM10 mixes. Hence, it can be stated that super-plasticizer greatly enhanced the flowability by reducing the internal friction between cement paste and graphene nanoplate-lets. Moreover, this action results in transforming the cement pastes thinner and easy to flow.
4.1.4 Standard Error
Standard error values were calculated using Eq. (7) for the various rheological models. These values are given in
Appendix Table 16 for an in-depth analysis of reader. A higher value predicted by the mathematical model rep-resents that flow curve and mathematical model curve are not in the match. It was observed that HB and Modi-fied Bingham models showed the lower standard error, whereas, the Bingham and Casson models displayed higher values. M0c, M0a, GM10, GM5-60, GM10c, GM10-0, GM10-30 and GM10-60 mixes show the maxi-mum standard error values for all mathematical models in parallel plates. However, in concentric cylinders, M0S and M0-60 estimated the highest values for the standard error for all rheological models. Generally, the standard error values predicted by rheological models were found lower for the concentric cylinders compared to the par-allel plates. According to Hung et al. (2015) due to same diameter of upper and lower parallel plates, results will be linear. In parallel plates, linear mathematical models i.e. modified Bingham and Bingham model estimated the lower standard error values in comparison to the Her-schel–Bulkley and Casson models. As modified Bing-ham model have the characteristics of both BingBing-ham and Herschel–Bulkley model (Feys et al. 2013) therefore, for parallel plates it predicted the flow behaviour more accu-rately. In concentric cylinders, nonlinearity is prominent due to the geometry of the apparatus. Hence HB model and Casson model estimated the lower standard error values. It can be concluded that for parallel plates Modi-fied Bingham, and for concentric cylinders, HB, is the more appropriate model to predict the flow behaviour of the graphene based cement pastes.
Furthermore, average standard error values and stander deviation values were determined for each mathematical model (Table 16 in Appendix). Standard deviation value indicates the divergence of calculated data from the mean value, irrespective of the magnitude of the standard error value. Whereas average stand error value is related to the magnitude of the standard error value. HB model esti-mated the lowest average and standard deviation values
in both test geometries. In parallel plate geometry, the highest average value was estimated by Casson model whereas, in concentric cylinders, Bingham model esti-mated higher average values. Thus, it can be concluded that Casson model estimated very high and scattered values, whereas HB model estimated low and converged values.
4.2 Hardened Properties
The main aim of this section is to evaluate the influence of graphene on hardened properties of cement compos-ite. For workability, the flow diameter test was performed for the graphene-cement composite and values are given
in Table 14. Graphene significantly reduced the flow
diameter and found to be dependent on graphene con-tent. It was noted that flow diameter drops 5.4, 6.2 and 9.3% for GM3, GM5 and GM10 mixes as compared with control mix. Graphene has a large surface area as com-pared with cement therefore, it needed an additional amount of water for lubricating the graphene sheets. By keeping the water-cement ratio constant in mix designs the amount of free-water reduced with increas-ing content of nanomaterials. Therefore, flow diameter and workability of the composite material was reduced with the incorporation of graphene. A similar trend was recorded in previous research work performed by Rehman et al. (2017). Rehman et al. (2017) used 0.03% of graphene by weight of cement and found 8.5% reduction in flow diameter. Moreover, Rehman et al. (2018) noted 12% decrease in flow diameter of cement specimen con-taining 0.03% of graphene oxide sheets. Furthermore, Pan et al. (2015) used 0.05% of graphene oxide while Collins et al. (2012) used 2% carbon nanotubes in their cement mix design. Both researchers kept water-cement ratio same i.e. 0.5 and only variable was nanomaterial type and quantity. Pan et al. (2015) and Collins et al. (2012) found 41.7 and 48.9% reduction in slump diameter of nanoma-terial based cement mix, respectively.
The stress–strain curves for M0, GM3, GM5 and GM10 mixes were obtained using strain gauge and Instron 600
kN machine as shown in Fig. 5. It can be observed in
Table 14 Flow diameter, density, compressive strength, compressive strain and electrical resistivity values of various cement mixes.
Sample Flow diameter (mm)/percentage rate (%)
Density (kg m−3)
percentage rate (%)
Maximum compressive load (kN)/percentage rate (%)
Compressive strength (MPa)/ percentage rate (%)
Compressive strain at maximum compressive load (mm/mm)/ percentage rate (%)
Four probe resistivity at maximum compressive loading (kΩ-cm)/percentage rate (%)
Mo 225/100 2155.6/100 93.6/100 58.5/100 0.0086/100 69.8/100
GM3 213/94.6 2045/94.9 103.6/110.6 64.7/110.6 0.012/147.2 22.5/32.2
GM5 211/93.8 2150.7/99.8 109.2/116.7 68.3/116.7 0.014/170.1 28.3/40.5
Fig. 5, graphene nanoplatelets significantly enhance the load carrying capacity of the cement paste and exhibit more ductile behaviour as compared with M0 (Table 14). GM5 mix showed prominently higher compressive strength of about 16.7% compared to mix M0. Moreover, GM3, GM5 and GM10 mix showed 47.2, 70.1 and 53.6% more compressive strain at ultimate compressive load before failure, showing the ductile behaviour of graphene cement composite material. The results of this study were further compared with the available stress–strain curve of graphene-oxide based cement paste and given in Fig. 5
(Pan et al. 2015). Pan et al. (2015) studied the graphene oxide in cement paste and reported significant improve-ment in compressive strength. For 28 days, compressive strength values were 43.3 and 51.5 MPa for OPC and gra-phene oxide based cement respectively. Moreover, several explanations have been given by numerous researchers for enhancing the mechanical properties. Rehman et al. (2018) identified that filling and packing ability, acceler-ated hydration, more hydracceler-ated products, bond formation between graphene nanoplatelets and cement matrix and crack bridging contributed for increase in compressive strain and strength. Hence, the increase in compressive strain and strength may be related to the template effect, crack bridging by graphene sheets, and higher strength of graphene.
FESEM images are obtained from the fractured pieces of graphene cement composite to investigate the mor-phology, crystalline structure, growth of hydrated prod-ucts and their pattern. The morphology of the composite material using FESEM images is shown in Fig. 6. It was noted that due to template effect, the hydrated products developed over the graphene. Moreover, hydrated prod-ucts were developed in an ordered way. Therefore, gra-phene cement composite was found more compact as compared with plain cement specimen. Furthermore, graphene fills up the nano-pores which play a prominent role in enhancing the mechanical properties. Graphene nanoplatelets, hexagonal plates of portlandite and cal-cium silicate hydrate (CSH) gel (needle form and honey-comb formed) can be found in Fig. 6. To further verify and confirm the presence of carbon materials (graphene) energy selective backscattered (EsB) image were used. These EsB images are simple and easy to comprehend carbon materials in fractured surface of specimen. In EsB images, carbon containing compounds absorbed the elec-tron beam and turned to complete black. Figure 6b shows EsB image of graphene cement composite. EDX image was further used to identify the hydrated cement prod-ucts and graphene by elemental composition. Figure 6c represents the EDX of the graphene as marked in Fig. 6a. As graphene is carbon materials, therefore, the carbon Fig. 5 Stress-strain curve for cement paste (M0), graphene-cement paste (GM3, GM5 and GM10) and GO-OPC by (Pan et al. 2015).
Fig. 6 Field emission scanning electron images of composite material; a FESEM image of graphene-cement composite at 7 days; b Energy selective Backscattered (EsB) or backscattered image of (a); c EDX of graphene on a point indicated in (a); d EDX for the hydrated cement product at cross hair location in (b); e FESEM image of graphene-cement composite at 28 days; f EsB or backscattered image of (e); g EDX for the marked point in (e); and h EDX at cross-hair location in (f).
content was maximum in it, which confirm the existence of graphene. Figure 6d shows the elemental composition of CSH gel as marked in Fig. 6b using EDX. In CSH gel maximum content was oxygen trailed by the carbon and silicon. Furthermore, EDX and EsB images were used to identify graphene and honeycomb structure of CSH gel in Fig. 6f–h. Moreover, indirectly these images highlight the uniform dispersion of graphene in cement composite. As a very tiny piece was taken from the bulk specimen, thus the presence of graphene is only possible if it is uni-formly and thoroughly mixed during sample preparation. Hence, it can be summarized that due to the addition of graphene, hydrated products grows over GNPs in uni-form and ordered way (Cao et al. 2016), which resulted in improvement of compressive strength.
Lastly, crack bridging and crack blocking phenom-ena by GNPs is discussed using FESEM images. For
this purpose generation and propagation of cracks were
noted in plain cement specimen as shown in Fig. 7a.
These cracks are in nano size dimension and later they widen into micro and macro size cracks which leads to the failure of the specimen. It is important to mention here that graphene provides both crack bridging and crack blocking mechanism. The surface area of graphene plays an important role for the crack bridging
mecha-nism (Zohhadi 2014) whereas, thickness of graphene
provide the hindrance to crack propagation (Rehman et al. 2017). One of the major benefits of graphene nano-platelets in cement composite is a successful interruption of newly developed cracks at nanoscale level. Moreover, it offers a hurdle in continuity of the small cracks. Dis-continuity of cracks can be seen in Fig. 7b. Additionally, FESEM images were reproduced from Rehman et al. (2017) and Zohhadi (2014) studies to highlight blocking
and bridging of the cracks by graphene nanoplatelets in Fig. 7c, d, respectively. Therefore, due to crack bridging, crack holding and discontinuity of cracks by graphene make the composite more ductile and compact as com-pared with plain cement specimen. Thus, it can be sum-marized that graphene nanoplatelets deflect the crack path, make them fine and discontinue and offer obstruc-tion in their growth, which results in enhancing the mechanical properties of graphene cement composite.
4.3 Electrical Properties
This section will provide the details about piezoresistive nature of composite specimens. For this purpose, four-probe method is used to calculate the electrical resistivity values. Valdes (1954) provided the mathematical expres-sion given in Eq. (8) to determine the electrical resistivity values.
where ρ is resistivity (Ω-cm); I is current measured
by outer two probes; V is floating potential
differ-ence between inner two probes; and S is spacing (cm) S2 = 60 cm and S1 = S3 = 40 cm.
Electrical resistivity values for various mixes were
determined using Eq. (8) and shown in Table 14.
(8)
ρ= V
I ∗2π∗
1
1 S1+
1 S3−
1 S1+S2−
1 S2+S3
Electrical resistivity values were reduced by 67.8, 59.5 and 49.2% for GM3, GM5 and GM10 mixes, respectively in contrast to control sample. Maximum drop in electri-cal resistivity value at ultimate failure load was noted for GM3 specimen as compared with GM5 and GM10 speci-men, therefore, only GM3 specimen was considered for detailed investigation and piezoresistive characteristics. Moreover, for in-depth analysis normalized compressive loading (NCL) and fractional change in resistance (FCR) as given in Eqs. (9) and (10) were calculated (Rehman et al. 2017).
where, P is compressive loading at the given time during the test; and Pmax is maximum compressive loading for
the specimen; ρt is electrical resistivity at the given time
during the test; ρ0 is lectrical resistivity at the start of the
test.
The relationship between the fractional change of resistance in percentage and the normalized compres-sive load are shown in Fig. 8. Furthermore, results of this study were compared with two studies of Li et al.
(9)
NCL= P
Pmax
(10)
FCR= ρt−ρ0
ρ0 × 100%
(2004) and Li et al. (2006) from literature, which high-lights the significance and superiority of graphene
cement composite specimen. Li et al. (2004) used 3%
nano iron oxide in cement mortar to monitor the self-sensing properties. They concluded that fractional change is resistance should be used for self-sensing purpose instead of electrical resistivity values.
Fig-ure 8 shows the variation in percentage FCR values
with NCL for control mix and nano-iron as investi-gated by Li et al. (2004). Moreover, the influence of carbon black based cement composites on strain sens-ing characteristics were studied by Li et al. (2006). For this purpose, 15% carbon black was used in the mix design. A linear relation between FCR and NCL values of carbon black based cement composite was noted as given in Fig. 8. Furthermore, it was observed that vari-ation of control sample for FCR–NCL curve was neg-ligible as compared with nano iron oxide and carbon black based cement composites. However, FCR–NCL curve of GM3 specimen was more sensitive and better as compared with nano-iron and carbon black curve. Therefore, GM3 specimen in an appropriate and bet-ter way correlates and highlight the strain-sensing characteristics. The main contributing factor is high electrical transport properties of graphene which out-shined it as compared with other nanomaterials. Based on these results, it can be concluded that graphene-cement composite specimen will promote the sustain-able health monitoring which will conserve the natural and financial resources.
5 Conclusions
In this research, we investigated the role of graphene to evaluate the rheological and piezoresistive properties of cement based composites. Following are the conclusions:
1. Generally, Bingham model and Modified Bingham model determined the highest yield stress values and HB and Casson model determined the lowest values in concentric cylinders and parallel plates, respectively. It was observed that the yield stress and the plastic vis-cosity increased with the increase in graphene content and resting time while the yield stress and the plastic viscosity decreased with the increase in the dosage of superplasticizer. At higher shear rate range, the yield stress increased while the plastic viscosities decreased. Addition of graphene results in formation of
floccu-lated suspension in the paste, which mainly alters the properties of the cement paste.
2. The Standard error values varied for different rheo-logical models and were found to depend on several parameters like graphene/cement ratio, shear rate, resting time and test geometry. For all rheological models, generally, lower standard error values were found for concentric cylinders when compared to parallel plates. For both geometries (cylinders and parallel plates), HB model with lowest standard error value was found in the best-fitted model, while, Cas-son model estimated the most scattered and higher average standard error values.
3. Hardened properties of the cement paste were greatly affected by the addition of graphene. In compari-son to plain cement paste flow diameter of graphene cement composite specimen was reduced up to 9.3%, while the load carrying capacity and overall failure strain increased up to 16.7 and 70.1%, respectively. 4. The electrical resistivity values of cement based
composites dropped with the incorporation of gra-phene. The maximum drop in electric resistivity was shown by GM3 specimen and was found to be 67.8%. Moreover, it opened a new dimension for graphene-cement composite as smart sensing building con-struction material.
Authors’ contributions
SKUR and ZI conceived and designed the experiments; SKUR, MA and MFJ per-formed the experiments; SKUR, SAM, SN and KM analyzed the data; ZI, MJ and KM contributed reagents/materials/analysis tools; and SKUR, SAM, MFJ and MA wrote the paper. All authors read and approved the final manuscript.
Author details
1 Department of Civil Engineering, University of Malaya, 50603 Kuala Lumpur,
Malaysia. 2 Civil Engineering Department, Lords Institute of Engineering &
Technology, Hyderabad, India. 3 Department of Civil Engineering, School
of Engineering, Nazarbayev University, Astana 010000, Republic of Kazakhstan.
4 Department of Civil Engineering, School of Engineering & Technology,
Insti-tute of Southern Punjab, Multan, Pakistan. 5 Department of Civil Engineering,
COMSATS University Islamabad, Abbottabad Campus, Abbottabad 22060, Pakistan. 6 Department of Civil Engineering, City University of Science &
Infor-mation Technology, Peshawar, Pakistan. 7 Department of Civil Engineering,
Sarhad University of Science and Information Technology, Peshawar, Pakistan.
Acknowledgements
This research was supported by University Malaya Research Grant (UMRG— Project No. RP004A/13AET), University Malaya Postgraduate Research Fund (PPP—Project No. PG217–2014B) and Fundamental Research Grant Scheme, Ministry of Education, Malaysia (FRGS—Project No. FP004-2014B).
Competing interests