www.mech-sci.net/5/59/2014/ doi:10.5194/ms-5-59-2014
© Author(s) 2014. CC Attribution 3.0 License.
Fatigue testing of flexure hinges for the purpose of
the development of a high-precision micro manipulator
I. Ivanov and B. Corves
Department of Mechanism Theory and Dynamics of Machines (IGM), RWTH Aachen University, Aachen, Germany
Correspondence to: I. Ivanov ([email protected])
Received: 2 May 2014 – Revised: 17 September 2014 – Accepted: 24 September 2014 – Published: 29 October 2014
Abstract. An approach was initially proposed for the estimation of the maximum von Mises stress in flexure hinges. It relied on recognizing relevant stress factors that were calculated from empirical functions set up by using the finite element method. Afterwards, a fatigue test bench was designed and realized for the examination of flexure hinge specimens. As functional failure occurred before fracture, crack initiation and propagation were observed permanently with the help of a monitoring system and sporadically by means of scanning electron microscopy. On the basis of results obtained thereby, where varying the maximum rotation angle, the operating frequency and the quality of the notch surfaces, a correlation was established between the stress limit and the number of cycles up to functional failure. This was utilized for the optimal dimensioning of flexure hinges within the framework of the development of a high-precision micro manipulator.
1 Introduction
High-precision micro manipulators are typically character-ized by a working space in micrometer or millimeter range as well as a positioning accuracy or repeatability in nanome-ter range. Such motion characnanome-teristics are required for var-ious applications (e.g. stages, alignment devices and posi-tioning systems). In high-precision micro manipulators, par-allel robots are normally implemented with compliant joints (Pernette et al., 1997), which operate smoothly (free of clearance and friction) and need to be supported by high-resolution actuators and sensors (Bellouard, 2010). Among the different types of compliant joints (Raatz, 2006), notch flexure hinges are most widely spread offering simplicity and compactness. They are prismatic or cylindrical parts necked down by cutting notch shapes out from blank pieces of mate-rial to improve inherent compliance and thus mobility in one or more directions (Paros and Weisbord, 1965). Although flexure hinges can exhibit two or three rotational degrees of freedom, those with one rotational degrees of freedom are more practicable both for planar and spatial applications.
A high-precision micro manipulator has been developed at the Department of Mechanism Theory and Dynamics of Machines of RWTH Aachen University (Fig. 1a). This
miniaturized positioning system was realized after a cubic-shaped structural concept (Ivanov and Corves, 2012a) was monolithically designed and optimally dimensioned (Ivanov and Corves, 2013). It was thereby essential to possess reli-able mathematical models for the stiffness and stress charac-terization of flexure hinges. The stiffness characcharac-terization is given in the previous papers (Ivanov and Corves, 2012b, c). The stress characterization is the topic of this paper.
An analytical method has already been known for calcu-lating the maximum normal stress in flexure hinges (Smith, 2000; Howell, 2001; Lobontiu, 2010). It usually takes tension-compression and in-plane bending and does not take out-of-plane bending, shear and torsion into account. The ba-sic equations are derived from the mechanics of material and enhanced by the stress concentration factors for notch shapes (Pilkey and Pilkey, 2008; Young and Budynas, 2002). This can also be approximated by using the finite element method (Smith et al., 1987; Schotborgh et al., 2005). In the first part of the paper, the state of stress will be more exhaustively con-sidered to more accurately estimate the maximum von Mises stress in flexure hinges.
Figure 1. (a) High-precision micro manipulator (working space:
±2.15× ±2.15× ±2.15 mm3, resolution: 0.1 µm) developed at the Department of Mechanism Theory and Dynamics of Machines of RWTH Aachen University (Ivanov and Corves, 2014). (b) Flexure hinge specimens fabricated by electro-discharge machining from Ti-6Al-4V grade 5 (annealed bar) at KAPE Erodiertechnik (KAPE, 2014).
will be investigated for specimens equivalent to the flexure hinges in the high-precision micro manipulator (Fig. 1b). Un-derstanding the fatigue process will lead to establishing a cor-relation between the stress limit and the number of cycles up to functional failure, in a way which has not been adopted in few recent studies (Henein et al., 1999; Raatz, 2006).
2 Stress estimation
In flexure hinges, deflection is accompanied by stress that must not exceed yield strength. A linearly elastic relation be-tween deflection and stress makes operation predictable and repeatable. For the purpose of comparison to yield strength, the state of stress (three normal and three tangential stress components) is converted into an equivalent state of stress
other stress components are negligibly small.σx andσz are
reduced on the outsides (Zettl et al., 2005). Consequently, equivalent von Mises stress (σv) is at maximum on the
cor-ners of the thinnest cross section (Fig. 2).
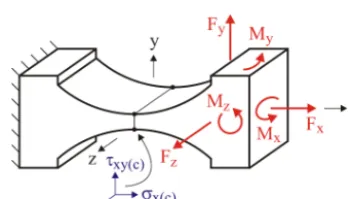
Stress in the case of tension-compression along the lon-gitudinal axis, bending around the lateral axis and torsion around the longitudinal axis is considerably lower than stress in the case of bending around the pivot axis. As the state of stress is predominantly produced by bending around the pivot axis, it can be assumed that the maximum von Mises stress still occupies the corners of the thinnest cross section when flexure hinges are additionally subjected to tension-compression along the longitudinal axis, bending around the lateral axis and torsion around the longitudinal axis. Accord-ingly, relevant stress components are to be recognized that mostly contribute to equivalent von Mises stress on the cor-ners of the thinnest cross section. They are one normal stress component (σx) for tension-compression and bending as well as two tangential stress components (τxyandτxz) for torsion. By analogy with the compliance matrix (Ivanov and Corves, 2012b, c), it is possible to introduce a stress matrix
S= σx Fx σx Fy σx Fz σx Mx σx My σx Mz σy Fx σy Fy σy Fz σy Mx σy My σy Mz σz Fx σz Fy σz Fz σz Mx σz My σz Mz τxy Fx τxy Fy τxy Fz τxy Mx τxy My τxy Mz τyz Fx τyz Fy τyz Fz τyz Mx τyz My τyz Mz τxz Fx τxz Fy τxz Fz τxz Mx τxz My τxz Mz (1)
that defines a linearly elastic relation between a stress vector
ς= σxσyσzτxyτyzτxzT (2)
and a loading vector
3= FxFyFzMxMyMz T
. (3)
Figure 2.Stress calculated analytically (σx(an)=6Mz/(w t2)=const.) and with FEM (σx,σz,σv6=const.) on the lateral sides of the thinnest cross section (x=0,y= ±t /2,z= −w/2− +w/2, for an origin at the midpoint of a flexure hinge) in the case of pure bending around the pivot axis (Mz=1 Nm). Calculation for the geometry parameters of the specimens:w=16 mm,l=4 mm,R=3 mm,t=0.4 mm.
Figure 3.Relevant stress components on the corners of the thinnest cross section for the different cases of loading and deformation in a flexure hinge (x– longitudinal axis,y– lateral axis,z– pivot axis).
and two tangential stress factors (marked bold in Eq. 1). The others stress factors can be regarded as zero elements in the stress matrix. Therefore, equivalent von Mises stress is
σv(c)= r
σx(c)2 +3·τxy(c)2 +τxz(c)2 (4)
where normal stress is
σx(c)=σx(c),Fx+σx(c),Fy+σx(c),Fz+σx(c),My+σx(c),Mz. (5)
Depending on the directions of tension-compression and bending, normal stress and thus equivalent von Mises stress are at maximum on one of the four corners of the thinnest cross section.
For the optimal dimensioning of the flexure hinges in the high-precision micro manipulator (Ivanov and Corves, 2013, 2014), the maximum von Mises stress was estimated in the above described manner. A finite element model was created to calculate the stress factorsσx/Fx,σx/Fy,σx/Fz,σx/My, σx/Mz,τxy/Mx andτxz/Mx for 25 flexure hinges
combin-ing the followcombin-ing geometry parameters:R=2.0, 2.5, 3.0, 3.5, 4.0 mm and t=0.2, 0.3, 0.4, 0.5, 0.6 mm (w=16 mm and
l=4 mm). The data points were fitted by empirical 3rd or-der polynomial functions. In the generic formulation of these empirical functions
sf=s0+s1·R+s2·R2+s3·R3 (6)
sf is a stress factor.s0,s1,s2ands3are polynomial coeffi-cients specified against the radius, separately for each mini-mum thickness. Fitting errors were radically reduced thereby. This is exemplarily illustrated for the stress factorσx/Mzin
Table 1.
3 Fatigue test bench
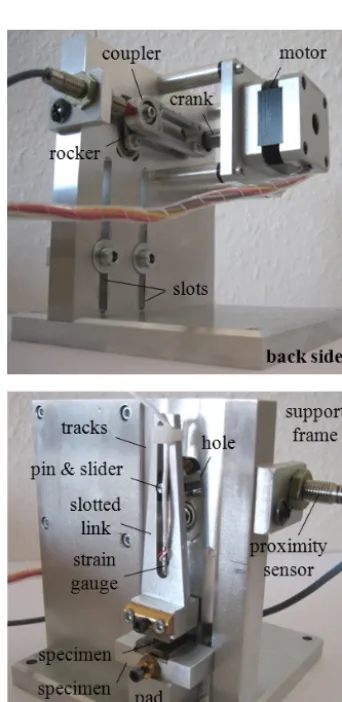
Stress is limited to yield strength for flexure hinges with quasi-static application. For those with dynamic application, the stress limit is to be redefined according to the fatigue be-havior of material in concrete circumstances. With this inten-tion, the flexure hinge specimens were examined in a fatigue test bench (Fig. 4).
The fatigue test bench relies on a crank-rocker mechanism that is enhanced by a slotted link. On the back side, a stepper motor (producer: Nanotec Electronic, type: ST4118S1006-A) actuates the crank, the rotation of which (ϕ=0–360◦) is transformed into the oscillation of the rocker (1 ψ= ±9.6◦) over a coupler. The pin of the joint between the coupler and the rocker passes through a hole in the support frame and moves the slotted link over a slider, on the front side. The slotted link is elastically suspended by a flexure hinge spec-imen. The ends of the specimen are clamped between the slotted link and a specimen holder. The specimen holder is height adjustable on the support frame by means of tracks, slots and screws. It stands on the stack of pads of a specified thickness to ensure an exact height adjustment. The distance from the midpoint of the specimen to the pivot of the rocker can takeL=30–65 mm.
Figure 4.Fatigue test bench designed and realized at the Depart-ment of Mechanism Theory and Dynamics of Machines of RWTH Aachen University.
spring slightly pulls the slotted link to keep the two halves of the specimen apart from each other after fracture. The slot-ted link goes upwards as long as the slider does not reach a barrier. At the same time, the photo sensor registers failure and reports to break fatigue testing. In addition to the failure
monitoring system, the fatigue test bench is equipped with a pre-failure monitoring system. A strain gauge (producer: Micro-Measurements) is attached to the slotted link to indi-cate how the specimen is weakening with a growing num-ber of cycles before fracture. This is observed with the help of a digital storage oscilloscope (producer: Tektronix, type: TDS2024B) via a data acquisition system (producer: HBM, type: 3962) (Fig. 5).
The rating of the fatigue limit was necessary for the di-mensioning of the fatigue test bench. A theoretical fatigue limit ofσf(t )=510 MPa (Nf=107) for Ti-6Al-4V grade 5 (annealed bar) is valid in the case of standard (small, pol-ished) specimens under rotating bending in laboratory en-vironment (Boyer, 1986). Considering the Marin correction factors (Howell, 2001) and the fatigue notch factor (Boresi and Schmidt, 2003), a modified fatigue limit, relating to the flexure hinge specimens in comparison to the standard specimens, was rated atσf(m)=380–450 MPa (Nf=107). It and yield strength, which isσp0.2=830 MPa for Ti-6Al-4V grade 5 (annealed bar) (MatWeb, 2014), were denoted as the lowest and highest stress levels respectively. The maximum von Mises stress was restricted between them. In Fig. 6, the solid-line curve was plotted when calculating with a pre-scribed modulus of elasticity ofE=113.8 GPa for Ti-6Al-4V grade 5 (annealed bar) (MatWeb, 2014). As ultrasoni-cally measured values were smaller in the case of the flexure hinge specimens (E=103–112 GPa), the dashed-line curve was plotted when calculating with the minimum modulus of elasticity ofE=103.0 GPa. Accordingly, the maximum von Mises stress was expected within the hatched area for the dif-ferent height adjustments of the fatigue test bench.
4 Fatigue testing
Figure 5.Schematic representation of the fatigue test bench: (a) back side, (b) front side.
Figure 6.Maximum von Mises stress against the height adjustment of the fatigue test bench and the maximum rotation angle of the flexure hinge specimens (calculated by using a finite element model).
maximum von Mises stress that was exactly between those forL=35 mm andL=60 mm (Fig. 6).
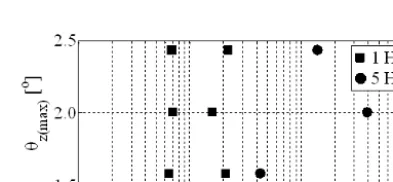
A total of 9 specimens were subjected to fully reversed cyclic loading starting from the original state up to failure (without stopping). On the basis of results obtained thereby, it was not possible to establish any correlation between the stress limit and the number of cycles. In other words, it could not be said that the maximum rotation angle decreases when increasing the number of cycles, or vice versa. At an operating frequency of 1 Hz, fatigue strength nearly agreed with the fatigue curves for Ti-6Al-4V grade 5 (annealed bar) (Boyer, 1986). The specimens even showed a better
Figure 8.SE images of the fracture surfaces of three specimens: (a)L=35 mm, (b)L=45 mm and (c)L=60 mm.
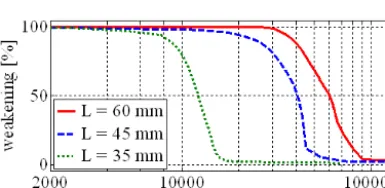
Figure 9.Performance degradation with a growing number of cy-cles for the different height adjustments of the fatigue test bench (at 1 Hz).
endurance than expected at an operating frequency of 5 Hz (Fig. 7).
During fatigue testing the specimens, a gap became visi-ble fairly early on the notch surface. This implied that crack propagation took time between crack initiation and fracture. Understanding the fatigue process in the flexure hinges was provided by means of secondary electron (SE) imaging at the Central Facility for Electron Microscopy of RWTH Aachen University (scanning electron microscope: ZEISS DSM 982 Gemini) (GFE, 2014).
Cracks appear at the sites of local stress concentration. Although metallurgical and technological imperfections can be present and act as potential stress raisers anywhere, local stress concentration normally occurred close to the thinnest cross section on the notch surfaces. Under cyclic loading, cracks gradually grew through the material reducing the min-imum thickness and thus the maxmin-imum stress (the maxi-mum rotation angle was constant for a height adjustment of the fatigue test bench, Fig. 6). Therefore, crack initia-tion was followed by crack propagainitia-tion that was decaying together with the maximum stress. It often happened that a specimen, the minimum thickness of which was already drastically reduced, stayed intact for a certain time. This explains a very large scatter of the data points, where the
Figure 10.Performance degradation with a growing number of cy-cles for the different height adjustments of the fatigue test bench (at 5 Hz).
Figure 11.Performance degradation with a growing number of cy-cles for the different qualities of the notch surfaces (L=60 mm, at 1 Hz).
specimens subjected to “higher” stress could endure more cy-cles than the specimens subjected to “lower” stress (Fig. 7). Finally, the remaining material failed with fracture when it was no longer able to carry cyclic loading. The above described fatigue process is easily recognized on the frac-ture surfaces of the specimens for the height adjustment
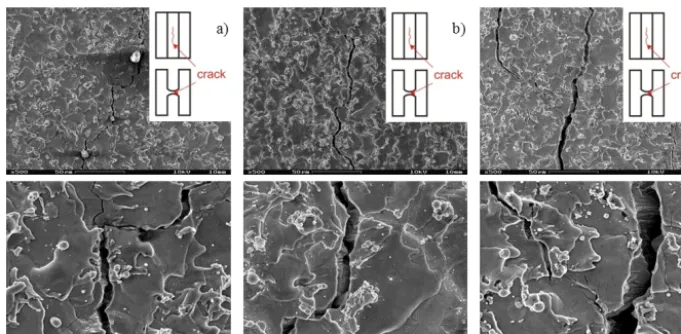
Figure 12.SE images of cracks on the notch surfaces of three specimens: (a) a decline of 25+25 %, (b) a decline of 25+50 % and (c) a decline of 25+50 %.
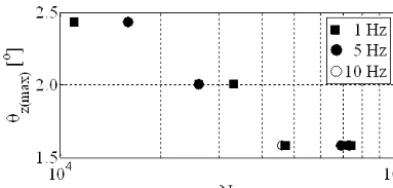
Accordingly, it was of vital importance to perceive a per-formance degradation that was caused by crack initiation and propagation in the flexure hinges. For this purpose, the pre-failure monitoring system was employed in the fatigue test bench. It indicated how the specimens were weaken-ing with a growweaken-ing number of cycles before fracture. Ob-served on the oscilloscope via the data acquisition system, a voltage from the strain gauge was proportional to stress in the slotted link, force on the pin and the slider, the stiff-ness of a specimens (Fig. 5). Emphasizing the intermediate interval of fatigue testing, in which the amplitude of the volt-age was changed, the number of cycles to 2×10³ (before the performance degradation) and from 1.3×10⁵(after the performance degradation) are cut away from the graphs in Figs. 9–10.
The graphs show that cracks appeared and grew most quickly forθz(max)=2.44◦(L=35 mm) and most slowly for θz(max)=1.59◦(L=60 mm). It seems, thereby, that fatigue
testing after crack initiation and propagation and before frac-ture took the most time forθz(max)=2.44◦(L=35 mm) and
the least time for θz(max)=1.59◦(L=60 mm). This can be
explained by the different thickness of the remaining ma-terial that finally failed with fracture (Fig. 8). In this inter-val, the amplitude of the voltage was only a few percent of its initial value, which implies a radical degradation of the performance of the specimens. The influence of the operat-ing frequency was considered, but no tendency was noticed (Figs. 9–10).
The pre-failure monitoring system was applied to a total of 11 specimens in the fatigue test bench. Recording rough-ness profiles was conducted at the Laboratory for Machine Tools and Production Engineering of RWTH Aachen Univer-sity (stylus instrument: MarSurf MFW 250) (WZL, 2014). Nine specimens from the second series had a nearly equal quality of the notch surfaces (Ra≈0.80 µm). Consequently,
the results obtained from fatigue testing were consistent for
all the specimens (Figs. 9–10). Two specimens from the first series had an unequal quality of the notch surfaces. This strongly affected the speed of the fatigue process. The speci-men withRa=0.83 µm exhibited weakening at about 105
cy-cles, i.e. a little bit later than the specimens from the second series. The specimen withRa=0.50 µm did not exhibit any
weakening at about 106cycles. These results were obtained forθz(max)=1.59◦(L=60 mm) at 1 Hz (Fig. 11).
Three specimens were treated in two phases. Fatigue test-ing was broken by a decline in the amplitude of the voltage of 25 % in the first phase and 25+25 % or 25+50 % in the sec-ond phase. In both phases, the specimens were subsequently proven in a static test bench (Ivanov and Corves, 2014). The declines in the amplitude of the voltage and stiffness were in accordance thereby. The notch surfaces were inspected by means of secondary electron (SE) imaging at the Central Fa-cility for Electron Microscopy of RWTH Aachen University (scanning electron microscope: ZEISS DSM 982 Gemini) (GFE, 2014). In the first phase, cracks could not be identified on the notch surfaces, despite obvious declines in the ampli-tude of the voltage and stiffness. With additional declines in the amplitude of the voltage and stiffness, cracks were iden-tified on the notch surfaces in the second phase (Fig. 12).
up to functional failure (threshold assumed at a decline of 25 %).
5 Conclusions
The phenomenon of functional failure was simultaneously analyzed for the specimens in the fatigue and static test benches as well as by means of scanning electron mi-croscopy. Hence, a reasonable correlation was established between the stress limit and the number of cycles up to func-tional failure. This enabled a successful prediction of fatigue strength for the flexure hinges to be optimally dimensioned in the high-precision micro manipulator.
It is assessed that a flexure hinge having the material prerties and the geometry parameters of the specimens can op-erate permanently up to 12 hours at 1 Hz with±1.59◦. This fatigue life is increased when decreasing the maximum ro-tation angle. Furthermore, it is substantially improved by a higher quality of the notch surfaces (Ra<0.50 µm instead of Ra≈0.80 µm).
Acknowledgements. This research has been performed within the framework of the first author’s PhD thesis as an initial contribu-tion to the project “Fundamental examinacontribu-tion of flexure hinges for the purpose of their implementation in high-precision micro manip-ulators” financially supported by the German Research Foundation (DFG) under Grant No. CO 282/13-1.
We are grateful to the Central Facility for Electron Microscopy and the Laboratory for Machine Tools and Production Engineering of RWTH Aachen University for cooperation in this research.
Edited by: G. Hao
Reviewed by: three anonymous referees
References
Bellouard, Y.: Microrobotics, Methods and applications, CRC Press, Boca Raton, 2010.
Boresi, A., P. and Schmidt, R. J.: Advanced mechanics of materials, John Wiley & Sons, New Jersey, 2003.
Boyer, H. E.: Atlas of fatigue curves, American society for metals, Materials Park, Ohio, 1986.
GFE – Central Facility for Electron Microscopy: RWTH Aachen University, Aachen, Germany, www.gfe.rwth-aachen.de, last ac-cess: April 2014.
Ivanov, I. and Corves, B.: Ein Ansatz zur Characterisierung stoff-schlüssiger Gelenke zwecks optimaler Auslegung eines Mikro-manipulators (An approach to the characterization of flexure hinges for the purpose of the optimal design of a micro manipu-lator), VDI-Berichte, 2175, 45–56, 2012c.
Ivanov, I. and Corves, B.: Characterization of flexure hinges and development of a high-precision micro manipulator, Proceedings of the 2nd international conference “Mechanical engineering in XXI century”, University of Niš, Niš, Serbia, 267–272, 2013. Ivanov, I. and Corves, B.: Stiffness-oriented design of a flexure
hinge-based parallel manipulator, Int. J. Mech. Design Struct. Mach., 42, 325–341, 2014.
KAPE Erodiertechnik GmbH & Co. KG, Germany, www.kape-erodiertechnik.de, last access: April 2014.
Lobontiu, N.: Compliant mechanisms, Design of flexure hinges, CRC Press, Boca Raton, 2010.
MatWeb: Material property data: www.matweb.com, last access: April 2014.
Paros, J. M. and Weisbord, L.: How to design flexure hinges, Mach. Design, 37, 151–156, 1965.
Pernette, E., Henein, S., Magnani, I., and Clavel, R.: Design of par-allel robots in microrobotics, Robotica, 15, 417–420, 1997. Pilkey, W. D. and Pilkey, D. F.: Peterson’s stress concentration
fac-tors, John Wiley & Sons, New Jersey, 2008.
Raatz, A.: Stoffschlüssige Gelenke aus pseudo-elastischen For-mgedächtnislegierungen in Parallelrobotern (Flexure hinges from pseudo-elastic shape memory alloys in parallel robots), Ph.D. thesis, Technical University of Braunschweig, Braun-schweig, Germany, 2006.
Schotborgh, W. O., Kokkeler, F. G., M., Tragter, H., and van Houten, F. J. A. M.: Dimensionless design graphs for flexure el-ements and a comparison between three flexure elel-ements, Precis. Eng., 29, 41–47, 2005.
Smith, S. T.: Flexures, Elements of elastic mechanisms, CRC Press, Boca Raton, 2000.
Smith, S. T., Chetwynd, D. G., and Bowen, D. K.: Design and as-sessment of monolithic high precision translation mechanisms, Rev. Scient. Instrum., 20, 977–983, 1987.
WZL – Laboratory for machine tools and production engineering: RWTH Aachen University, Germany, www.wzl.rwth-aachen.de, last access: April 2014.
Young, W., C. and Budynas, R., G.: Roark’s formulas for stress and strain, McGraw-Hill, New York, 2002.