Research Articl
e
Development and Physicochemical Characterization of a Functional
Mozzarella Cheese Added with Agavin
Myrna Martínez-Martínez
1, Jorge F Vélez-Ruiz
1,2*1
Chemical and Food Engineering Department, University of the Americas Puebla, Ex Hacienda Santa Catarina
Mártir, Cholula, Puebla, Mexico
2FN Consultores, SA de CV Institute of Innovation and Technological Development, Boulevard del Niño Poblano,
Territorial Unit Atlixcayotl, Puebla, México
*Corresponding Author:
Jorge F Vélez-Ruiz, Chemical and Food Engineering Department, University of theAmericas Puebla, 72810, Ex Hacienda Santa Catarina Mártir, Cholula, Puebla, Mexico, Tel: (222) 2370117; E-mail:
jorgef.velez@udlap.mx
Received: 24 April 2019; Accepted: 06 May 2019; Published: 20 May 2019
Abstract
In recent years worldwide, the manufacturing and consumption of functional foods have augmented importantly.
Dairy products are nutritive and highly consumed while functional foods improve consumer health. A Mozzarella
cheese added with agavin, was formulated, prepared, characterized and studied in order to know its properties,
influenced by three variables: concentration of agavin as a prebiotic component, pre-acidification as part of the
manufacturing process and storage time. The effect of each variable was different, the incorporation of agavin
(0.7-3.3%) improved the nutritional value (fiber) and properties such as luminosity, texture and elasticity. The
pre-acidification (0.0375%) stage augmented the acidity and improved some functional and physical properties. Both
variables did not influence acceptation by the consumer, thus the assessed cheese samples had good sensory scores.
Whereas the storage time (1, 11, 21 and 31 days) in which the properties were analyzed, recorded a decreasing trend
in moisture content and pH, with low net color changes, and variable changes in texture.
Keywords:
Mozzarella cheese; Functional dairy food; Physicochemical properties; Prebiotic; Agavin1. Introduction
In the world’s context, cheese consumption has increased over the years, observing high demand for two groups,
fresh and pasta filata cheeses, depending on the socioeconomic conditions and customs of each region. Mozzarella is
part of the pasta filata cheeses, it was originally made from buffalo milk, but now it is produced from cow milk in
structure of the para-casein matrix obtained through the manufacturing process. This cheese has a semisolid and
plastic-curd consistency, and through heating, it develops its meltability and stretchability [1-7]. Its industrial
production and consumption have augmented through the years.
Both, texture and functional properties of Mozzarella cheese result from its formulation and manufacturing process,
therefore the cheese composition and process conditions should be controlled in order to obtain a dairy product with
desirable characteristics [8-13]. The meltability as the capacity to melt on heating is directly influenced by factors
such as calcium, fat content, moisture content, pH and nitrogen fractions [13, 14] and the stretchability as the ability
to elongate and form strings under the effect of the applied forces and temperatures, is also influenced by several
factors from the raw milk to post-manufacturing conditions, being the curdling stage used to obtain the linearity of
protein chains in its structure [4]. Further, the direct pre-acidification of milk previous to the coagulation stage, with
organic acids to substitute the slow acidification by thermophilic microorganisms, is one of the practical variations
through the Mozzarella cheese manufacturing, accelerating the process time and offering advantages in the
cheddaring stage [1, 7, 14, 15, 16].
On the other part, prebiotics as functional ingredients have proven their beneficial effect in humans, such as a better
immune response, possible protection against cancer and the reduction of the cardiovascular diseases. These
components selectively stimulate the growth and activity of a limited number of bacteria at the colon; particularly
the non-digestible oligosaccharides, that are the most studied and recognized substrate [13, 17-22]. Inulin is a GRAS
compound, it has a neutral soft flavor and is a soluble prebiotic polymer of easy incorporation into aqueous systems,
like beverages and dairy products. It provides dietary fiber, prebiotic benefits [13, 23] and textural attributes in dairy
products [24-26]. Agavin is a variety of inulin, representing a potential source of fructo-oligosaccharides (FOS) with a β-configuration at the second anomeric carbon, which produces the resistance to hydrolysis from human enzymes
[27], also FOS take effect on lipid metabolism and reduce risk of colon cancer. Agavin was recognized by
Roberfroid and Slavin [28] with a similar behavior than the inulin chicory, to increment the Bifidobacteria
microorganism growth in humans.
Dairy products are important food matrices in which probiotic bacteria and prebiotics have been supplemented in,
generating products with an excellent reputation among consumers [10, 18, 29]. Therefore, the dairy industry has
modified several existing items and developed novel ones with healthy properties, such as products with decreased
fat, with fortification of minerals and vitamins, with incorporation of omega-3 and fiber [30-32], among other
modifications and innovations. Now in our days, foods are judged, selected and purchased, not only in terms of
taste, satisfaction and nutritional value, but also in terms of their capacity to improve health and well-being for
consumers. It is widely recommendable and convenient to enrich a dairy product of high demand, such the
Mozzarella cheese, generating a functional food or prebiotic cheese that contributes to disease prevention, health benefits, and consumer satisfaction, beyond its nutritive value. The manufacture of probiotic cheese favored by
Even though, several studies have been completed to analyze and know the effect of different compositions [4, 14,
33], processing changes and post-manufacturing factors [8, 12], the incorporation of a new ingredient and
manufacturing process modifications for Mozzarella cheese, will cause different effects that should be studied and
known. Thus, the objective of this research was to determine the effect of agavin addition as a prebiotic compound
in a Mozzarella cheese type and to know the effect of lactic acid incorporation as part of the manufacture process,
studying its physicochemical and physical properties and also assessing the sensory acceptance of the elaborated
functional cheese; analyzed as a fresh dairy product and during its storage.
2. Materials and Methods
2.1 Materials
Five brands of commercial pasta filata cheeses: Mozzarella (La Esmeralda, Mexico), Manchego (Nestlé, Mexico),
Emmental (Lactalis International, France), Oaxaca (Lala, Mexico) and Provolone (La Clette, France) were
characterized to have a commercial frame of comparison. Those materials utilized for cheese making were obtained
from a local supermarket and some commercial suppliers. Pasteurized whole milk with 3.2% fat (Alpura, Mexico),
sodium chloride (La Fina, Mexico), drinkable water (Ciel, Mexico). Prebiotic powder fiber from the agave, called
agavin (Bioagave® CP Ingredients, Mexico), lactic bacteria starter (Streptococcus thermophilus) (Danisco
Mexicana, Mexico), rennet coagulating liquid (Cuamex, CHR Hansen, Mexico), lactic acid (85%) (Cedrosa,
Mexico) and calcium chloride (Omnichem®, Mexico).
2.2 Manufacture of Mozzarella type cheese
By following the process methodology of Zisu and Shah [14] and Jana and Mandal [11] with some small
modifications, twelve batches of Mozzarella cheese were manufactured in two stages that were identified as specific
systems, utilizing 8 L of pasteurized whole milk (3.2% fat) for each batch. Two of them without agavin, in which
one was without lactic acid and the other with it, both were considered as control systems (C1 and C2). The other
ten systems or samples (S1 to S10) were prepared, including different levels of agavin (0.70-3.33%), four of them
without acid (S1, S2, S5 and S6), and six with the lactic acid addition (S3, S4, S7, S8, S9, S10) as it is shown in
Table 1. The concentration levels of agavin were considered as appropriate by other authors and by ourselves, based
on our previous formulation tests.
Cheese system Agavin (%) Lactic acid (%)
C1 0 0
C2 0 0.0375
S1 0.70 0
S2 1.11 0
S3 0.70 0.0375
S4 1.11 0.0375
S6 3.33 0
S7 1.65 0.0375
S8 3.33 0.0375
S9 0.90 0.0375
S10 1.40 0.0375
Table 1:Mozzarella type cheese systems (with levels of agavin and lactic acid).
Therefore, three variables were considered: i) agavin concentration (0.70, 1.11, 1.65 and 3.33%), ii) lactic acid
presence (0.0375%) or none, and iii) storage time (1, 11, 21 and 31 days). Each batch was inoculated with S.
thermophillus at a concentration of 0.002% (w/w), in which the milk was tempered up to 37°C and kept during 40
min. The agavin was added to a small volume of heated milk until its total dispersion, and lately incorporated to the
correspondent batch. All systems included CaCl2 (0.01% w/w) as part of the formulation. Seven batches (C2, S3, S4,
S7, S8, S9 and S10) were pre-acidified by direct addition of lactic acid (0.0375% v/v). Milk of every batch was
coagulated with a rennet commercial liquid (0.015% v/v) at 36°C and held 1 h without agitation. Formed curd was
cut in cubes of 0.5 cm, and after cubing, the curd was cooked through, 20 min while the temperature gradually was
increased up to 40°C. After heating the whey was drained at pH 5.4 and the curd was cheddared into slabs and
maintained until reach a pH of 5.2. Then, every system was hand stretched for 3 minutes in hot water at 85°C, with a
volume of water 2.5 times the weight of the curd. The slabs were weighed and the cheese blocks were formed, in
which salt (1.5% w/w) was added for rubbing action, and held 1 hour while the product temperature decreased.
Finally, all systems or samples were stored at refrigeration (6°C ± 1) into plastic bags, and analyzed at days 1, 11, 21
and 31.
2.3 Physicochemical analysis
The Mozzarella cheese systems were analyzed with standard methods from AOAC [34]. Moisture measuring was
based on water evaporation, protein was measured by micro-Kjeldahl, while fat content was quantified with the
Mojonnier method. pH was determined with a digital potentiometer UB-5 (Denver Instruments, NY, USA). Acidity
was quantified with a titratable method using NaOH 0.1 N, and expressed as percentage of lactic acid for milk, in
samples of 20 mL, by method 947.05 [34]. Whereas cheese acidity, in which method 920.124 was followed [34],
utilized 10 g of cheese mixed with 105 mL of water at 40°C, thus after complete mixing and filtering, 25 mL of
filtered liquid was used for titration. For total dietetic fiber (TDF) determination, also an official method (985.29,
[35]) was considered; after fat removal and drying of the sample an enzymatic digestion (α-amylase, protease,
amylo-glucosidase) was applied to finish with the washing and purification of the insoluble fiber. TDF was
determined at first day and only for some cheese systems. All physicochemical analyses were carried out by
2.4 Physical determinations
2.4.1 Color: A color measuring instrument (Gardner System 05, Hunter Labs, Reston, VA, USA) was used to obtain the L, a and b Hunter parameters of the cheese systems and to calculate the net change of color in accordance to
equation 1.
√( ) ( ) ( ) (1)
Where: Li, aiand biare the correspondent parameters at different days (11, 21 and 31), whereas Lo, ao and boare the
reference or initial data (day 1).
2.5 Texture analysis
Textural parameters of cheeses including compression, penetration and TPA tests [36] were carried out with a
Texture Analyzer TA.XT2 (Texture Technologies Corporation, Scardale, NY, USA) at room temperature (22°C).
Cheese samples were shaped using a cylindrical probe with 2 cm diameter and 1.5 cm height, each sample was
allowed to equilibrate at room temperature during 10 min after its removing from refrigerated storage. For
compression test, the samples were compressed up to 50% of their original size at a speed of 0.5 mm/s with a plate
of 3.6 cm diameter. The penetration test was carried out with a needle of 5 mm diameter at a speed of 1.7 mm/s, and
the samples were penetrated 50% of their original size. Other textural characteristics of the cheeses, including
hardness, cohesiveness and springiness were assessed by a TPA test, with the same cylindrical samples and using a
speed of 1 mm/s, applying a double compression, with a plate of 3.6 cm diameter, until the 80% of their original
size, as recorded by the Texture Analyzer instrument.
2.6 Elongation and meltability
The elongation test was completed by adapting the reported method from Reid and Yan [8]. A designed hook fixture
was adapted to the Texture Analyzer TA.XT2 and used to evaluate the stretchability of the Mozzarella samples.
Cheese sample was cut as a plate shape of 3.0 cm long and 1.25 cm wide, it was subjected by two sides (central
extreme points), fitting a rate of 1 mm/s, with a maximum elongation of 5.0 cm, thus recording the rupture force [8,
37]. This test was applied to the cheese system, before and after-melting of samples heated during 1 min in a
microwave and lately held out 1 min to cool down, at the different days of storage. For meltability a test modified
from the Schreiber one, was utilized with cheese samples of 2 cm of diameter and 1 cm of thickness. Sample after
refrigeration (4°C-30 min) was placed in a glass Petri dish (with filter paper) and then heated in an oven at 200°C
for 1 min. After melting, four measures were taken at each direction (45°) [8, 38], computing the meltability
capacity in accordance with the equation 2.
× 100 (2)
Where: MC is the melting capacity (%), Df is the final average diameter (cm), and Di is the initial diameter (cm), for
2.7 Viscoelastic properties
A stress-controlled Universal Dynamic Rheometer (Paar Physica UDS 200, Germany) was used to obtain the
viscoelastic properties of Mozzarella samples employing a parallel-plate fixture. Cylindrical samples of the same
size (2.0 cm diameter, 1.5 cm height), previously equilibrated at room temperature (21°C), were utilized for
viscoelasticity measurements. Once that the linear viscoelastic region was determined by a stress sweep; a frequency
sweep over the range of 0.01-10 Hz was performed, the values of the storage modulus (G'), loss modulus (G'') and loss tangent angle (δ), were obtained as a function of frequency and recorded by using the Rheoplus software 32
V2.81.
2.8 Sensory assessment
Sensory tests were carried out with only five systems and only two levels of agavin, the selected samples were C1 as
the control, and S1, S2, S3 and S4 as representative of the lower agavin levels, in which two of them included the
lactic acid as part of the manufacturing process. Samples with higher levels of agavin were not available. The
assessment was completed at room temperature by utilizing a hedonic scale with a magnitude of 5 for maximum
like, and 1 for maximum dislike. The test was completed with 25 non trained judges (students and workers), in
which the questionnaire was divided in 2 parts: the first one corresponded to a general acceptability of the product,
evaluating color, flavor and appearance; whereas the second part corresponded to the textural acceptability of
hardness, chewiness, and springiness; terms that were defined to the judges, but without a training process.
2.9 Statistical analysis
ANOVA of the General Linear Model type from the Minitab package (V.16 Minitab Inc., State College,
Pennsylvania, USA) with 3 factors was carried out, to study the effects of the agavin addition, pre-acidification and
shelf life.
3. Results and Discussion
In order to elaborate and study a functional Mozzarella type cheese, two experimental stages were completed. The
first and shorter part, in which a compositional analysis of five commercial cheeses of pasta filata type was carried
out, in order to obtain a comparative frame of the Mozzarella cheese characteristics. And a second and long stage, as
the most important of this research, included some modifications that were incorporated through the cheese
manufacturing process. Measuring the sample properties at different storage times.
3.1 Characterization of commercial cheeses
Five brands of pasta filata cheese were acquired and analyzed, they corresponded to Mozzarella, Manchego, Oaxaca,
Emmental and Provolone types, using 2 replicates of each one for physicochemical determinations. Thus, ten
samples were utilized for this purpose. The measured mean composition values exhibited a moisture range of 20.2%
(± 0.20) for Emmental, to 35.9% (± 1.22) for Oaxaca; a fat range of 17.5% (± 0.84) for Provolone, to 47.4% (± 1.66)
protein/fat ratio of 0.36-1.29. A range of 0.03 to 0.09% was quantified for acidity and a pH between 4.41 and 5.47
was also determined. In color parameters, a range of 57 to 75 for luminosity, -5.0 to 2.5 for redness and 16 to 22 for
yellowness were recorded. As expected, these determinations, although representative of meltable commercial
cheeses, were importantly affected by the time passed since they were manufactured, and as expected all of them
showed varied moisture and fat contents with tendency to white-cream colors.
Mozzarella cheese showed the next averages: 25.9% for moisture, 47.3% for fat, 18.4% for protein (0.39 protein/fat
ratio), 0.09 for acidity, 5.1 for pH and 74 for L, -4.3 for a, 21.5 for b, respectively. Gunasekaran and Ak [39]
included a typical composition of a variety of cheeses, such as Cheddar with moisture of 36.7%, Provolone 40.9%
and Mozzarella 54.1%, emphasizing the influence of the making process, formulation, degree of ripening and time
of retailing on cheese composition. Therefore, it can be assumed that the difference in moisture between commercial
and reported cheeses from some studies, are due to the freshness and elapsed time of manufacturing. Cheeses from
the supermarket have experimented biochemical and physical changes through the shelf time.
Ismail et al. [4] prepared Mozzarella cheese to improve their properties by adding some ingredients, such as
denatured whey protein, quantifying high fat percentages in a range of 26.4 to 34.5. Sulieman et al. [40] also
manufactured Mozzarella cheese from cow milk and studied the effect of time (30 days), recording some augments
in pH from 4.93 to 5.21, in protein from 17.7 to 26.1% and in fat also, from 15.1 to 24.9%. This work showed an
important increase in component contents influenced by the storage period and attributed to the water evaporation
happened through it. That most likely was the physical situation with the analyzed commercial samples of our study.
Ma et al. [12] also conducted a research, manufacturing Mozzarella cheeses in a wide range of compositions and
production processes, to have three groups with different fat content obtaining a protein/fat ratio of 0.71 and a
draining pH of 5.9, for the high fat content group. Therefore, and as it has been recognized, the composition and
properties are functions of the formulation, manufacturing process and storage time. Then, from the measured and
reported parameters, a diversity of Mozzarella cheese characteristics has been and can be found
3.2 Development of the functional Mozzarella type cheese
With respect to the manufacturing process, the modifications incorporated in this work were next:
i. Cow milk with 3.2% fat.
ii. Addition of agavin, as a functional ingredient. Once the agavin was diluted in milk, this milk was mixed by
agitation with the rest of standardized milk up to complete a batch of eight liters, at the four aforementioned
levels.
iii. Addition of lactic acid at a concentration of 0.375% as a pre-acidification step being previous to the
addition of rennet, in seven of the ten analyzed systems.
The rest of the manufacturing process was previously described in the methodology, by following to Zisu and Shah
3.3 Physicochemical characteristics
3.3.1 Composition: The cow milk used for the manufacturing of the functional Mozzarella type cheese exhibited a typical composition, moisture 87.37% ± 0.05, fat 3.2% ± 0.06, acidity 0.318% ± 0.06, pH 6.65 ± 0.01. With this
milk, all the cheeses were manufactured following the different formulations or cheese systems, in which a yield of
11-7 to 13.1% (w/w) was obtained. The proximal composition and physicochemical properties corresponding to the
studied cheese systems are included in Table 2.
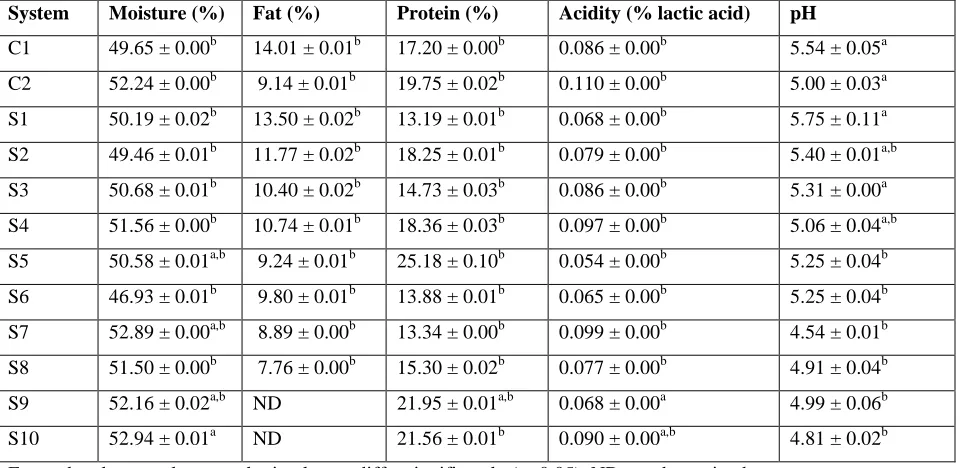
System Moisture (%) Fat (%) Protein (%) Acidity (% lactic acid) pH
C1 49.65 ± 0.00b 14.01 ± 0.01b 17.20 ± 0.00b 0.086 ± 0.00b 5.54 ± 0.05a
C2 52.24 ± 0.00b 9.14 ± 0.01b 19.75 ± 0.02b 0.110 ± 0.00b 5.00 ± 0.03a
S1 50.19 ± 0.02b 13.50 ± 0.02b 13.19 ± 0.01b 0.068 ± 0.00b 5.75 ± 0.11a
S2 49.46 ± 0.01b 11.77 ± 0.02b 18.25 ± 0.01b 0.079 ± 0.00b 5.40 ± 0.01a,b
S3 50.68 ± 0.01b 10.40 ± 0.02b 14.73 ± 0.03b 0.086 ± 0.00b 5.31 ± 0.00a
S4 51.56 ± 0.00b 10.74 ± 0.01b 18.36 ± 0.03b 0.097 ± 0.00b 5.06 ± 0.04a,b
S5 50.58 ± 0.01a,b 9.24 ± 0.01b 25.18 ± 0.10b 0.054 ± 0.00b 5.25 ± 0.04b
S6 46.93 ± 0.01b 9.80 ± 0.01b 13.88 ± 0.01b 0.065 ± 0.00b 5.25 ± 0.04b
S7 52.89 ± 0.00a,b 8.89 ± 0.00b 13.34 ± 0.00b 0.099 ± 0.00b 4.54 ± 0.01b
S8 51.50 ± 0.00b 7.76 ± 0.00b 15.30 ± 0.02b 0.077 ± 0.00b 4.91 ± 0.04b
S9 52.16 ± 0.02a,b ND 21.95 ± 0.01a,b 0.068 ± 0.00a 4.99 ± 0.06b
S10 52.94 ± 0.01a ND 21.56 ± 0.01b 0.090 ± 0.00a,b 4.81 ± 0.02b
For each column, values not sharing letters differ significantly (p<0.05). ND-not determined
Table 2:Physicochemical characteristics of the formulated and analyzed Mozzarella cheeses at day 1.
It may be observed that the prepared systems showed a relative low moisture (>46.9% and <52.9%) and high fat
content (7.70-14.0%) in an inverse relationship, in which the fat content of the cheese was conditioned by the
standardization of the utilized milk. Similar moisture content (48-57%) was expressed by Guinee et al. [33] for
Mozzarella cheese; whereas similar fat content was reported by Ma et al. [12] and Zisu and Shah [14], for those
Mozzarella cheeses identified as a low-fat content group, with 11.4% fat and 7.71-9.44%, respectively. While Zisu
and Shah [14] reported a moisture range of 52.8 to 60.3% using fat-replacers, and Ismail et al. [4] recorded a
moisture content higher to 84% using denatured whey protein, for their studied Mozzarella cheeses. High humidity
and low-fat values were correlated by Hernández et al. [41] in their study, in which the high volume of water
contributed to a minor fat content retention in the molecular space of the cheese. In other work, Zisu and Shah [14],
established that the presence of agavin increased the moisture retention and competed by a molecular space in the
protein matrix. Further the pre-acidification also contributed to higher moisture content of our studied low fat
system S5 presented the highest value, and giving eight of the ten analyzed systems a fat/protein ratio range of
0.39-1.10.
It may be considered that the manufacturing process and particularly the pre-acidification stage contributed to
increase the hydration phenomenon in C2, S4, S7, S8, S9 and S10 cheeses with higher moisture content (>51.5%).
The statistical analyses of the composition showed that agavin addition influenced significantly (p<0.05) the
moisture, protein, acidity and pH values of the studied cheese systems, but did not affect their fat content. The
increase in moisture obtained with respect to the control C1, for those systems including agavin, with the exception
of systems S2 and S6, may be attributable to the presence of oligosaccharides from it.
The last comment is in agreement with Leewah et al. [42], who cited that the fiber content has been related to water
retention in food systems, due to its capacity for chelation, dissolution and emulsification; being the case of the
agavin added to the studied Mozzarella cheese formulations. Franck [24] also cited a good water retention capacity
for the chicory inulin, forming a three-dimensional network. Taking account of the analyzed cheese composition,
with 46.9-52-9% moisture and 7.7-14% fat, the prepared systems of our study may be considered as low moisture
Mozzarella cheeses, cited also as part-skim by Kindstedt and Fox [1], and similar to the classification cited by
Muliawan and Hatzikiriakos [43], and by Ayyash and Shah [44]. The obtained yields in this study (11.7-13.1%) are
up than those obtained (7.71-9.44%) for low fat Mozzarella cheeses by Zisu and Shah [14].
3.3.2 Fiber determination:Even though all cheese systems (none control) were added wit agavin, only five of them (S4, S5, S6, S7 and S8) and one control (C2) were used to the determination of TDF on the first day. The quantity of
TDF measured for C2 was the reference, and as it was expected the fiber was higher for the five cheese systems
(>2.44 g/100 g ± 0.35), that was related to the agavin concentration. Thus, this food item could contribute to the
recommended daily fiber consumption by different countries: Colombia with 15-20 g, France 25-30 g, Japan 20-30
g, Mexico 35 g, Netherlands 30-40 g, South Africa 30-40 g, USA 18-21 g, world >25 g, just to mention some [45],
in addition to the other nutritive components of Mozzarella cheese.
3.3.3 Storage: With respect to the storage, a general and small decreasing in moisture content was observed, consequently an increasing in the other cheese components was recorded, being both changes in combination with
biochemical transformations. The quantified composition for the studied systems (data not included) exhibited some
changes, mainly detected between day 1 and day 21, with a magnitude lower than 1.2% in moisture. Some systems
(six of fourteen) continued with water loss up to day 31 (<1%), in contrary to the rest of them, that gained a little of
water from day 21 (<1.8%). Therefore, a significant effect (p<0.05) of the storage time on cheese moisture was
obtained. As consequence of the moisture loss, proteolysis and lipolysis reactions, the studied cheeses exhibited the
next variations after 31 days of storage: proteins suffered a small decreasing (less than 3%), whereas fat recorded
1-5% of decreasing. At the beginning (day 1) the pH ranged from 4.5-5.8 (Table 2), considered as convenient values
Higher pH values corresponded to cheese systems without acid addition (C1, S1, S2, S5 and S6) with exception of
S3 system with higher pH than S5 and S6. These pH values are comparable to those reported (5.4-5.9) by Guinee et
al. [33] for low moisture Mozzarella cheeses. This parameter decreased through the storage time to 4.3-5.5 (data not
shown). The percentage of lactic acid varied from 0.054 to 0.110 in the fresh cheeses, and the relative high acidity
(>0.090) for systems C2, S4, S7 and S10, is due to the direct addition of this acid. The lactic acid augmented in most
of the systems (eight of twelve) with the time and decreased lightly in the rest of them, as a consequence of the
metabolic activity due to bacteria development, proteolysis and lipolysis processes proper of the Mozzarella cheese.
Two of the studied variables, acidification and storage time influenced significantly (p<0.05) both parameters, pH
and lactic acid. The agavin had a certain effect, but it was not significant.
In general, the physicochemical properties presented variation due to the formulation (agavin adding),
manufacturing process (acid addition, Table 1) and biochemical changes during storage. It is clear that the
comparison among Mozzarella cheeses from different composition and varied manufacturing process is limited,
because the presence of all components and how they were transformed, affecting the physicochemical, rheological,
textural and sensory properties of each specific system.
3.3.4 Color determinations:The color is a very important quality and physical property of foods. Then, the Hunter parameters of prepared cheese systems were evaluated to know the effect of the studied factors. Overall and as it
was expected, the color of cheese systems was of green (negative a) and yellow tones (positive b), with creamy and
luminous external appearances. The evolution of these parameters through the analyzed storage period is presented
in Tables 3-6. The luminosity decreased, whereas the other two parameters showed small variations in magnitude.
System L a b
C1 84.835 ± 083 -2.395 ± 0.16 13.185 ± 0.70
C2 78.000 ± 0.91 -2.260 ± 0.06 8.680 ± 0.04
S1 82.400 ± 0.95 -2.225 ± 0.35 12.415 ± 1.10
S2 81.285 ± 0.12 -2.480 ± 0.20 12.520 ± 1.29
S3 80.395 ± 0.05 -2.325 ± 0.33 11.960 ± 0.91
S4 80.765 ± 0.53 -2.170 ± 0.16 11.250 ± 1.39
S5 80.195 ± 2.72 -3.605 ± 0.15 11.370 ± 1.44
S6 78.125 ± 2.10 -3.550 ± 0.03 11.850 ± 1.12
S7 81.575 ± 2.68 -2.840 ± 0.06 11.855 ± 0.62
S8 81.775 ± 1.12 -2.775 ± 0.11 11.800 ± 0.75
S9 86.205 ± 1.12 -2.430 ± 1.95 12.060 ± 1.95
S10 78.830 ± 1.12 -3.760 ± 0.64 11.620 ± 0.06
System L a b ΔE
C1 81.155 ± 0.25 -3.235 ± 0.11 13.145 ± 0.29 3.77
C2 78.725 ± 0.19 -3.300 ± 0.04 10.685 ± 0.09 1.43
S1 81.140 ± 0.49 -3.560 ± 0.07 12.295 ± 0.08 1.84
S2 77.270 ± 3.75 -3.405 ± 0.12 13.295 ± 0.43 4.19
S3 74.145 ± 2.34 -2.870 ± 0.03 12.010 ± 0.40 6.27
S4 77.160 ± 0.86 -2.975 ± 0.21 11.685 ± 0.33 3.72
S5 76.41 ± 2.48 -3.015 ± 0.06 12.265 ± 0.27 3.93
S6 74.965 ± 1.11 -2.995 ± 0.08 12.895 ± 0.55 3.37
S7 82.67 ± 0.51 -2.785 ± 0.18 13.485 ± 0.29 1.96
S8 81.845 ± 1.92 -2.740 ± 0.18 13.415 ± 0.51 1.62
S9 85.565 ± 0.08 -1.905 ± 0.11 12.425 ± 0.16 12.16
S10 83.640 ± 0.44 -2.680 ± 0.81 12.965 ± 0.11 2.83
Table 4:Color parameters for Mozzarella cheeses at day 11.
System L a b ΔE
C1 79.845 ± 0.62 -4.240 ± 0.00 12.640 ± 0.03 5.35
C2 59.095 ± 0.07 -2.555 ± 0.11 8.365 ± 0.02 19.05
S1 75.710 ± 0.91 -4.200 ± 0.04 12.330 ± 0.24 6.97
S2 78.625 ± 1.93 -3.535 ± 0.11 12.700 ± 1.94 2.87
S3 75.210 ± 3.13 -2.985 ± 0.08 12.440 ± 0.79 5.25
S4 77.490 ± 1.05 -3.325 ± 0.25 11.960 ± 1.06 3.54
S5 77.910 ± 0.07 -3.080 ± 0.31 12.995 ± 0.87 2.85
S6 78.795 ± 2.13 -3.235 ± 0.11 14.04 ± 0.36 2.31
S7 75.600 ± 1.27 -2.880 ± 0.17 12.25 ± 0.18 5.99
S8 77.61 ± 0.03 -2.770 ± 0.13 13.00 ± 0.02 4.33
S9 52.245 ± 0.98 -2.060 ± 1.79 7.250 ± 0.06 13.014
S10 56.200 ± 0.02 -2.525 ± 1.03 8.845 ± 0.08 26.01
Table 5:Color parameters for Mozzarella cheeses at day 21.
System L a b ΔE
C1 79.780 ± 0.04 -3.475 ± 0.12 13.850 ± 0.49 5.21
S1 77.395 ± 3.42 -3.320 ± 0.10 12.400 ± 0.99 5.12
S2 77.670 ± 0.69 -3.395 ± 0.04 12.645 ± 0.02 3.73
S3 78.315 ± 0.22 -3.205 ± 0.06 12.965 ± 0.77 2.47
S4 81.695 ± 0.36 -3.315 ± 0.09 13.555 ± 0.29 2.74
S5 78.065 ± 0.74 -3.040 ± 0.31 12.545 ± 0.29 2.50
S6 77.55 ± 2.08 -2.690 ± 0.01 12.595 ± 1.49 1.27
S7 74.405 ± 0.05 -2.750 ± 0.07 12.645 ± 0.29 7.21
S8 75.800 ± 0.58 -3.210 ± 0.18 14.095 ± 0.01 6.42
S9 53.155 ± 0.06 -2.005 ± 3.68 6.870 ± 0.18 9.80
S10 56.595 ± 0.56 -2.030 ± 0.32 7.250 ± 0.07 26.27
Table 6:Color parameters for Mozzarella cheeses at day 31.
It may be observed (Table 3) that fresh cheese showed a high luminosity (L>78), in which S5 with -11.4 and S10
with -11.3 presented the highest a (negative) values at day 1, while S1 and S2 had the highest b values (>12.4).
Small variations were recorded at day 11 (Table 4), a decreasing in luminosity (L>74) and an increasing in a and b
parameters were recorded, that was more notable with the storage time, L>52 at days 21 and 31. Most of the cheeses
exhibited lower values of b with respect to C1 that was the cheese control with higher fat content. These results
indicate that agavin influenced the natural color of cheeses, decreasing the light green-yellow appearance typical of
dairy products, due the presence of carotenoids and vitamin B12 [47]. Furthermore, the yellowness was the highest
for S2 at day 1, for S7 at day 11, for S6 at day 21 and for S8 at day 31, attributed to the formulation, manufacturing
process and biochemical changes developed through the storage.
From color data, recorded at days 1, 11, 21 and 31 (Tables 3-6, respectively), it was obtained a significant influence
(p<0.05) of agavin on redness and yellowness parameters. The luminosity (>74 in all systems at days 1 and 11) was
not significantly affected by the agavin presence, but it was influenced by the pre-acidification. Alvarez et al. [48]
determined that high moisture content was related to an increasing in luminosity of cheeses. Even though they have
a high water content, three cheese systems (C2, S9 and S10) showed an important decreasing in L (>52) at days 21
and 31, expressing the effect of storage time. For the net change of color (Tables 4-6), three cheese systems, S2
(1.11% of agavin and without addition of lactic acid), S3 and S9 (with lower agavin and pre-acidified) exhibited a
higher net change of color (4.2, 6.3 and 12.2, respectively) at day 11. Whereas systems C2, S9 and S10, changed
more their color (19.0, 13.0 and 26.0, correspondently) at day 21; the same last three cheeses, C2 with 22.5, S9 with
9.8 and S10 with 26.3 for ΔE showed the higher values at day 31. Even though these variations of color, the net
change (ΔE) as the overall color change parameter evaluation (1.3-26.3), did not show any significant difference
(p>0.05), then it may be considered that minimal color changes were developed during the shelf life of these
3.3.5 Textural and rheological parameters:Due to the fact than cheese samples were prepared at different stages. No all the systems were characterized using the same textural tests; then the texture and rheology were only
evaluated in some of the cheese systems, the correspondent samples will be specified.
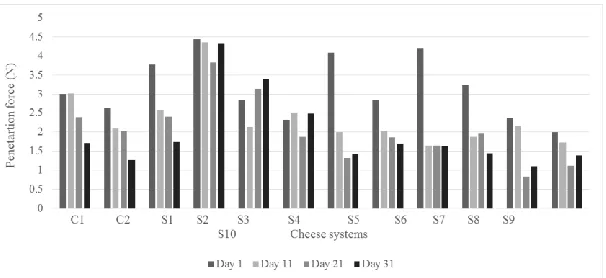
3.3.6 Compression and penetration forces: Both textural tests were recorded the same days of storage for all cheese systems (Figures 1 and 2). The values obtained in the compression test ranged from 4.5 to 30 N, being those
systems with agavin (S2, S7, S5 and S6 at the first day) that exhibited the higher magnitudes at the first day.
Whereas for penetration measuring the forces were lower, in the range of 0.9 to 4.4 N, corresponding similarly the
higher values to cheese systems added with agavin (S2, S7, S5, S1 and S8) at the first day, the specific values are
observed in Figures 1 and 2. In agreement with Zisu and Shah [14], the pre-acidification treatment could increase
the proteolysis reactions contributing to alter forces. These recorded forces express how the mechanical device took
more effort to advance against the whole sample in compression and it was lower to penetrate just the central zone
of the cheese sample, respectively. Giving the agavin more physical resistance into the correspondent samples.
Casiraghi et al. [49] carried out compression test on different types of cheeses, they recorded a range of 30-50 N for
uniaxial compression of Mozzarella cheese under different measurement conditions (lubricated, nonbonded and
bonded).
Figure 1:Compression results for all cheese systems through the storage.
From ANOVA data, it was observed that the three studied variables, agavin addition, pre-acidification and storage
time affected significantly (p<0.05) the compression and penetration responses of all cheese systems. Both forces
were similar, to cheese controls and all of them showed a decreasing trend as a function of the storage time.
3.3.7 Texture profile analysis:TPA test was applied to four cheese systems (C2, S7, S9, S10) at day 21. From the double compression test, different responses were observed in our study (Figure 3), only some parameters were
selected as useful. Cohesiveness (how well the cheese elements hold together, that is evaluated as a ratio of work or
energy involved on the second and first bites, 0.26-0.46 dimensionless) and springiness (amount of physical
recovery and evaluated as a ratio of deformation length involved with the second and first bites, 0.41-0.73,
dimensionless), showed a similar response without a trend. These values of cohesiveness resulted lower than those
reported correspondently for low-fat Mozzarella cheeses (0.63-0.74) by Zisu and Shah [14]. Gumminess (as a
multiplication of hardness by cohesiveness, 1.38-3.72 N) and chewiness (as a product of hardness, cohesiveness
times springiness, 0.56-2.72 N-m) exhibited also a similar response, with a decreasing trend for C2, S7, S9 and S10,
respectively. Firmness (data not included in Figure 3) was higher in C2 and S7 systems with 8 N, whereas the other
two cheese systems, S9 and S10 recorded a force of 5.48 and 5.24 N. These magnitudes are comparable to hardness
recorded for a type of Mozzarella cheese (4-38 N) studied by Zisu and Shah [14], comparable to hardness (8.5-10.1
N) measured for a pasta filata cheese [50], and lower than those hardness values of 37-105 N, reported by Tunick et
al. [51] for Mozzarella cheeses after 1-6 weeks of storage.
Figure 3:TPA results for cheese systems C2 (T3P), S7, S9 and S10, at day 21.
Our ANOVA results indicated that agavin content affected significantly (p<0.05) the last three texture parameters
(gumminess, chewiness and firmness), being the unique factor involved or considered in this TPA test.
3.3.8 Elongation test: The application of this complementary test for texture characterization, exhibited a range of 1.0 to 3.5 N before melting for fresh cheeses, measured as the rupture force between subjected extremes of the
included in Table 7. It is clear and expected that forces needed previous to the melting (<3.5 N) are higher than those
needed after melting (<2.0 N) in most of the cheese systems. The effect of temperature and melting contributed to a
decreasing of the casein and other components [39, 44]. The recorded values are in accordance with those reported
by Gunasekaran and Ak [39] and are also comparable to those strength values at 60 (1.2-2.6 N) and 70°C
(0.84-1.8N) reported for Mozzarella by Fife et al. [52]. There was not significant difference between control and cheese
with agavin. Whereas the effect of acid addition, is not clear due to the few results obtained for the elongation test,
apparently cheeses with lactic acid required lower rupture force, phenomenon that may be an advantage or
disadvantage, depending of the final application of this dairy product. It is also observed (Table 7) that rupture force
decreased with the storage time.
System
Storage Day
Before to melting After melting
1 16 26 31 1 16 26 31
C1 3.48 ± 0.01 0.58 ± 0.26 1.23 ± 0.27 0.90 ± 0.09 0.24 ± 0.01 0.11 ± 0.03 0.28 ± 0.17 0.11 ± 0.01
C2 0.78 ± 0.01 - - 0.78 ± 0.01 0.78 ± 0.01 - - 0.78 ± 0.01
S1 - 0.40 ± 0.17 1.36 ± 0.36 0.69 ± 0.10 - 0.26 ± 0.013 0.09 ± 0.04 0.07 ± 0.01
S2 - 2.35 ± 0.25 1.70 ± 0.05 1.00 ± 0.06 - 0.30 ± 0.07 0.08 ± 0.11 0.17 ± 0.09
S3 - 0.98 ± 0.50 1.22 ± 0.57 1.05 ± 0.05 - 0.25 ± 0.11 0.48 ± 0.31 0.05 ± 0.01
S4 - 0.64 ± 0.01 1.25 ± 0.26 0.99 ± 0.06 - 0.17 ± 0.04 0.13 ± 0.03 0.37 ± 0.13
S5 1.97 ± 0.03 - - - 0.28 ± 0.03 - - -
S6 2.73 ± 0.21 - - - 1.96 ± 0.21 - - -
S7 0.98 ± 0.39 - - 0.63 ± 0.03 0.29 ± 0.04 - - 0.18 ± 0.03
S8 1.25 ± 0.92 - - - 1.28 ± 0.09 - - -
S9 0.52 ± 0.03 - - 0.52 ± 0.04 0.30 ± 0.03 - - 0.18 ± 0.01
S10 0.69 ± 0.02 - - 0.66 ± 0.02 0.57 ± 0.02 - - 0.27 ± 0.03
Table 7:Rupture forces (N) in the elongation test for cheese samples through storage.
3.3.9 Melting capacity:For this measurement, in which less objectivity is involved, the cheese samples showed a variety of values (30-157%), as may be appreciated in Table 8. It may be considered than the meltability higher than
the recorded for cheese control C1 is a good index; whereas those samples with melt capacity lower than 72.2% as
the average value of three determinations in C1 over storage, may be considered as not good pasta filata items, then
23 of the 30 measures showed a good index. Those cheese systems with agavin and lactic acid (S1, S3, S4, S7, S9
and S10) exhibited an average MC higher than 72.2%, being some of them (S4, S7, S9 and S10) very meltable with
MC higher that 72.2, as an average value. In general terms these cheeses showed an increasing trend as a function of
System Day
1 11 21 31
C1 ND 63.3 ± 0.2 77.8 ± 0.1 75.7 ± 0.2
C2 63 ± 0.6 105.0 ± 0.1 123 ± 0.2 120 ± 1.0
S1 ND 65.9 ± 0.1 157.5 ± 1.5 75.3 ± 0.3
S2 ND 72.4 ± 0.5 41.7 ± 0.5 33.8 ± 0.3
S3 ND 96.8 ± 0.1 38.8 ± 0.5 81.3 ± 0.2
S4 ND 116.1 ± 0.1 91.3 ± 0.3 77.5 ± 0.3
S5 ND 72.0 ± 0.6 42.0 ± 0.3 30.0 ± 0.6
S6 ND 66.0 ± 0.4 87.0 ± 3.0 84.0 ± 2.0
S7 81 ± 0.6 123.0 ± 0.5 144.0 ± 3.6 126.0 ± 2.4
S8 ND 42.0 ± 0.4 48.0 ± 0.3 123.0 ± 2.0
S9 ND 75.0 ± 0.7 114.0 ± 0.6 117.0 ± 1.8
S10 81 ± 0.6 111.0 ± 0.4 120.0 ± 3.0 93.0 ± 2.0
ND-not determined
Table 8:Melting capacity (%), for cheese samples through storage.
And although this parameter expresses the effect of both variables, the agavin that does not favor the melting
phenomenon because some of the interaction points are occupied by this compound, while the acidification favors
the phenomenon because in contrary, some mineral are lost through this process [16]. It is difficult to know with
these limited results what variable was more determinant. However, satisfactory melting capacities were obtained in
our cheese samples (>72% for 27 of 38 average values from the cheese systems).
3.4 Viscoelastic and sensory determinations
3.4.1 Viscoelasticity: As expected, all the manufactured cheeses showed an elastic component of higher magnitude than the viscous one, expressing them a firm gel nature. From the moduli magnitudes and tan δ, it was appreciated
than the cheese control 2 was the sample with the highest values for G´ and G´´ (data not shown) in comparison with
those cheeses with added agavin (S8, S7, S9 and S10) and without addition (S6 and S5); being softer gels those
corresponding to cheese samples without agavin, in which the difference in magnitude between G´ and G´´ was
lower. The viscoelastic behavior of a cheese has been attributed to the moisture/protein ratio by Rogers et al. [53]
that affects the proteinaceous matrix, that obviously was influenced by the agavin presence. Several authors have
reported values of the viscoelastic parameters at a frequency of 0.5-1 Hz that represents a value in which a human
mouth begins to make structural changes. At that frequency of 1.0 Hz, the viscoelastic parameters for the tested
cheese samples are included in Table 9. Observing the magnitudes for both moduli, the most consistent systems
(with lower changes between days 1 and 16) corresponded to C2, S7, S9 and S10, they exhibited the highest G´ and G´´ moduli, three of them with agavin. Higher values of G’ (40-50 kPa) and G´´ (~ 20 kPa) were obtained by Yun et
System At day 1 At day 16
G´ (Pa) G´´ (Pa) G´ (Pa) G´´ (Pa)
C1 29500 9190 6510 2350
C2 15200 4970 16200 5290
S5 846 338 7670 2620
S6 20700 6660 9800 3790
S7 16100 5360 12700 4220
S8 19400 6650 3890 1460
S9 14600 4720 11000 3620
S10 13100 4130 16200 4500
Table 9:Viscoelastic parameters (G´ and G´´) for some cheese systems at 1 Hz.
In general, all the viscoelastic responses decreased through storage and were more notable in the cheese control than
in the cheese with agavin, due to the proteolysis of α and β caseins among other biochemical changes. Mozzarella
cheese softens through storage and becomes less elastic. From the ANOVA results, a significant decrease in both
moduli as a function of the storage time was detected. The functional changes that take place during the storage and
aging have been related directly to the proteolysis phenomenon [5, 14, 44, 55].
3.4.2 Sensory assessment: Only five selected systems (C1, S1, S2, S3, S4) as representative of the whole set, were sensory assessed at day 11. The sensory assessment indicated qualifications of good like in flavor and aroma, a
range of 3.04-3.60 of 5 points was recorded for the four cheeses with agavin, in which the S7 (including acid and
agavin) presented the lowest values for both attributes. The color was qualified in a range of 2.65-3.21, the texture
had 3.08-3.52 and the general acceptance was in a range of 3.13 to 3.73; without any significant difference between
the cheese control and the other four cheese systems, two of them (S1 and S2) with lactic acid and the other two (S3
and S4) added with agavin. Comparative sensory results were obtained by Machuca et al. [13], although they used a
scale of 7 points, in cheeses made with inulin and oligofructose, used as prebiotic.
The statistical results showed up that consumer could not identify any additional flavor or texture due to agavin, not
even the slightly sweet flavor that this ingredient presents by itself. It is assumed that in cheese, the flavor was not
modified or perceived by the additions of prebiotic and acid. And the conclusion was that the four cheeses liked with
moderation. Other sensory parameters (data non shown) were monitored with a technique of Analysis of Principal
Components and Ascendent Classification, and they corroborated the relationship of the agavin with moisture and
Conclusions
A functional Mozzarella cheese of low moisture was formulated and manufactured with a prebiotic compound, the
agavin. Twelve cheese systems were prepared, characterized and studied fresh and stored. The Mozzarella
manufacturing process was modified to incorporate the agavin and the lactic acid with overall good results and
yields. The presence of prebiotic and lactic acid influenced some properties of the Mozzarella cheese, but the
essential appearance, properties and characteristics of this pasta filata item were conserved. Therefore, combining
both factors, it is possible to improve the low-fat Mozzarella cheese, properties such as the flavor, functional and
texture, as well as yield may be improved.
References
1. Kindstedt PS, Fox PF. Effect of manufacturing factors, composition, and proteolysis on the functional
characteristics of Mozzarella cheese. Critical Reviews in Food Science and Nutrition 33 (1993): 167-187.
2. Kosikowski F, Mistry V. Cheese and Fermented Milk Foods. Publisher Kosikowski FV, LLC. University
of Wisconsin, Madison WI, USA (1997).
3. Smit G. Dairy Processing. Improving Quality. Woodhead Publishing Limited and CRC Press LLC.
Cambridge, England (2003).
4. Ismail M, Ammar ET, El-Metwally R. Improvement of low-fat Mozzarella cheese properties using
denatured whey protein. International Journal of Dairy Technology 64 (2011): 207-217.
5. Hussain I, Bell AE, Grandison AS. Mozzarella-type curd made from buffalo, cows’ and ultrafiltered cows’
milk. Food and Bioprocess Technology 6 (2013): 1741-1748.
6. Vélez-Ruiz JF. Rheology and Texture of Cheese. In Food Processing and Engineering Topics, Eds.: Sosa
ME and Vélez-Ruiz JF. Nova Science Publishers, Inc. Nueva York, USA (2009): 87-122.
7. Vélez-Ruiz JF. Notes of Milk and Dairy Products. Universidad de las Américas Puebla. Puebla, México
(2017).
8. Reid DS, Yan H. Rheological, melting and microstructural properties of Cheddar and Mozzarella cheeses
affected by different freezing methods. Journal of Food Quality 27 (2004): 436-458.
9. Yu Ch, Gunasekaran S. A system analysis of pasta filata process during Mozzarella cheese making. Journal
of Food Engineering 69 (2005): 399-408.
10. Gomes da Cruz A, Alonso FC, Batista C, et al. Probiotic cheese: health benefits, technological and stability
aspects. Trends in Food Science and Technology 20 (2009): 344-354.
11. Jana AH, Mandal PK. Manufacturing and quality of Mozzarella cheese: A review. International Journal of
Dairy Science 6 (2011): 199-216.
12. Ma X, James B, Zhang L, et al. Correlating Mozzarella cheese properties to its production processes and
microstructure quantification. Journal of Food Engineering 115 (2013): 154-163.
13. Machuca LM, Rodriguez YE, Guastavino DE, et al. Production and sensory evaluation of novel cheeses
made with prebiotic substances: inulin and oligofructose. Food and Nutrition Sciences 6 (2015):
14. Zisu B, Shah NP. Textural and functional changes in low-fat Mozzarella cheeses in relation to proteolysis
and microstructure as influenced by the use of fat replacers, pre-acidification and EPS starter. International
Dairy Journal 15 (2005): 957-972.
15. Wastra P. Milk Science and Technology of Dairy Products. Ed. Acribia. Zaragoza, Spain (2001).
16. Gernigon G, Schuck P, Jeantet R. Processing of Mozzarella wheys and stretchwaters: a preliminary review.
Dairy Science and Technology 90 (2010): 27-46.
17. Swennen K, Courtin CM, Delcour JA. Non-digestible oligosaccharides with prebiotic properties. Critical
Reviews in Food Science and Human Nutrition 46 (2006): 459-471.
18. Parvez S, Malik KA, Kang A, et al. Probiotics and their fermented food products are beneficial for health.
Journal of Applied Microbiology 100 (2006): 1171-1185.
19. Caselato de Sousa VM, Freitas dos Santos E, Sgarbieri VC. The importance of prebiotics in functional
foods and clinical practice. Food and Nutrition Sciences 2 (2011): 133-144.
20. Giacco R, De Giulio B, Vitale M, et al. Functional foods: Can food technology help in the prevention and
treatment of diabetes? Food and Nutrition Sciences 4 (2013): 827-837.
21. Amaral M, Franco Y, Maróstica M, et al. Effect of prebiotics on the health of the elderly: Review. Food
Research International 53 (2013): 426-432.
22. Guimaraes RR, Ana Lúcia do Amaral A, Antônio Carlos dos Santos A, et al. Development of probiotic
beads similar to fish eggs. Journal of Functional Foods 5 (2013): 968-973.
23. Pinheiro R, Perego P, Nogueira M, et al. Growth, organic acids profile and sugar metabolism of
Bifidobacterium lactis in co-culture with Streptococcus thermophilus: The inulin effect. Food Research
International 48 (2012): 21-27.
24. Franck A. Technological functionality of inulin and oligofructose. Britanian Journal of Nutrition 87 (2002):
287-291.
25. González-Tomás L, Bayarri S, Coll-Marqués J, et al. Flow behaviour of inulin-enriched dairy desserts:
influence of inulin average chain length. International Journal of Food Science and Technology 44 (2009):
1214-1222.
26. Chinellato N, Bulumer P, Francisco L, et al. Characterization of fresh cheese with addition of probiotics
and prebiotics. Journal of Life Science 7 (2013): 189-195.
27. López MG, Urías-Silvas J. Agave sp. and Dasylirion sp. fructans as prebiotics. CINVESTAV-IPN.
Research Signpost 37 (2007): 1-14.
28. Roberfroid MB, Slavin J. Nondigestible oligosaccharides. Critical Reviews in Food Science and Human
Nutrition 40 (2000): 461-480.
29. Madureira A, Pintado A, Gomes A, et al. Rheological, textural and microstructural features of probiotic
whey cheeses. LWT-Food Science and Technology 44 (2011): 75-81.
30. Koh L, Jiang B, Kasapis S, et al. Structure, sensory and nutritional aspects of soluble-fibre inclusion in
processed food products. Food Hydrocolloids 25 (2011): 159-164.
32. Santillán-Urquiza E, Méndez-Rojas M, Vélez-Ruiz JF. Fortification of yogurt with nano-particulated and
micro-sized calcium, iron and zinc, effect on the physicochemical and rheological properties. LWT-Food
Science and Technology 80 (2017): 462-469.
33. Guinee TP, Feeney EP, Auty M, et al. Effect of pH and calcium concentration on some textural and
functional properties of Mozzarella cheese. Journal of Dairy Science 85 (2002): 1655-1669.
34. A.O.A.C. Official Methods of Analysis. (17th Edn.), Association of Official Analytical Chemists. Inc.
Washington, D.C. USA (2000).
35. A.O.A.C. Official Methods of Analysis. (16th Edn.), Association of Official Analytical Chemists. Inc.
Washington, D.C. USA (1995).
36. Brighenti M, Govindsamy-Lucey S, Lim K, et al. Characterization of the rheological, textural and sensory
properties of samples of commercial US cream cheese with different fat contents. Journal of Dairy Science
91 (2008): 4501-4517.
37. Huerta-Limón R. Determination of the stretching point and modification of texture after melting of Oaxaca
cheese. In Spanish. Food Engineer Bachelor Thesis. Universidad de las Américas Puebla. Cholula, Puebla,
México (2006).
38. Ramírez-Navas JS. Functional properties of cheeses: With emphasis in pasta filata cheese. Revista
RECITEIA. 10 (2010): 70-97.
39. Gunasekaran S, Ak MM. Cheese Rheology and Texture. CRC Press, Boca Raton, USA (2003).
40. Sulieman AME, Ali RAM, Razig KAA. Production and effect of storage in the chemical composition of
Mozzarella cheese. International Journal of Food Science and Nutrition Engineering 2 (2012): 21-26.
41. Hernández AL, Piña Y, Perez L, et al. Comparative analysis of Pastilla Cid cheese and Mozzarella cheese.
Ciencia y Tecnología de Alimentos 17 (2007): 38-42.
42. Leewah K, Jiang B, Kasapis S, et al. Structure, sensory and nutritional aspects of soluble-fiber inclusion in
processed food products. Food Hydrocolloids 25 (2011): 159-164.
43. Muliawan EB, Hatzikiriakos SG. The effect of refrigerated storage on the rheological properties of three
commercial Mozzarella cheeses. International Journal of Food Engineering 4 (2008): 1-19.
44. Ayyash MM, Shah NP. Proteolysis of low-moisture Mozzarella cheese as affected by substitution of NaCl
with KCl. Journal of Dairy Science 94 (2011): 3769-3777.
45. ILSI Europe. International Life Sciences Institute Europe. Dietetic Fiber. Definition, analysis, physiology
and health. Concise Monograph Series. Brusels, Belgium (2006).
46. Miocinovic J, Puda P, Radulovic Z, et al. Development of low fat UF cheese technology. Mljekarstvo 61
(2011): 33-44.
47. Fox PF, Mc Sweeney PLH, Cogan TM, et al. Fundamentals of Cheese Science. Academic Press. USA
(2000).
48. Alvarez S, Rodriguez V, Ruiz ME, et al. Correlations for instrumental texture and color based on the
chemical composition of Canarian caprine cheeses. Archivos de Zootecnia 56 (2007): 663-666.
49. Casiraghi EM, Bagley EB; Christianson DD. Behavior of Mozzarella, Cheddar and processed cheese
50. Mizuno R, Lucey JA. Effects of two types of emulsifying salts on the functionality of nonfat pasta filata
cheese. Journal of Dairy Science 88 (2005): 3411-3425.
51. Tunick MH, Malin EL, Smith PW, et al. Effects of skim milk homogenization on proteolysis and rheology
of Mozzarella cheese. International Dairy Journal 5 (1995): 483-491.
52. Fife RL, McMahon DJ, Oberg CJ. Test for measuring of stretchability of melted cheese. Journal of Dairy
Science 85 (2002): 3539-3545.
53. Rogers NR, McMahon DJ, Daubert CR, et al. Rheological properties and microstructure of Cheddar cheese
made with different fat contents. Journal of Dairy Science 93 (2010): 4565-4576.
54. Yun JJ, Hsieh YL, Barbano DM, et al. Rheological and chemical properties of Mozzarella cheese. Journal
of Texture Studies 25 (1994): 411-420.
55. Jimenez-Maroto LA, López-Hernández A, Borneman DL, et al. A comparison of fresh, pasta filata, and
aged Hispanic cheeses using sensory, chemical, functional, and microbiological assessments. Journal of
Dairy Science 90 (2016): 2680-2693.
This article is an open access article distributed under the terms and conditions of the
Creative Commons Attribution (CC-BY) license 4. 0