R E S E A R C H
Open Access
The Marshall-Olkin extended Weibull family of
distributions
Manoel Santos-Neto
1*, Marcelo Bourguignon
2*, Luz M Zea
3, Abraão DC Nascimento
4and Gauss M Cordeiro
4*Correspondence: mn.neco@gmail.com; m.p.bourguignon@gmail.com 1Departamento de Estatística, Universidade Federal de Campina Grande, Bodocongó, 58429-970, Campina Grande, PB, Brazil 2Departamento de Estatística, Universidade Federal do Piauí, Ininga, 64049-550, Teresina, PI, Brazil Full list of author information is available at the end of the article
Abstract
We introduce a new class of models called the Marshall-Olkin extended Weibull family of distributions based on the work by Marshall and Olkin (Biometrika 84:641–652, 1997). The proposed family includes as special cases several models studied in the literature such as the Marshall-Olkin Weibull, Marshall-Olkin Lomax, Marshal-Olkin Fréchet and Marshall-Olkin Burr XII distributions, among others. It defines at least twenty-one special models and thirteen of them are new ones. We study some of its structural properties including moments, generating function, mean deviations and entropy. We obtain the density function of the order statistics and their moments. Special distributions are investigated in some details. We derive two classes of entropy and one class of divergence measures which can be interpreted as new goodness-of-fit quantities. The method of maximum likelihood for estimating the model parameters is discussed for uncensored and multi-censored data. We perform a simulation study using Markov Chain Monte Carlo method in order to establish the accuracy of these estimators. The usefulness of the new family is illustrated by means of two real data sets.
Mathematics Subject Classification (2010): 60E05; 62F03; 62F10; 62P10 Keywords: Extended Weibull distribution; Hazard rate function; Marshall-Olkin distribution; Maximum likelihood estimation; Survival function
1 Introduction
The Weibull distribution has assumed a prominent position as statistical model for data from reliability, engineering and biological studies (McCool 2012). This model has been exaustively used for describinghazard rates– an important quantity of survival analysis. In the context of monotone hazard rates, some results from the literature suggest that the Weibull law is a reasonable choice due to its negatively and positively skewed density shapes. However, this distribution is not a good model for describing phenomenon with non-monotone failure rates, which can be found on data from applications in reliability and biological studies. Thus, extended forms of the Weibull model have been sought in many applied areas. As a solution for this issue, the inclusion of additional parameters to a well-defined distribution has been indicated as a good methodology for providing more flexible new classes of distributions.
Marshall and Olkin (1997) derived an important method of including an extra shape parameter to a given baseline model thus defining an extended distribution. The Marshall and Olkin (“MO” for short) transformation furnishes a wide range of behaviors with
respect to the baseline distribution. The geometrical and inferential properties associated with the generated distribution depend on the values of the extra parameter. These char-acteristics provide more flexibility to theMOgenerated distributions. Considering the proportional odds model, Sankaran and Jayakumar (2008) presented a detailed discussion about the physical interpretation of theMOfamily.
This family has a relationship with the odds ratio associated with the baseline distribu-tion. LetXbe a distributedMOrandom variable which describes the lifetime relative to each individual in the population with a vector ofp-covariatesz= (z1,. . .,zp), where (·)denotes the transposition operator. Then, the cumulative distribution function (cdf ) ofXis given by
F(x;z) = k(z)G(x)
1−[ 1−k(z)]G(x), (1)
wherek(z)=λG(x)/λF(x;z)is a non-negative function such thatzis independent of the
timex,λF(x; z)is the proportional odds model [for a discussion about such modeling, see
Sankaran and Jayakumar (2008)] andλG(x) = G(x)/G(x)represents an arbitrary odds
for the baseline distribution.
In this paper, we consider k(z) = δ. Before, however, it is important to highlight two important properties of theMOtransformation: (i) the stability and (ii) geomet-ric extreme stability (Marshall and Olkin 1997). In other words, theMOdistribution possesses a stability property in the sense that if the method is applied twice, it returns to the same distribution. In addition, the following stochastic behavior can also be veri-fied: let{X1,. . .,XN}be a random sample from the population random variable equipped
with the survival function (1) atk(z) = δ. Suppose thatN has the geometric distribu-tion with probabilitypand that this quantity is independent ofXi, fori=1,. . .,N. Then, U = min(X1,. . .,XN)andV = max(X1,. . .,XN)are random variables having survival
functions (1) such thatk(z)can be equal topandp−1, respectively, i.e., theMOtransform satisfies the geometric extreme stability property.
Due to these advantages, many papers have employed the MO transformation. In
Marshall and Olkin work, the exponential and Weibull distributions were general-ized. Subsequently, theMOextension was applied to several well-known distributions:
Weibull (Ghitany et al. 2005, Zhang and Xie 2007), Pareto (Ghitany 2005), gamma
(Risti´cet al.2007), Lomax (Ghitanyet al.2007) and linear failure-rate (Ghitany and Kotz 2007) distributions. More recently, general results have been addressed by Barreto-Souza et al.(2013) and Cordeiro and Lemonte (2013). In this paper, we aim to apply theMO generator to the extended Weibull (EW) class of distributions to obtain a new more flex-ible family to describe reliability data. The proposed family can also be applied to other fields including business, environment, informatics and medicine in the same way as it was originally done with the Birnbaum-Saunders and other lifetime distributions.
LetG(x)=1−G(x)andg(x)=dG(x)/dxbe the survival and density functions of a con-tinuous random variableYwith baseline cdfG(x). Then, theMOextended distribution has survival function given by
F(x;δ)= δG(x)
1−δG(x) =
δG(x)
G(x)+δG(x), x∈X ⊆R, δ >0, (2)
Clearly,δ=1 impliesF(x)=G(x). The family (2) has probability density function (pdf ) given by
f(x;δ)= δg(x)
[ 1−δG(x)]2, x∈X ⊆R, δ >0.
Its hazard rate function (hrf ) becomes
τ (x;δ)= g(x)
G(x)[ 1−δG(x)], x∈X ⊆R, δ >0.
Further, the class of extended Weibull (EW) distributions pioneered by Gurvichet al. (1997) has achieved a prominent position in lifetime models. Its cdf is given by
G(x;α,ξ)=1−exp[−αH(x;ξ)] , x∈D⊆R+, α >0, (3)
whereH(x;ξ)is a non-negative monotonically increasing function which depends on the parameter vectorξ. The corresponding pdf is given by
g(x;α,ξ)=αexp[−αH(x;ξ)]h(x;ξ), (4)
whereh(x;ξ)is the derivative ofH(x;ξ).
Different expressions forH(x;ξ)in Equation (3) define important models such as:
(i) H(x;ξ)=xgives the exponential distribution;
(ii) H(x;ξ)=x2leads to the Rayleigh (Burr type-X) distribution; (iii) H(x;ξ)=log(x/k)leads to the Pareto distribution;
(iv) H(x;ξ)=β−1[ exp(βx)−1]gives the Gompertz distribution.
In this paper, we derive a new family of distributions by compounding theMOandEW classes. We define a new generated family in order to provide a “better fit” in certain prac-tical situations. The compounding procedure follows by taking theEW class (3) as the baseline model in Equation (2). TheMarshall-Olkin extended Weibull(MOEW) fam-ily of distributions contains some special models as those listed in Table 1 with the correspondingH(·;·)andh(·;·)functions and the parameter vectors.
The paper unfolds as follows. Section 2 presents the cdf and pdf of the proposed distri-bution and some expansions for the density function. The main statistical properties of the new family are derived in Section 3 including the moments, moment generating func-tion (mgf ) and incomplete moments, quantile funcfunc-tion (qf ), random number generator, skewness and kurtosis measures, order statistics, mean deviations and average lifetime functions. In Section 4, we derive four measures of information theory: Shannon and Rényi entropies, cross entropy and Kullback-Leibler divergence. The maximum likelihood method to estimate the model parameters is adopted in Section 5. Two special models are studied in some details in Section 6. We perform a simulation study using Monte Carlo’s experiments in order to assess the accuracy of the maximum likelihood estimators (MLEs) in Section 7.1 and two applications to real data in Section 7.2. Conclusions and some future lines of research are addressed in Section 8.
2 TheMOEWfamily
The cdf of the new family of distributions is given by
F(x;δ,α,ξ)= 1−exp[−αH(x;ξ)]
et
al.
Journal
o
fStatistical
Distributions
a
nd
Applications
2014,
1
:9
Page
4
o
f
2
4
Table 1 Special models and the corresponding functionsH(x;ξ )andh(x;ξ )
Distribution H(x;ξ ) h(x;ξ ) α ξ References
Exponential (x≥0) x 1 α ∅ Johnsonet al.(1994)
Pareto (x≥k) log(x/k) 1/x α k Johnsonet al.(1994)
Burr XII (x≥0) log(1+xc) c xc−1/(1+xc) α c Rodriguez (1977)
Lomax (x≥0) log(1+x) 1/(1+x) α ∅ Lomax (1954)
Log-logistic (x≥0) log(1+xc) c xc−1/(1+xc) 1 c Fisk (1961)
Rayleigh (x≥0) x2 2x α ∅ Rayleigh (1880)
Weibull (x≥0) xγ γxγ−1 α γ Johnsonet al.(1994)
Fréchet (x≥0) x−γ −γx−(γ+1) α γ Fréchet (1927)
Linear failure rate(x≥0) a x+b x2/2 a+b x 1 [a,b] Bain (1974)
Modified Weibull (x≥0) xγexp(λx) xγ−1exp(λx)(γ+λx) α [γ,λ] Laiet al.(2003)
Weibull extension (x≥0) λ[ exp(x/λ)β−1] βexp(x/λ)β(x/λ)β−1 α [γ,λ,β] Xieet al.(2002)
Phani (0< μ <x< σ <∞) [(x−μ)/(σ−x)]β β[(x−μ)/(σ−x)]β−1[(σ−μ)/(σ−t)2] α [μ,σ,β] Phani (1987)
Weibull Kies (0< μ <x< σ <∞) (x−μ)β1/(σ−x)β2 (x−μ)β1−1(σ−x)−β2−1[β
1(σ−x)+β2(x−μ)] α [μ,σ,β1,β2] Kies (1958)
Additive Weibull (x≥0) (x/β1)α1+(x/β2)α2 (α1/β1)(x/β1)α1−1+(α2/β2)(x/β2)α2−1 1 [α1,α2,β1,β2] Xie and Lai (1995)
Traditional Weibull (x≥0) xb[ exp(cxd−1)] bxb−1[ exp(cxd)−1]+cdxb+d−1exp(cxd) α [b,c,d] Nadarajah and Kotz (2005) Gen. power Weibull (x≥0) [ 1+(x/β)α1]θ−1 (θ α1/β)[ 1+(x/β)α1]θ−1(x/β)α1 1 [α1,β,θ] Nikulin and Haghighi (2006)
Flexible Weibull extension(x≥0) exp(γx−β/x) exp(γx−β/x)(γ+β/x2) 1 [γ,β] Bebbingtonet al.(2007)
Gompertz (x≥0) β−1[ exp(βx)−1] exp(βx) α β Gompertz (1825)
Exponential power (x≥0) exp[(λx)β]−1 βλexp[(λx)β](λx)β−1 1 [λ,β] Smith and Bain (1975)
Chen (x≥0) exp(xb)−1 bxb−1exp(xb) α b Chen (2000)
whereα >0 andδ >0. Using (5), we can express its survival function as
F(x;δ,α,ξ)= δexp[−αH(x;ξ)]
1−δexp[−αH(x;ξ)], x∈D (6)
and the associated hrf reduces to
τ (x;δ,α,ξ)= αh(x;ξ)
1−δexp[−αH(x;ξ)], x∈D. (7)
The corresponding pdf is given by
f(x;δ,α,ξ)= δ αh(x;ξ)exp[−αH(x;ξ)]
{1−δexp[−αH(x;ξ)]}2 , (8)
whereH(x;ξ)can be any special distribution listed in Table 1.
Hereafter, letXbe a random variable having theMOEWpdf (8) with parametersδ,α
andξ, sayX ∼ MOEW(δ,α,ξ). Equation (8) extends several distributions which have been studied in the literature.
TheMO Pareto (Ghitany 2005) is obtained by takingH(x;ξ) = log(x/k) (x ≥ k). Further, forH(x;ξ) = xγ we obtain theMOWeibull (Ghitanyet al. 2005, Zhang and Xie 2007). TheMOLomax (Ghitanyet al. 2007) andMOlog-logistic are derived from (8) by takingH(x;ξ) = log(1+xc)withc = 1 andH(x;ξ) = log(1+xc)withα = 1,
respectively. ForH(x;ξ)=a x+b x2/2 andα=1, Equation (8) reduces to theMOlinear failure rate (Ghitany and Kotz 2007). In the same way, forH(x;ξ)=log(1+xc), we have
the MOBurr XII (Jayakumar and Mathew 2008). Finally, we obtain theMO Fréchet
(Krishnaet al. 2013) from Equation (8) by settingH(x;ξ) =x−γ. Table 1 displays some useful quantities and corresponding parameter vectors for special distributions.
A general approximate goodness-of-fit test for the null hypothesis H0 : X1,. . .,Xn
withXifollowingF(x;θ), where the form ofFis known but thep-vectorθ = (δ,α,ξ)
is unknown, was proposed by Chen and Balakrishnan (1995). This method is based on the Cramér-von Mises (CM) and Anderson-Darling (AD) statistics and, in general, the smaller the values of these statistics, the better the fit. In this paper, such methodology is applied to provide goodness-of-fit tests for the distributions under study.
Some results in the following sections can be obtained numerically in any software such as MAPLE (Garvan 2002), MATLAB (Sigmon and Davis 2002), MATHEMATICA (Wolfram 2003), Ox (Doornik 2007) and R (R Development Core Team 2009). The Ox (for academic purposes) and R are freely available athttp://www.doornik.comand http://www.r-project.org, respectively. The results can be computed by taking in the sums a large positive integer value in place of∞.
2.1 Expansions for the density function
For any positive real number a, and for |z| < 1, we have the generalized binomial expansion
(1−z)−a= ∞
k=0
(a)k k! z
k, (9)
where(a)k =(a+k)/ (a)=a(a+1) . . . (a+k−1)is the ascending factorial and(·)
is the gamma function. Applying (9) to (8), for 0< δ <1, gives
f(x;δ,α,ξ)= ∞
j=0
whereηj = δδj andg(x;(j+1)α,ξ)denotes theEW density function with parameters (j+1)αandξ. Otherwise, forδ >1, after some algebra, we can express (8) as
f(x;δ,α,ξ)= g(x;α,ξ)
δ{1−(1−1/δ)[ 1−exp(−αH(x;ξ))]}2. (11)
In this case, we can verify that|(1−1/δ)[ 1−exp(−αH(x;ξ))]| < 1. Then, applying twice the expansion (9) in Equation (11), we obtain
f(x;δ,α,ξ)= ∞
j=0
νjg(x;(j+1)α,ξ), (12)
where
νj=νj(δ)= (−1)j δ(j+1)!
∞
k=j
(k+1)!(1−1/δ)k.
We can verify that∞j=0ηj=∞j=0νj =1. Then, theMOEWdensity function can be
expressed as an infinite linear combination ofEWdensities. Equations (10) and (12) have the same form except for the coefficientsηjsin (10) andνjsin (12). They depend only on the generator parameterδ. For simplicity, we can write
f(x;δ,α,ξ)= ∞
j=0
wjg(x;(j+1)α,ξ), (13)
where
wj=
⎧ ⎨ ⎩
ηj, if 0< δ <1,
νj, if δ >1,
andηjandνjare given by (10) and (12), respectively. Thus, some mathematical properties
of (13) can be obtained directly from thoseEW properties. For example, the ordinary, incomplete, inverse and factorial moments and the mgf ofXfollow immediately from those quantities of theEWdistribution.
3 General properties
3.1 Moments, generating function and incomplete moments Thenth ordinary moment ofXcan be obtained from (13) as
E(Xn) = ∞
j=0
wjE(Yjn),
where from now onYj ∼ EW((j+1)α,ξ) denotes a random variable having theEW
density functiong(y;(j+1)α,ξ).
The mgf and thekth incomplete moment ofXfollow from (13) as
MX(t)=E
etX=
∞
j=0
wjMj(t)
and
Tk(z)= ∞
j=0
wjTk(j)(z), (14)
whereMj(t)is the mgf ofYjandTk(j)(z)= −∞z xkg(x;(j+1)α,ξ)dxcomes directly from
3.2 Quantile function and random number generator
The qf ofXfollows by inverting (5) and it can be expressed in terms ofH−1(·)as
Q(u)=H−1
1
αlog
1−δu
1−u
,ξ
. (15)
In Table 2, we provide the functionH−1(x;ξ)for some special models. Hence, the generator forXcan be given by the algorithm:
Algorithm 1Random number generator for theMOEWdistribution
1: GenerateU∼U(0, 1).
2: Specify a functionH−1(·;·)such as anyone in Table 2 and use (15). 3: Obtain an outcome ofXbyX=Q(U).
The MOEW distributions can be very useful in modeling lifetime data and
prac-titioners may be interested in fitting one of these models. We provide a script using the R language to generate the density, distribution function, hrf, qf, random numbers, Anderson-Darling test, Cramer-von Mises test and likelihood ratio (LR) tests. This script can be be obtained from the authors upon requested.
3.3 Mean deviations
The mean deviations ofXabout the mean and the median are given by
δ1=
D |x−
μ|f(x;δ,α,ξ)dx and δ2=
D |x−M|f
(x;δ,α,ξ)dx,
respectively, whereμ= E(X)denotes the mean andM= Median(X)the median. The median follows from the nonlinear equation F(M;δ,α,ξ) = 1/2. So, these quantities reduce to
δ1=2μF(μ;δ,α,ξ)−2T1(μ) and δ2=μ−2T1(M),
whereT1(z)is the first incomplete moment ofXobtained from (14) as
T1(z)=
∞
j=0
wjT1(j)(z),
andT1(j)(z)= −∞z x g(x;(j+1)α,ξ)dxis the first incomplete moment ofYj.
An important application of the mean deviations is related to the Bonferroni and Lorenz curves. These curves are useful in economics, reliability, demography, medicine
Table 2 TheH−1(x;ξ )function
Distribution H−1(x;ξ )
Exponential power [log(x+λ1)]1/β
Chen log(x+1)1/β
Weibull extension λlogxλ+11/β
Log-Weibull σlog(x)+μ
Kies x1/βx1/βσ++1μ
Gen. Power Weibull β(x+1)1/θ−11/α1
Gompertz log(ββx+1)
and other fields. For a given probabilityp, they are defined byB(p) = T1(q)/(pμ)and L(p)=T1(q)/μ, respectively, whereq=Q(p)is the qf ofXgiven by (15) atu=p.
3.4 Average lifetime and mean residual lifetime functions The average lifetime is given by
tm=
∞
0
[1−F(x;δ,α,ξ)] dx= ∞
j=0 wj
∞
0
G(x;(j+1)α,ξ)dx.
In fields such as actuarial sciences, survival studies and reliability theory, the mean residual lifetime has been of much interest; see, for a survey, Guess and Proschan (1988). Given that there was no failure prior tox0, the residual life is the period from timex0until the time of failure. The mean residual lifetime is given by
m(x0;δ,α,ξ) = E(X−x0|X≥x0;δ,α,ξ)=
{x:x>x0}
(x−x0)f(x;δ,α,ξ) Pr(X>x0)
dx
= [Pr(X>x0)]−1 ∞
0
y f(x0+y;δ,α,ξ)dy
= F(x0;δ,α,ξ)−1 ∞
j=0 wj
∞
0
y g(x0+y;(j+1)α,ξ)dy.
The last integral can be computed from the baseline EW distribution. Further,
m(x0;δ,α,ξ)→E(X)asx0→0.
4 Information theory measures
The seminal idea about information theory was pioneered by Hartley (1928), who defined a logarithmic measure of information for communication. Subsequently, Shannon (1948) formalized this idea by defining the entropy and mutual information concepts. The rel-ative entropy notion (which would later be calleddivergence) was proposed by Kullback and Leibler (1951). The Kullback-Leibler’s measure can be understood like a com-parison criterion between two distributions. In this section, we derive two classes of entropy measures and one class of divergence measures which can be understood as new goodness-of-fit quantities such those discussed by Seghouane and Amari (2007). All these measures are defined for one element or between two elements in theMOEWfamily.
4.1 Rényi entropy
The Rényi entropy ofXwith pdf (8) is given by
HRs(X)= 1
1−s log
Df(x;δ,α,ξ)
sdx
,
wheres∈(0, 1)∪(1,∞).
It is a difficult problem to obtainHRs(X)in closed-form for theMOEWfamily. So, we derive an expansion for this quantity.
By using (9), f(x;δ,α,ξ)scan be expanded as
f(x;δ,α,ξ)s= ∞
j=0
where
wj= ⎧ ⎨ ⎩
ηj(α,δ)= α
sδs(2s) jδj
j! , for 0< δ <1,
νj(α,δ)= αsδj!−s∞k=0(2s)k(k)j
k! (1−1/δ)k, for δ >1. The proof of this expansion is given in Appendix 8.
Finally, based on Equation (16), the Rényi entropy can be expressed as
HRs(X)= 1
1−slog ⎧ ⎨ ⎩
∞
j=0 wj
Dexp[−(j+s)αH(x;ξ)]h(x;ξ)
sdx
⎫ ⎬ ⎭.
An advantage of this expansion is its dependence of an integral which has closed-form for someEWdistributions.
4.2 Shannon entropy
The Shannon entropy ofXis given by
HS(X)=EX
−log[f(X;δ,α,ξ)],
where the log-likelihood function corresponding to one observation follows from (8) as
log[f(x;δ,α,ξ)]=log(δα)+log[h(x;ξ)]−αH(x;ξ)−2 log1−δexp[−αH(x;ξ)].
Thus, it can be reduced to
HS(X)= −log(αδ)+2E
log1− ¯δG¯(X;ξ)−Elog [h(X;ξ)]+αE [H(X;ξ)] .
4.3 Cross entropy and Kullback-Leibler divergence and distance
LetX andY be two random variables with common support R+ whose densities are fX(x;θ1)andfY(y;θ2), respectively. Cover and Thomas (1991) defined thecross entropyas
CX(Y)=EX−logfY(X;θ2)= − ∞
0
fX(z;θ1)logfY(z;θ2)dz.
We consider thatX ∼ MOEW(δx,αx,ξx)andY ∼ MOEW(δy,αy,ξy). After some
algebraic manipulations, we obtain
CX(Y)= −
DfX
(z;δx,αx,ξx)logfY(z;δy,αy,ξy)
dz
= −logδyαy−EX
logh(X;ξy)+αyEX
H(X;ξy) +2EX
log1− ¯δG¯(X;ξy). (17)
An important measure in information theory is the Kullback-Leibler divergence given by
D(X||Y)=CX(Y)−HS(X)=EX
log
fX(X;δx,αx,ξx) fY(X;δy,αy,ξy)
. (18)
Applying (4.2) and (17) in Equation (18) gives
D(X||Y)=log
δxαx δyαy
+EX
log
h(X;ξx) h(X;ξy)
+2EX
log
1− ¯δG¯(X;ξy)
1− ¯δG¯(X;ξx)
+αyEX[H(X;ξy)]−αxEX[H(X;ξx)] . (19)
statistics, which has seen strongly applied to contexts of radar synthetic aperture image processing in both univariate (Nascimento et al. 2010) and polarimetric (or multivariate) (Nascimento et al. 2014) perspectives.
In order to work with measures that satisfied the non-negativity, symmetry and definiteness properties, Nascimento et al. (2010) considered the symmetrization of (19)
dKL(X,Y)= 1
2 [D(X||Y) + D(Y||X)]
=
D
fX
x;δx,αx,ξx−fY
x;δy,αy,ξylog
fX(x;δx,αx,ξx) fY(x;δx,αx,ξx)
≡IntegrandKL(x,y)
dx,
which is given by
2dKL(X,Y)=αy
EX
H(X;ξy)−EY
H(Y;ξy)+αx
EY
H(Y;ξx)]−EX[H(X;ξx)
+EX
log
hX;ξx hX;ξy
+ EY
log
hY;ξy hY;ξx
+2 EX
log
1− ¯δG¯X;ξy
1− ¯δG¯X;ξx
+2 EY
log
1− ¯δG¯Y;ξx 1− ¯δG¯ Y;ξy
.
(20)
Although this measure does not satisfy the triangle inequality, it is usually called the Kullback-Leiblerdistance (Jensen-Shannondivergence). The new measure can be used to answer questions like “how could one quantify the difference in selecting the Phani model with three parameters as the baseline distribution instead of the Weibull Kies distribution which has four parameters?”.
As an illustration for (20), we initially consider two distinct elements of the generated special model from the specifications:H(x;β)=β−1[ exp(βx)−1] andh(x;β)=exp(βx)
in (8). This model will be presented with more details in future sections and its parametric space is represented by the vector(δ,α,β). Suppose that we are interested in quantifying the influence of a nuisance degree in the parameterαover the distance between two distinct elements,(2, 1, 3)and(2, 1+, 3), at such parametric space. Figure 1(a) displays
the integrand of (20) for=0.1, 1, 2 and 4 for which the distances (or areas) associated withdKL(X,Y)are 6.50×10⁻³, 3.56×10⁻¹, 9.46×10⁻¹and 2.25, respectively. It is notable thatdKL(X,Y)takes smaller values for more closer points (or, equivalently, for more closer fits) and, therefore, (20) consists of new goodness-of-fit measures. In Figures 1(b) and 1(c), we show the influence ofη = α/β ondKL([δ,α,β] , [δ,α,β+])(forβ = δ = 3 and
α∈ {1, 3, 9}) and ofδondKL([δ,α,β] , [δ+,α,β])(forβ=α=3 andδ∈ {3, 4, 5}). For all cases, the contaminationtakes values in the interval(−2.9, 2.9).
5 Estimation
Here, we present a general procedure for estimating theMOEW parameters from one observed sample and from multi-censored data. Additionally, we provide a discussion about how one can test the significance of additional parameter at the proposed class. Letx1,. . .,xnbe a sample of sizenfromX. The log-likelihood function for the vector of
parametersθ =(δ,α,ξ)can be expressed as
(θ)=nlog(δα)+ n
i=1
log [h(xi;ξ)]−α n
i=1
H(xi;ξ)−2 n
i=1
log1−δexp[−αH(xi;ξ)]
.
From the above log-likelihood, the components of the score vector,U(θ ) = (Uδ,Uα,
Uξ), are given by
Uδ(θ)=
∂(θ ) ∂δ =
n δ −2
n
i=1
exp[−αH(xi;ξ)]
1−δexp[−αH(xi;ξ)]
,
Uα(θ)=
∂(θ ) ∂α = n α − n
i=1
H(xi;ξ)−2δ n
i=1
H(xi;ξ)exp[−αH(xi;ξ)]
1−δexp[−αH(xi;ξ)]
and
Uξk(θ)=
∂(θ ) ∂ξk =
n
i=1 1 h(xi;ξ)
∂h(xi;ξ) ∂ξk −α
n
i=1
∂H(xi;ξ) ∂ξk
−2δα n
i=1
∂H(xi;ξ) ∂ξk
exp[−αH(xi;ξ)]
1−δexp[−αH(xi;ξ)]
.
Finally, the partitioned observed information matrix for theMOEWfamily is
J(θ)= −
⎛ ⎜ ⎜ ⎜ ⎜ ⎝
Uδδ Uδα | Uδξ
Uαδ Uαα | Uαξ
−− −− −− −− Uδξ Uαξ | Uξ ξ
⎞ ⎟ ⎟ ⎟ ⎟ ⎠,
whose elements are
Uδδ(θ)= −nδ−2,Uδα(θ)=2
n
i=1
H(xi;ξ)exp[−αH(xi;ξ)]
1−δexp[−αH(xi;ξ)]2
,
Uδξk(θ)=2α n
i=1
∂H(xi;ξ) ∂ξk
exp[−αH(xi;ξ)]
1−δexp[−αH(xi;ξ)]
2,
Uαα(θ)= −
n α2+2δ
n
i=1
H(xi;ξ)2exp[−αH(xi;ξ)]
1−δexp[−αH(xi;ξ)]
Uαξk(θ)= −2δ
n
i=1
∂H(xi;ξ) ∂ξk
exp[−αH(xi;ξ)]
1−δexp[−αH(xi;ξ)]
&
1− αH(xi;ξ) 1−δexp[−αH(xi;ξ)]
'
+ n
i=1
∂H(xi;ξ) ∂ξk and
Uξkξj(θ)=
n
i=1 1 h(xi;ξ)
∂2h(xi;ξ) ∂ξkξj −
1 h(xi;ξ)
∂h(xi;ξ) ∂ξk
∂h(xi;ξ) ∂ξj
−α
n
i=1
∂2H(xi;ξ) ∂ξkξj
−2αδ n
i=1
exp[−αH(xi;ξ)]
1−δexp[−αH(xi;ξ)]
∂2H(xi;ξ) ∂ξkξj −
∂H(xi;ξ) ∂ξk
αH(xi;ξ)
1−δexp[−αH(xi;ξ)]
.
When some standard regularity conditions are satisfied (Cox and Hinkley 1974),
one can verify that √n ( α,(δ,(ξ − [α, δ, ξ]
converges in distribution to the
multivariate Np+20,K([α,δ, ξ])−1 distribution, where p denotes the dimension of ξ and K([α,δ,ξ]) is the expected information matrix for which the limit identity limn→∞Jn([α,δ,ξ]) = K([α, δ, ξ])is satisfied. Based on this result, one can compute
confidence regions for theMOEW parameters. Such regions can be used as decision criteria in several practical situations.
For checking ifδis statistically different from one, i.e. for testing the null hypothesis H0 : δ = 1 againstH1 : δ = 1, we use the LR statistic given by LR = 2
((θ)−()θ), where(θis the vector of unrestricted MLEs underH1and)θis the vector of restricted MLEs underH0. Under the null hypothesis, the limiting distribution of LR is aχ12distribution. If the test statistic exceeds the upper 100(1−α)% quantile of theχ12distribution, then we reject the null hypothesis.
Censored data occur very frequently in lifetime data analysis. Some mechanisms of censoring are identified in the literature as, for example, types I and II censoring (Lawless 2003). Here, we consider the general case of multi-censored data: there are n=n0+n1+n2subjects of whichn0is known to have failed at the timesx1,. . .,xn0,n1 is known to have failed in the interval [si−1,si],i=1,. . .,n1, andn2survived to a timeri
,i= 1,. . .,n2, but not observed any longer. Note that type I censoring and type II cen-soring are contained as particular cases of multi-cencen-soring. The log-likelihood function ofθ =(δ,α,ξ)for this multi-censoring data reduces to
(θ)=n0log(δα)+
n0
i=1
log [h(xi;ξ)]−α n0
i=1
H(xi;ξ)−2 n0
i=1
log1−δexp[−αH(xi;ξ)]
+ n1
i=1 log
*
1−exp[−αH(si;ξ)]
1−δexp[−αH(si;ξ)]
− 1−exp[−αH(si−1;ξ)] 1−δexp[−αH(si−1;ξ)]
+
+n2log(δ)−α
n2
i=1
H(ri;ξ)−2 n2
i=1
log1−δexp[−αH(ri;ξ)]
.
(21)
The score functions and the observed information matrix corresponding to (21) is too complicated to be presented here.
6 Two special models
In this section, we study two special MOEW models, namely the Marshall-Olkin
provide plots of the density and hazard rate functions for some parameters to illustrate the flexibility of these distributions.
6.1 TheMOMWmodel
For H(x;λ,γ ) = xγ exp(λx) and h(x;λ,γ ) = xγ−1exp(λx)(γ + λx), we obtain the
MOMWdistribution. Its density function is given by
f(x;α,δ,λ,γ )=δα(γ+λx)xγ−1 exp[λx−αx
γexp(λx)]
1−δexp[−αxγexp(λx)]2, x>0,
whereλ,γ ≥ 0. Ifδ = 1, it leads to the special case of the modified Weibull (MW) distribution (Laiet al.2003). In addition, whenλ=0, it gives the Weibull distribution. Its cdf and hrf are given by
F(x;α,δ,λ,γ )= 1−exp[−αx
γexp(λx)]
1−δexp[−αxγexp(λx)]
and
τ (x;α,δ,λ,γ )= αx
γ−1exp(λx)(γ+λx)
1−δexp[−αxγexp(λx)],
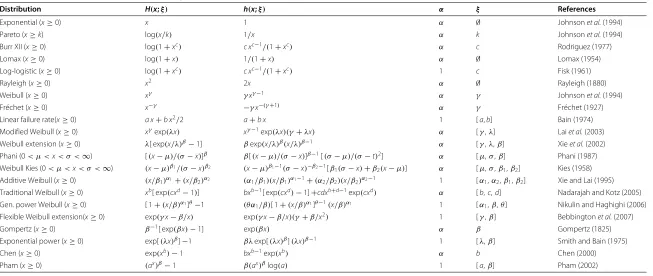
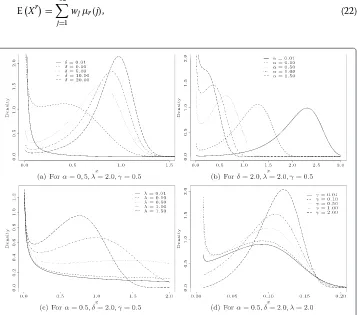
respectively. In Figures 2(a), 2(b), 2(c) and 2(d), we note some different shapes of the
MOMWpdf. Further, Figures 3(a), 3(b), 3(c) and 3(d) display plots of theMOMWhrf, which can have increasing, decreasing, non-monotone and bathtub forms.
Therth raw moment of theMOMWdistribution comes from (13) as
EXr= ∞
j=1
wjμr(j), (22)
Figure 2 TheMOMWdensity functions.(a)Forα=0.5,λ=2.0,γ=0.5.(b)For
Figure 3 TheMOWNhrfs.(a)Forα=0.5,λ=2.0,γ=0.5.(b)Forδ=2.0,λ=2.0,γ =0.5.(c)For
δ=5.0,δ=2.0,γ=0.5.(d)Forα=0.5,δ=2.0,λ=2.0.
whereμr(j)= 0∞xrg(x;(j+1)α,γ,λ))dxdenotes therth raw moment of theMW
dis-tribution with parameters(j+1)α,γ andλ. Carrascoet al.(2008) determined an infinite representation forμr(j)given by
μr(j)= ∞
i1,...,ir=1
Ai1,...,ir(sr/γ +1)
[(j+1)α]sr/γ , (23)
where
Ai1,...,ir =ai1,. . .,air and sr=i1,. . .,ir,
and
ai=
(−1)i+1ii−2 (i−1)!
λ γ
i−1 .
Hence, theMOMWmoments can be obtained directly from (22) and (23).
Letx1,. . .,xnbe a sample of sizenfromX∼ MOMW(α,δ,λ,γ ). The log-likelihood
function for the vector of parametersθ =(α,δ,λ,γ )can be expressed as
(θ) = nlog(δα)+ n
i=1
log(γ+λxi)+(γ−1) n
i=1
log(xi)+λ n
i=1 xi−α
n
i=1
xλi exp(λxi)
−2
n
i=1
log1−δexp−αxγi exp(λxi)
6.2 TheMOGmodel
ForH(x;β)=β−1[ exp(βx)−1] andh(x;β)=exp(βx), we obtain theMOGdistribution. Its pdf is given by
f(x;α,δ,β)= δαexp{βx−α/β[ exp(βx)−1]}
1−δexp{−α/β[ exp(βx)−1]}2
, x>0,
where −∞ < β < ∞. For δ = 1, it follows the Gompertz distribution as a special case. TheMOG model is a special case of the Marshall-Olkin Makeham distribution (EL-Bassiouny and Abdo 2009). The cdf and hrf of theMOGdistribution are given by
F(x;α,δ,β)= 1−exp{−α/β[ exp(βx)−1]}
1−δexp{−α/β[ exp(βx)−1]}
and
τ (x;α,δ,β)= αexp(βx)
1−δexp{−α/β[ exp(βx)−1]}.
Figures 4(a), 4(b) and 4(c) display some plots of the density functions for some values ofα,δandβ. The hrf of the Gompertz distribution is increasing (β >0) and decreasing (β <0). Besides these two forms, Figures 5(a), 5(b) and 5(c) indicate that theMOGhrf can be bathtub shaped.
From Equation (15), theMOGqf becomes
Q(u)=β−1log
β αlog
1−δu
1−u
+1
.
Letx1,. . .,xnbe a sample of sizenfrom theMOGmodel. The log-likelihood function
for the vector of parametersθ =(δ,α,β)can be expressed as
(θ)=nlog(δα)+β n
i=1 xi−
α β
n
i=1
exp(βxi)−1
−2
n
i=1
log1−δexp{−α[ exp(βxi)−1]/β}
.
7 Simulation and applications
This section is divided in two parts. First, we perform a simulation study in order to assess the performance of the MLEs on some points at the parametric space of one of the special
Figure 4 TheMOGdensity functions.(a)Forα=0.5,β=0.7.(b)Forδ=2.0,β=2.0.
Figure 5 TheMOGhrfs.(a)Forα=25,β=2.0.(b)Forδ=0.2,β=0.5.(c)Forα=0.01,δ=0.5.
models. Second, an application to real data provides evidence in favor of one distribution
in theMOEWclass.
7.1 Simulation study
We present a simulation study by means of Monte Carlo’s experiments in order to assess the performance of the MLEs described in Section 5. To that end, we work with theMOG distribution. One of advantages of this model is that its cdf has tractable analytical form. This fact implies in a simple random number generation (RNG) determined by theMOG qf given in Section 6.2. TheMOGgenerator is illustrated in Figure 6.
The simulation study is conducted in order to quantify the influence ofη =α/βover the estimation of the extra parameterδ. It is known that η > 1 gives the Gompertz distribution which presents mode at zero or, for η < 1, having their modes at x∗ = β−1[ 1 − log(η)]. An initial discussion using the Kullback-Leibler distance derived in Section 4.3 points out that increasing the contamination (or the bias of the estimates) can affect the quality of fit.
In this study, the following scenarios are taken into account. For the sample sizen = 50, 100, 150, 200, we adopt as the true parameters the following cases:
(i) Scenarioη <1:(α,β)=(1, 2)andδ∈ {0.3, 1, 4}; (ii) Scenarioη=1:(α,β)=(2, 2)andδ∈ {0.3, 1, 4}; (iii) Scenarioη >1:(α,β)=(4, 2)andδ∈ {0.3, 1, 4}.
Also, we use 10,000 Monte Carlo’s replications and, at each one of them, we quantify (i) the average of the MLEs and (ii) the mean square error (MSEs).
Table 3 gives the results of the simulation study. In general, the MLEs present smaller values of the biases and MSEs when the sample size increases. It is important to high-light the following atypical case: for the MLEs ofαat the scenarios(α,δ,β) ∈ {(1, 4, 2),
(2, 1, 2), (4, 0.3, 2), (4, 1, 2)} and ofδ at(4, 0.3, 2), the associated biases do not have an inverse monotonic relationship with sample sizes, as expected.However, based on the fact
Table 3 Performance of the MLEs for theMOGdistribution
(α,δ,β) n θi(MSE(θi))
α(MSE (α)) δ(MSE (δ)) β(MSE (β))
Forη <1
(1, 0.3, 2) 50 1.201 (2.837) 0.478 (0.883) 2.502 (1.698)
· 100 1.181 (1.745) 0.406 (0.290) 2.320 (1.238)
· 150 1.156 (1.299) 0.385 (0.195) 2.249 (1.015)
· 200 1.103 (1.008) 0.358 (0.134) 2.244 (0.899)
(1, 1, 2) 50 1.202 (1.965) 1.620 (5.938) 2.425 (1.630)
· 100 1.134 (1.199) 1.361 (2.690) 2.305 (1.145)
· 150 1.079 (0.884) 1.231 (1.638) 2.288 (0.979)
· 200 1.063 (0.735) 1.180 (1.244) 2.250 (0.845)
(1, 4, 2) 50 0.965 (0.810) 4.764 (26.798) 2.544 (1.561)
· 100 0.958 (0.544) 4.398 (14.813) 2.390 (1.025)
· 150 0.959 (0.443) 4.283 (11.454) 2.328 (0.831)
· 200 0.970 (0.369) 4.246 (8.953) 2.262 (0.653)
Forη=1
(2, 0.3, 2) 50 2.246 (7.571) 0.426 (0.473) 2.787 (3.543)
· 100 2.137 (4.502) 0.361 (0.172) 2.561 (2.473)
· 150 2.073 (3.279) 0.341 (0.116) 2.471 (1.981)
· 200 2.011 (2.596) 0.324 (0.083) 2.434 (1.698)
(2, 1, 2) 50 2.161 (5.462) 1.481 (4.886) 2.687 (3.051)
· 100 2.012 (3.115) 1.199 (1.798) 2.543 (2.157)
· 150 1.947 (2.277) 1.100 (1.062) 2.483 (1.763)
· 200 1.923 (1.874) 1.056 (0.787) 2.430 (1.507)
(2, 4, 2) 50 1.805 (2.404) 4.534 (21.279) 2.785 (2.783)
· 100 1.817 (1.681) 4.202 (12.456) 2.572 (1.869)
· 150 1.828 (1.390) 4.097 (9.474) 2.487 (1.527)
· 200 1.861 (1.153) 4.075 (7.495) 2.388 (1.184)
Forη >1
(4, 0.3, 2) 50 3.770 (13.137) 0.336 (0.191) 3.400 (6.701)
· 100 3.737 (8.129) 0.304 (0.072) 2.951 (4.152)
· 150 3.731 (6.119) 0.298 (0.051) 2.764 (3.184)
· 200 3.685 (4.865) 0.289 (0.038) 2.676 (2.613)
(4, 1, 2) 50 3.845 (13.615) 1.272 (3.153) 3.149 (6.239)
· 100 3.735 (7.757) 1.076 (1.043) 2.833 (4.060)
· 150 3.717 (5.760) 1.024 (0.634) 2.689 (3.150)
· 200 3.721 (4.759) 1.000 (0.472) 2.588 (2.601)
(4, 4, 2) 50 3.608 (8.172) 4.605 (21.140) 3.036 (5.150)
· 100 3.677 (5.234) 4.262 (11.467) 2.668 (2.989)
· 150 3.737 (4.039) 4.172 (8.228) 2.510 (2.169)
Figure 7 MSE curves forδ∈ {0.3, 1, 4},η=0.5, 1, 2 andn=200.(a)MSE((α),(b)MSE((β),(c)MSE((δ).
that their MSEs tend to zero, we can expect that there exists a sample sizen0such that biases of the MLEs decrease when the sample sizes increase fromn0.
The results provide evidence that the scenarios under the conditionη >1 yield a hard estimation (having larger variation ranges of the MSEs than those obtained for the cases whenη < 1) forα andβ parameters, and that the MLEs present smaller values of the MSEs under such conditions. Figure 7 illustrates the above behavior for the casesδ ∈ {0.3, 0.8, 1, 2, 4}andn = 200. In summary, the scenario with less numerical problems is
(η,δ)=(2, 0.1), whereas that one which requires more attention for estimating theMOG parameters is(η,δ)=(0.5, 4).
7.2 Applications
Here, the usefulness of theMOEW distribution is illustrated by means of two real data sets.
7.2.1 Uncensored data
Here, we compare the fits of some special models of theMOEWfamily using a real data set. The estimation of the model parameters is performed by the maximum likelihood method discussed in Section 5. We use themaxLikfunction of themaxLikpackage in Rlanguage. In this function, if the argument “method” is not specified, a suitable method is selected automatically. For this application, we use the Newton-Raphson method. The data represent the percentage of body fat determined by underwater weighing for 250 men. For more details about the data see http://lib.stat.cmu.edu/datasets/bodyfat.
Table 4 provides some descriptive measures. They suggest an empirical distribution which is slightly asymmetric and platykurtic.
We compare the classical models and generalized models within theMOfamily. The null hypothesisH0 : δ = 1 is tested againstH1: δ = 1 using the LR statistic. The
com-parisons are presented in Table 5. For theMOW andMOEPmodels, one cannot say
that the parameterδis statistically different from one at the 10% significance level. Based on this result, we fit theW, exponential power (EP),MOGand Marshall-Olkin flexible Weibull extension (MOFWE) models to the current data (see Table 1). These models are compared with two other three-parameter models, namely: the modified Weibull (MW)
Table 4 Descriptive statistics
Mean Mode Median Std. Desv. Skewness Kurtosis Min Max
Table 5 Comparison of fitted models using the LR test
Null hypothesis Models LR statistic p-value
δ=1
G×MOG 11.2963 0.0008
W×MOW 0.7638 0.3822
EP×MOEP 2.1959 0.1384
FWE×MOFWE 12.3659 0.0004
and generalized Birnbaum-Saunders (GBS) (Owen 2006) distributions. TheGBSdensity is given by
f(x;φ,η,κ)= 1 φ√2π ηxκ
,
1−κ+ ηκ x
-exp
&
− 1
2φ2
(x−η)2 ηx2κ
'
, x>0.
In Table 6, we present the MLEs (standard errors in parentheses) of the parameters of the fittedMOFWE,MOG,EP,W,MWandGBSdistributions. Also, we provide the goodness-of-fit measures (p-values in parentheses). Thus, these values indicate that the null models are strongly rejected for theMOFWE andMOG distributions, since the associatedp-values are much lower than 0.001.
Table 7 gives the values of the Akaike information criterion (AIC), Bayesian informa-tion criterion (BIC), consistent Akaike informainforma-tion criterion (CAIC) and Hannan-Quinn information criterion (HQIC). Since the values of the AIC, CAIC and HQIC are smaller for theMOFWEdistribution compared to those values of the other fitted models. Thus, this new distribution seems to be a very competitive model to explain the current data.
Figures 8(a) and 8(b) display the estimated density and survival functions of the
MOFWEdistribution. The plots confirm the excellent fit of this distribution to the data. Figure 8(c) shows that the estimatedMOFWEhrf is an increasing curve.
7.2.2 Censored data
Now, we consider a set of remission times from 137 cancer patients [Lee and Wang (2003), pag. 231]. Lee and Wang (2003) showed that the log-logistic (LL) model provides a good fit to the data. Ghitanyet al.(2005) compared the fits of theMOW andW models to these data. Now, we present a more detailed study by comparing the fittedW,LL,EP,
MOW, Marshall-Olkin log-logistic (MOLL),MOEPandGBS models to these data.
Table 6 MLEs and goodness-of-fit statistics
Model Estimates (standard errors) Goodness-of-fit (p-value)
α(orφ) δ(orη) γ(orκ) β(orλ) AD CM
MOFWE 1 2.9136 0.0552 14.3666 0.1082 0.0115
× (1.1321) (0.0022) (3.7615) (0.9939) (0.9987)
MOG 0.1289 18.8183 – 0.0183 0.6825 0.0938
(0.0151) (2.9308) × (0.0063) (0.0739) (0.1361)
EP 1 1 0.0359 1.7778 0.2537 0.0273
× × (0.0008) (0.0870) (0.7301) (0.8800)
W 0.0004 1 2.5373 – 0.4344 0.0667
(0.0002) × (0.1434) × (0.2985) (0.3079)
MW 0.0007 1 2.2292 0.0149 0.2761 0.0384
(0.0007) × (0.4384) (0.0191) (0.6546) (0.7094)
GBS 1.3189 18.7623 0.1328 × 0.5672 0.0876
Table 7 Statistics AIC, BIC, CAIC and HQIC
Models AIC BIC CAIC HQIC
MOFWE 1753.989 1764.553 1754.087 1758.241
MOG 1767.305 1777.870 1767.403 1771.557
EP 1764.136 1771.178 1764.184 1766.970
W 1756.843 1763.886 1756.892 1759.678
MW 1757.997 1768.561 1758.094 1762.248
GBS 1761.136 1771.701 1761.234 1765.388
The functionsH(x;γ,c)=log(1+γxc)andh(x;γ,c)=γc xc−1/(1+γ xc)are associated
with theLLmodel.
The hypothesis that the underlying distribution isW (orEP) versus the alternative hypothesis that the distribution is the MOW (orMOEP) is rejected withp-value = 0.0055 (orp-value =<0.0001). Further, the hypothesis test that the underlying distribu-tion isLLversus theMOLLdistribution yields thep-value=1.0000. Thus, we compare theMOW,MOEP,LLandGBSmodels to determine which model gives the best fit to the current data.
Table 8 lists the MLEs (and corresponding standard errors in parentheses) of the param-eters and the values of the AD and CM statistics (theirp-values in parentheses). The figures in this table, specially thep-values, suggest that theMOW distribution yields a better fit to these data than the other three distributions.
Table 9 lists the values of the AIC, BIC, CAIC and HQIC statistics. The figures in this table indicate that there is a competitiveness among theMOW,MOEP andLL models. However, if we observe the Figures 9(a), 9(b) and 9(c), we note that theMOW andMOEPmodels present better fits to the current data.
Figure 9(d) really shows that theMOW andMOEPdistributions present good fits
to the current data. We can conclude that the MOW and MOEP distributions are
excellent alternatives to explain this data set.
8 Conclusion
In this paper, the Marshall-Olkin extended Weibull family of distributions is proposed and some of its mathematical properties are studied. The maximum likelihood procedure is
Table 8 MLEs and goodness-of-fit statistics
Model
Estimates (standard errors) Goodness-of-fit (p-value)
α(orφ) δ(orη) γ(orκorβ) c(orλ) AD CM
MOW 0.0037 0.0736 1.5719 − 0.1889 0.0264
(0.0043) (0.0727) (0.1616) × (0.8994) (0.8908)
MOEP − 0.0233 0.0144 1.6012 0.2057 0.0279
× (0.0165) (0.1423) (0.0042) (0.8686) (0.8733)
GBS 1.6313 7.1422 0.3356 − 1.2753 0.2116
(0.1226) (0.7374) (0.0314) × (0.0025) (0.0038)
LL − − 0.0427 1.6900 0.2891 0.0380
× × (0.0118) (0.1249) (0.6101) (0.7164)
used for estimating the model parameters. Two special models in the family are described with some details. In order to assess the performance of the maximum likelihood esti-mates, a simulation study is performed by means of Monte Carlo experiments. Special models of the proposed family are compared (through goodness-of-fit measures) with other well-known lifetime models by means of two real data sets. The proposed model outperforms classical lifetime models to these data.
Appendix: An expansion forf(x;δ,α,ξ )F(x;δ,α,ξ )c
Here, we obtain an expansion for the quantityf(x;δ,α,ξ )F(x;δ,α,ξ )c. First, we consider an expansion forF(x;δ,α,ξ )c. Based on (5), the power of the cdf can be expressed as
F(x;δ,α,ξ )c= {1−exp[−αH(x;ξ)]}c
≡A
{1−δexp[−αH(x;ξ)]}−c
≡B
.
Applying expansion (9), we have
A= ∞
k=0
(−1)k
c k
exp[−kαH(x;ξ)] .
Now, we expand the quantityB. Equation (9) under the restrictionδ <1 (implying that
δexp[−αH(x;ξ)]<1) yields
B= ∞
j=0
(c)j j! δ
j
exp[−jαH(x;ξ)] .
Moreover, it is clear that δ = 1 implies B = 1. Finally, for δ > 1 (i.e., {1 − δ
exp[−αH(x;ξ)]}>1), the quantityBcan be rewritten as
B=1−[ 1− {1−δexp[−αH(x;ξ)]}−1]c.
Table 9 Statistics AIC, BIC, CAIC and HQIC
Models AIC BIC CAIC HQIC
MOW 843.1171 851.8770 843.2975 846.6769
MOEP 843.1898 851.9498 843.3703 846.7497
GBS 858.3686 867.1285 858.5490 861.9284
Figure 9 Plots of the estimated.(a)Q-Q plot ofMOW,(b)LL,(c)MOEPdistributions and(d)
Kaplan-Meier curve estimated survival and upper and lower 95% confidence limits for the cancer patients.
Using the binomial expansion, we have
B= ∞
j=0
(−1)j
c
j 1−
1−δexp [−αH(x;ξ)]−1 j
.
Thus,
F(x;δ,α,ξ )c=I(δ<1)
∞
j,k=0
(−1)k (c)j j!
c k
δj exp[−(j+k)αH(x;ξ)]
+I(δ=1)
∞
k=0
(−1)k
c k
exp[−kαH(x;ξ)]
+I(δ>1)
∞
j,k=0
(−1)j+k
c k
c j
exp[−kαH(x;ξ)]