This publication has been compiled by Timothy Moravek, Kate Brown and Holly Reid of the Department of Agriculture and Fisheries.
The authors would like to thank Mick Sullivan, Isabel Bryce, Leigh Smith and others from the Department of Environment and Heritage Protection for their valuable input.
© State of Queensland, 2017
The Queensland Government supports and encourages the dissemination and exchange of its information. The copyright in this publication is licensed under a Creative Commons Attribution 4.0 International (CC BY 4.0) licence.
Under this licence you are free, without having to seek our permission, to use this publication in accordance with the licence terms.
You must keep intact the copyright notice and attribute the State of Queensland as the source of the publication. Note: Some content in this publication may have different licence terms as indicated.
For more information on this licence, visit https://creativecommons.org/licenses/by/4.0/.
TABLE OF CONTENTS
What are improved practices? ... 4
What can you find in this catalogue? ... 4
What is land condition and how can you tell if it is degraded? ... 4
Maintaining land condition... 7
Managing land condition with stocking rates and wet season spelling ... 7
Rehabilitating degraded country ... 11
Rehabilitation of poor (C-Condition) or very poor (D-Condition) condition country ... 12
Rehabilitation of gullied areas ... 14
Decision Support Tools ... 18
Breedcow and Dynama ... 18
BRICK ... 18
FORAGE ... 19
Grazing BMP ... 19
Stocktake Plus ... 20
Veg Machine ... 20
Table of figures Figure 1: Land in ‘A’, or good, condition ... 5
Figure 2: Land in ‘B’, or fair, condition ... 5
Figure 3: Land in ‘C’, or poor, condition ... 5
Figure 4: Land in ‘D’, or very poor, condition ... 5
Figure 5: Results from the Wambiana grazing Trial, Burdekin catchment ... 8
Figure 6: Results from the Galloway Plains grazing trial, Central Queensland ... 9
Figure 7: Long Term Carrying Capacity vs Stocking Rate ... 10
Figure 8: Results from a land rehabilitation trial Spyglass Research Station, Burdekin Catchment .... 12
Figure 9: Results from a land rehabilitation exercise, Fitzroy Catchment ... 13
Figure 10: General costing information on gully rehabilitation methods ... 14
Figure 11: Case study of gully rehabilitation,Burdekin catchment ... 15
Best management practices for maintaining and improving land condition on grazing lands, Department of Agriculture and Fisheries, 2017
What are improved practices?
Improved practices are practices that science has verified will improve land condition, environmental outcomes, such as water quality, and business profitability and productivity. In many cases, improved practices are already being used on extensive grazing properties across Australia. The improved practices are recommended to prevent degradation of land condition or, where degradation has already occurred, to improve land condition.
Simply, the improved practices come under a few major themes:
1. Managing land condition with stocking rates and wet season spelling.
2. Rehabilitating poor (c-condition) and very poor (d-condition) country.
3. Rehabilitation of gullied areas
What can you find in this catalogue?
This catalogue aims to provide graziers with a brief overview of outcomes which may occur on property as a result of adopting these improved practices. More importantly, it will provide an extensive set of links to where more comprehensive information can be obtained for those wanting more detail.
For a more complete guide, please refer to Sustainable management of the Burdekin grazing lands available at https://futurebeef.com.au/wp-content/uploads/BurdekinGrazing_final-04a.pdf and Understanding the economics of grazing management practices and systems for improving water quality run-off from grazing lands in the Burdekin and Fitzroy Catchments available at the Queensland Government Publications Portal or at this link - https://goo.gl/6gcvnC
What is land condition and how can you tell if it is degraded?
Assessing land condition can assist in determining the capacity of grazing land to produce useful forage. It is a measure of how well the grazing land ecosystem is working and is dependent on a number of factors including:
how well sunlight is being captured and converted into feed
how well nutrients are being cycled
how well rainfall is being used to grow grass.
Land condition is therefore directly related to carrying capacity, livestock production and profitability of grazing enterprises. Land condition is a relative measure of the health of grazing lands. It has three components which can be assessed, measured and monitored:
soil condition - presence of organic matter, level of erosion and scald features
pasture condition- presence and density of 3P (perennial, productive and palatable) grasses and amount of ground cover
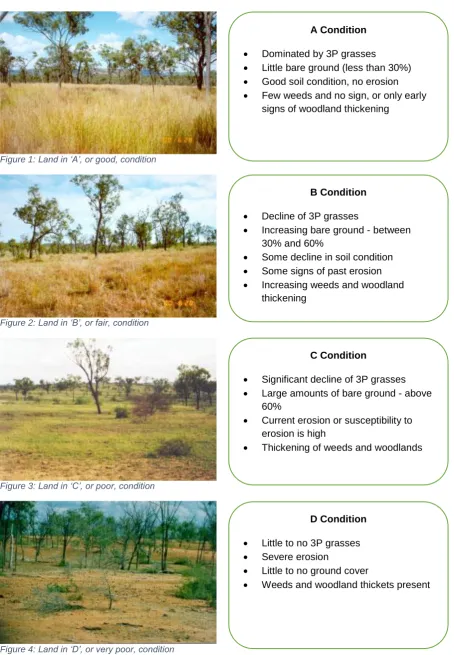
Land condition can be classified into four broad categories:
Figure 1: Land in ‘A’, or good, condition
Figure 2: Land in ‘B’, or fair, condition
Figure 3: Land in ‘C’, or poor, condition
Figure 4: Land in ‘D’, or very poor, condition
B Condition
Decline of 3P grasses
Increasing bare ground - between 30% and 60%
Some decline in soil condition
Some signs of past erosion
Increasing weeds and woodland thickening
A Condition
Dominated by 3P grasses
Little bare ground (less than 30%)
Good soil condition, no erosion
Few weeds and no sign, or only early signs of woodland thickening
C Condition
Significant decline of 3P grasses
Large amounts of bare ground - above 60%
Current erosion or susceptibility to erosion is high
Thickening of weeds and woodlands
D Condition
Little to no 3P grasses
Severe erosion
Little to no ground cover
Best management practices for maintaining and improving land condition on grazing lands, Department of Agriculture and Fisheries, 2017
Want more information?
Since there are likely to be several different land types on a typical grazing property, each with their own unique characteristics, it is important to understand the characteristics of land condition relevant to your property:
https://futurebeef.com.au/knowledge-centre/land-condition/ - this link will take you to a more in-depth article on land condition
https://futurebeef.com.au/knowledge-centre/pasture-photo-standards/ - this link has a pasture photo standards for 39 different land types. Each set of pasture photo standards contain photos of a range of dry matter pasture yields.
Maintaining land condition
Common sense suggests that it is better for the hip pocket to maintain land in a good condition rather than allowing degradation to occur and having to rehabilitate it now, or sometime in the future. The improved practices (see “What are improved practices”) can facilitate maintaining good land condition.
This section provides a snapshot of the economic and environmental results of studies which have used these practices to maintain land condition and some key places more information can be obtained.
Managing land condition with stocking rates and wet season spelling
The key practices for managing land condition and ground cover through stocking rate and spelling management include:
1) Monitor land condition and recognise signs of decline
2) Match stock numbers to forage available
3) Manage for the desirable pasture species
4) Plan a stocking / grazing strategy that includes regular spelling
By following these basic principles, land condition can be sustainably maintained. Long term research has been conducted to investigate the effect of stocking rates and spelling regimes on land condition. Results from the Wambiana grazing trial in the Burdekin Catchment and the Galloway Plains grazing trial in Central Queensland can be seen in Figure 5 and
Figure 6.
_______________________________________________
Forage budgeting- use a tool like Stocktake Plus (http://www.stocktakeplus.com.au) to
help you calculate how long your pasture will last.
Stocktake Plus can also be used to estimates your long term carrying capacity (LTCC)
based on your land types and closest rainfall station.
Knowing about Adult Equivalents (AE’s) helps you determine how much grass your
cattle require. An AE is a 450 kg live weight dry animal that is maintaining weight.
Pregnancy testing will assist you to know how many new calves will be coming during
the calving season and how many lactating breeders the pasture will be carrying. Lactating breeder require up to 35% more pasture than dry stock of equivalent weight.
Photo monitoring sites are useful for tracking land condition over time. Stocktake Plus
also has functions to assist with this.
Best management practices for maintaining and improving land condition on grazing lands, Department of Agriculture and Fisheries, 2017
Figure 5: Results from the Wambiana grazing Trial – a long term stocking rate trial in the Burdekin Catchment
What stocking rates were researched?
Heavy stocking (2x LTCC)
Moderate stocking (at LTCC)
Variable stocking (based on available forage)
Variable stocking (based on SOI)
Rotational wet season spelling (1.5x LTCC)
Researchers noted recovery of
heavily stocked paddocks
during better years was “visually impressive”
but
“largely cosmetic”, and
had no recovery of 3P grasses
Did it work (i.e. maintain land condition, minimise sediment run-off?
Pasture condition and cover has declined dramatically
Pasture condition was maintained, minimised run-off
Pasture condition declined
Pasture condition declined
Pasture condition improved
.
How much money did it make?
$8,000/100ha
$24,000/100ha
$23,000/100ha
$24,000/100ha $23,000/100ha
Note: This is accumulated Gross Margins over 19 years of the trial
Long Term Carrying Capacity vs Stocking Rate
Long term carrying capacity (LTCC) is the average number of cattle a property, or paddock, can sustainably carry over a planning horizon (10 years plus). Consequently, it is a critical
consideration for business planning, property purchase and development.
Figure 6: Results from the Galloway Plains grazing trial – a 13 year stocking rate trial in Central Queensland
What stocking rates were researched?
2 Ha / Steer
3 Ha / Steer
4 Ha / Steer
5 Ha / Steer
8 Ha / Steer
Did it work (i.e. maintain land condition, minimise sediment run-off?
The trial demonstrated that there was a significant pasture yield advantage in the lightest stocking rate treatment
compared with heavier stocking rate
Soil run off was 423 kg/ha in the 4 ha/steer treatment versus 1670/kg/ha at 2 ha/steers over a 10 year period.
How much money did it make?
The heaviest stocking rate treatment (2 ha / steer) made the most money, resulting in $420,000 over 13 years compared with $320,000 in the 3 ha/steer treatment and $300,000 in the 5ha / steer treatment.
Researchers noted
heavier stocking was
more profitable
but unsustainable
and a distinct trade off exists betweenshort term gains
and
long term costs.
Stocking rate and business profitability
The stocking rate which optimises business profitability varies for each business.
Key factors which determine profitability is current grazing and animal
Best management practices for maintaining and improving land condition on grazing lands, Department of Agriculture and Fisheries, 2017
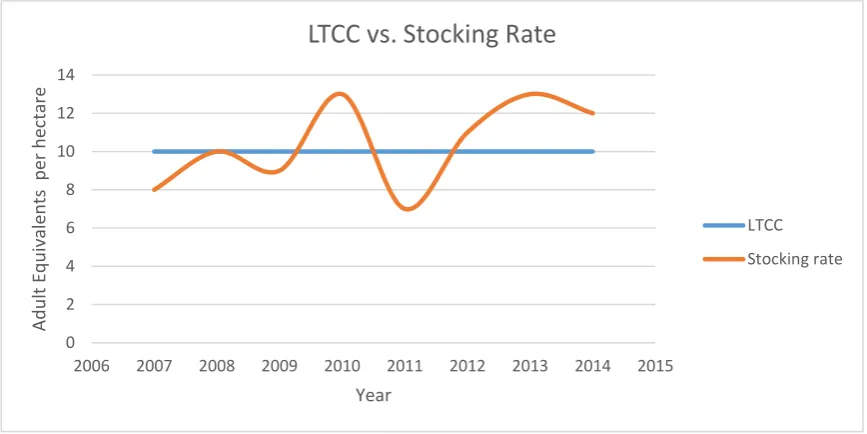
Long term carrying capacity vs stocking rate
Long term carrying capacity gives a benchmark number that can be used to set stocking rate around, recognising that stocking rate is driven by seasonality. The following graph represents how stocking rates (red line) moves around long term carrying capacity. In this way, long term carrying capacity can be thought of as the average stocking rate over a long term horizon.
Figure 7: Long Term Carrying Capacity vs Stocking Rate
Want more information?
https://futurebeef.com.au/projects/wambiana-grazing-trial/
This link has several publications from the Wambiana grazing trial including all the detail of the figures included in this catalogue, including the latest producer report “Managing for a variable climate: long-term results and management recommendations from the Wambiana grazing trial”.
https://futurebeef.com.au/wp-content/uploads/BurdekinGrazing_final-04a.pdf
Sustainable management of the Burdekin grazing lands – a comprehensive guide to the principles and guidelines of sustainable grazing land management in the Burdekin Catchment, including maintaining land condition, improving land condition, stabilising soil and landscapes,
https://www.youtube.com/watch?v=eDdxCV1pnaU
This YouTube video is a “how to guide” on setting up a photo monitoring site.
https://futurebeef.com.au/wp-content/uploads/2012/04/barkly-field-day-aug111.pdf
The outcomes of a producer demonstration site in the Northern Territory on maintaining good land condition at new bores and improving land condition on new bores. Has good information on the evidence and principles of adopting sustainable stocking rates and pasture spelling.
http://www.seqcatchments.com.au/_literature_138847/Achieving_Groundcover_Case_Study_-_Duncombe
A south-east Queensland case study which has quantified some of the impacts of improved ground cover levels on soil loss and water runoff.
https://futurebeef.com.au/workshops/sustainable-grazing/
This link provides details on relevant sustainable grazing courses. 0 2 4 6 8 10 12 14
2006 2007 2008 2009 2010 2011 2012 2013 2014 2015
Ad u lt Eq u iv alent s p er h ecta re Year
LTCC vs. Stocking Rate
LTCC
Rehabilitating degraded country
There are plenty of reasons land can degrade, ranging from seasonality, natural disasters, property inheritance, and infrastructure placement through to mismanagement and overstocking., At some point, the question of “what can be done to restore land condition?” is likely to be asked. This section will give a summary of methods which have been investigated through research and case studies, results, and costs and benefits. There is more information in the individual reports in the next section.
See the next page for research and case studies on rehabilitation of poor or very poor condition country.
Not all soil types and land types are conducive to mechanical methods of rehabilitation. It
is important to understand land type characteristics such as erodibility, solubility and fertility.
The appropriate mix of pasture seed depends on climate, rainfall and soil but should
contain a mix of native pastures, stylos, cultivar species and other 3P species.
Construction of a diversion bank above the area may be required to divert water off the
area. Ensure that the area where the water is diverted to is suitable.
Fencing to exclude stock during pasture establishment and subsequent management of
Best management practices for maintaining and improving land condition on grazing lands, Department of Agriculture and Fisheries, 2017
Rehabilitation of poor (C-Condition) or very poor (D-Condition) condition country
Figure 8: Results from a land rehabilitation trial at Spyglass Research Station located in the Burdekin Catchment
Images source: Courtesy of Trevor Hall, taken from the publication “Quantifying the Economic Impacts of Rehabilitating Degraded Lands in the Burdekin Catchment”.
What methods were researched?
Deep ripping
Crocodile seeding
Chisel ploughing
What were the results?
2900kg/ha more dry matter
1500kg/ha more dry matter
2300kg/ha more dry matter
Note: Results will vary with land type and seasons.
What did it cost? What did it return?
Cost: $260/ha Return: 4.36%
Cost: $150/ha Return: 4.37%
Cost: $210/ha Return: 4.55%
Figure 9: Results from a land rehabilitation exercise in the Fitzroy Catchment
Image source: Courtesy of Fitzroy Basin Association as presented in Economic modelling of grazing systems in the Fitzroy and Burdekin Catchments IIA – Land regeneration case studies
What methods were researched?
Aerial seeding & Herbicide application o Bambatsi
o Forage Sorghum
Wet Season Spelling
What were the results?
Between 2008 and 2011 recovery to “B” condition was achieved
Note: Results will vary with land type and seasons.
What did it cost? What did it return?
Cost: $141/ha
Return: ~8.00%
Best management practices for maintaining and improving land condition on grazing lands, Department of Agriculture and Fisheries, 2017
Rehabilitation of gullied areas
There are a combination of techniques available for the rehabilitation of gullied areas. Rehabilitation of gullied areas is generally thought to be a public benefit rather than have significant private benefits for landholders.
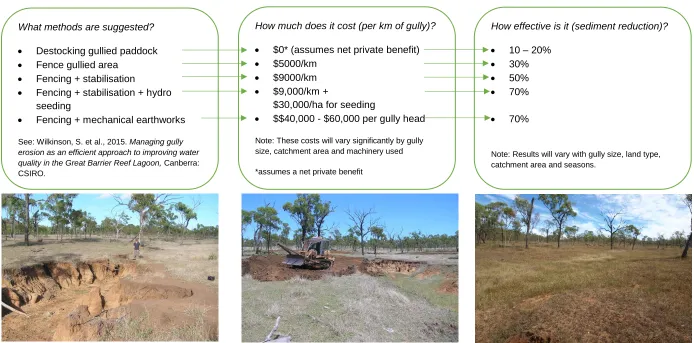
Figure 10: General costing information on gully rehabilitation methods
\
Photos show a gully prior to rehabilitation, during mechanical intervention and 2 years after rehabilitation. This gully is located in the Burdekin Catchment. What methods are suggested?
Destocking gullied paddock
Fence gullied area
Fencing + stabilisation
Fencing + stabilisation + hydro seeding
Fencing + mechanical earthworks
See: Wilkinson, S. et al., 2015. Managing gully erosion as an efficient approach to improving water quality in the Great Barrier Reef Lagoon, Canberra: CSIRO.
How much does it cost (per km of gully)?
$0* (assumes net private benefit)
$5000/km
$9000/km
$9,000/km +
$30,000/ha for seeding
$$40,000 - $60,000 per gully head
Note: These costs will vary significantly by gully size, catchment area and machinery used *assumes a net private benefit
How effective is it (sediment reduction)?
10 – 20%
30%
50%
70%
70%
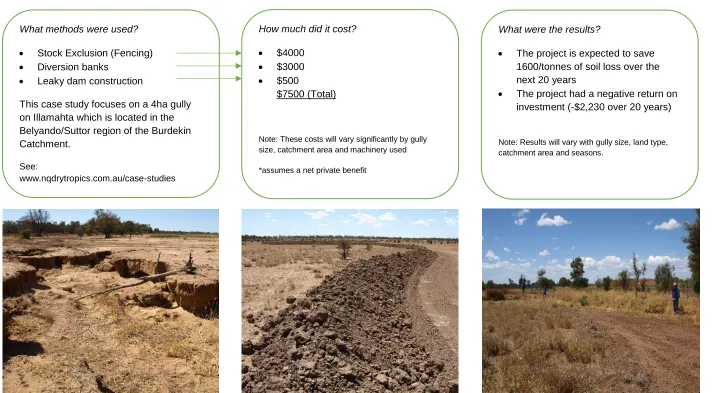
Figure 11: Case study of gully rehabilitation in the Burdekin catchment
Photos of Illamahta gully site, showing a portion of the gully, contour bank and appropriate area to spread water from end of contour.
Figure 12: Case study of gully rehabilitation in the Fitzroy catchment
What methods were used?
Stock Exclusion (Fencing)
Diversion banks
Leaky dam construction
This case study focuses on a 4ha gully on Illamahta which is located in the Belyando/Suttor region of the Burdekin Catchment.
See:
www.nqdrytropics.com.au/case-studies
How much did it cost?
$4000
$3000
$500
$7500 (Total)
Note: These costs will vary significantly by gully size, catchment area and machinery used *assumes a net private benefit
What were the results?
The project is expected to save 1600/tonnes of soil loss over the next 20 years
The project had a negative return on investment (-$2,230 over 20 years)
Best management practices for maintaining and improving land condition on grazing lands, Department of Agriculture and Fisheries, 2017 What methods were used?
Gully head reshaping, diversion bank, fencing, pervious weir
Whoa boys, diversion banks, silt trap, chutes, fencing
Silt trap, stick rake, diversion banks, gully head reshaping, whoa boys, rock chute, fencing
Gully head reshaping, rock chute, diversion banks, alternative watering point, stick rake, fencing
Diversion bank, swales, fencing
Diversion bank, gully head reshaping, stick rake, whoa boys, fencing
How much did it cost?
$49,433
$57,676
$81,727
$109,311
$58,818
$151,402
Note: These costs will
vary significantly by gully size, catchment area and machinery used
*assumes a net private benefit
What were the results? (Tonnes/annum)
259
794
1069
164
495
410
Note: Results will vary with gully size, land type, catchment area and seasons.
Important information
Gully rehabilitation activities:
may cause erosion problems on adjacent country if incorrectly applied
should be designed and performed under the guidance of trained specialists
result in public good returns through improved water quality
Want more information?
http://www.capeyorkwaterquality.info/rehab-research/report/03-local-scale
Direct rehabilitation of alluvial gullies at a local scale, goes into the different methods involved in detail as well as road and fence erosion.
http://wildlife.lowecol.com.au/files/Gully-Rehabilitation.pdf
Gully rehabilitation and stabilisation published by the Northern Territory Government. Explains the common causes of gully erosion as well as the methods of treatment accompanied by diagrams.
https://drive.google.com/file/d/0BwSfElDILIEZdFpfWm9MM0VGU2M/view
Case study published by NQ Dry Tropics on Dan Lyon’s property Niall, discussing preferential grazing and its impact on gully erosion.
https://drive.google.com/file/d/0BwSfElDILIEZTnRMWnlJOE1uWEE/view
Case study published by NQ Dry Tropics on Illamahta. The case studies shows how the management of a large gully erosion problem with the use of diversion banks, a leaky brush weir and fencing is expected to reduce soil loss and recondition the gully.
https://drive.google.com/file/d/0BwSfElDILIEZdUVhQlgzN1BkY0E/view
NQ Dry Tropics Case Study, Terry Creek. Riparian fencing along Terry Creek for the management of erosion issues as well as gully reshaping, wet season spelling, and diversion banks.
http://www.qaseeds.com.au/docs/qcl_planting_guide.pdf
Best management practices for maintaining and improving land condition on grazing lands, Department of Agriculture and Fisheries, 2017
Decision Support Tools
This section has an overview of some of the freely available decision support tools available for grazing businesses to assess the impact of adopting management practices on their properties.
Breedcow and Dynama
Breedcow is a free economic decision-making tool designed for graziers by the Department of Agriculture and Fisheries (DAF). It enables graziers to evaluate the profitability of their property and to assist with herd level decision making.
Breedcow is useful for determining the herd gross margin and/or whole of business returns based on property level information and records. Breedcow calculates expected sales, husbandry costs, and gross margins across extensive herd structures. This information can be used to ascertain the economic implications of making a management practice change.
Benefits of using Breedcow include:
Comparing the likely profitability of the herd under different management or turnoff systems.
Making forward projections of stock numbers, sales, cash flow, net income, debt and net worth.
Deciding what to sell when the plan goes sour or what to buy when there is an opportunity. Evaluating long term investments in herd or property improvement to determine the rate of return on extra capital.
To download a copy of Breedcow, visit
https://www.daf.qld.gov.au/animal-industries/beef/breedcow-and-dynama-software
BRICK
The Beef Rough Indicator and Calculator of Key Performance Indicators (BRICK) is another free beef business analysis tool designed by to help graziers assess the current performance of herds and their business. BRICK takes into account livestock transactions, an accurate annual stocktake and
business costs to calculate herd performance, productivity and profitability over recent years.
BRICK calculates productivity indicators as used in the Cashcow research project, such as live weight production ratio, weaner production and male and female live weight production. It also calculates financial key performance indicators, such as operating margin, cost of production and gross margin.
The benefits of using the BRICK include:
Comparing the productivity of your herd against what could be achievable in your situation.
Assessing the trend in productivity of your herd and business over time.
Comparing which part of your herd is the most productive, such as analysing steer performance against breeder performance.
Performing automatic livestock reconciliations and calculating critical information such as
performance indicators such as mortalities and weaning rates and productivity measures such as kg produced.
BRICK provides accurate input for a future options analysis. To download a copy of the BRICK, visit:
https://futurebeef.com.au/knowledge-centre/business-management/brick/
To download a copy of the Cashcow report, visit:
FORAGE
FORAGE is a web-based system which generates and distributes information relating to climate and pasture condition at user-specified locations. The primary aim of FORAGE is to incorporate a number of products such as SILO climate data, satellite imagery and the outputs from GRASP and
AussieGRASS grazing system models, and deliver them in a form that people can easily use to facilitate decision making in grazing land and environmental management.
FORAGE information available for any location in Queensland includes:
a Rainfall and Pasture report
a Rainfall and Pasture by Land Type report
a Ground Cover report
a regional Comparison Ground Cover report
an Indicative Land Type report
a Foliage Projective Cover report
a Rainfall and Pasture Growth Outlook report
a Regional Climate Projections report.
a Drought Assessment report.
FORAGE information currently only available for the Burdekin region includes:
an Erodible Soils report
https://www.longpaddock.qld.gov.au/forage/
Grazing BMP
Grazing BMP uses a voluntary online self-assessment tool to develop and implement a best management practice program for the grazing industry, enabling:
producers to identify and access training to improve knowledge and skills which will enable adoption of best practice
producers and industry to accurately monitor and report upon improvements in management practice at a range of levels
producers to benchmark their own practices against industry accepted best practice, and design and implement actions to improve.
The Grazing BMP program is modelled on the highly successful Grains BMP program, with an industry reference group providing feedback and guiding the project. The program was initially trialled in the Fitzroy Basin and is now being rolled out across other regions of Queensland. Grazing BMP consists of five modules covering all aspects of the enterprise:
1. Soil health
2. Grazing land management 3. Animal production
4. Animal health and welfare 5. People and business.
Best management practices for maintaining and improving land condition on grazing lands, Department of Agriculture and Fisheries, 2017
Stocktake Plus
Stocktake Plus is a pasture management App that has been designed for graziers. It:
Assists in monitoring grazing land condition by logically guiding the user through the process.
Stores monitoring information and produces reports, including long-term carrying capacity calculations, based on user input
Guides the user through a basic or detailed forage budget
Stores rainfall records
Stores stock numbers (converts to Adult Equivalents, displays current stock on Land Condition reports, and can import figures to demand section of a forage budget)
Directs users to their monitoring sites using GPS functions
Helps the user identify their land type(s), using the land type mapping of Queensland.
Backups all information securely on the internet, only accessible by the user.
The app is more than a digital log; it has many in-built support tools including:
land type factsheets
pasture growth tables
ground cover photo standards
accessible yield calculation sheets
pasture photo standards
dendrometer for measuring tree densities
Everything you need to do your monitoring in the paddock is now within your smartphone or tablet – there’s no more need to carry around your pasture photo standards, your GPS, or camera to complete your assessment.
Stocktake Plus is the first production decision support app for FutureBeef and Meat & Livestock Australia (MLA), developed using funding from MLA and the Department of Agriculture, Fisheries and Forestry, Queensland.
To download a copy of the Stocktake Plus, visit: www.stocktakeplus.com.au
Veg Machine
VegMachine is an online tool that uses satellite imagery to summarise decades of change in Australia’s grazing lands. It’s simple to operate, easy to understand, and free to use.
With VegMachine you can:
generate comprehensive ground cover monitoring reports
measure land cover change or estimate soil erosion rates
view satellite imagery land cover products
better understand the links between management, climate and cover in grazing land
Visit the website here: http://vegmachine.net/