A Holistic Theoretical Sustainability Assessment Model for Electricity
Generating Sources
Ndala Yves Mulongo and Clinton Aigbavboa
Faculty of Engineering and the Built Environment
University of Johannesburg, South Africa
Abstract
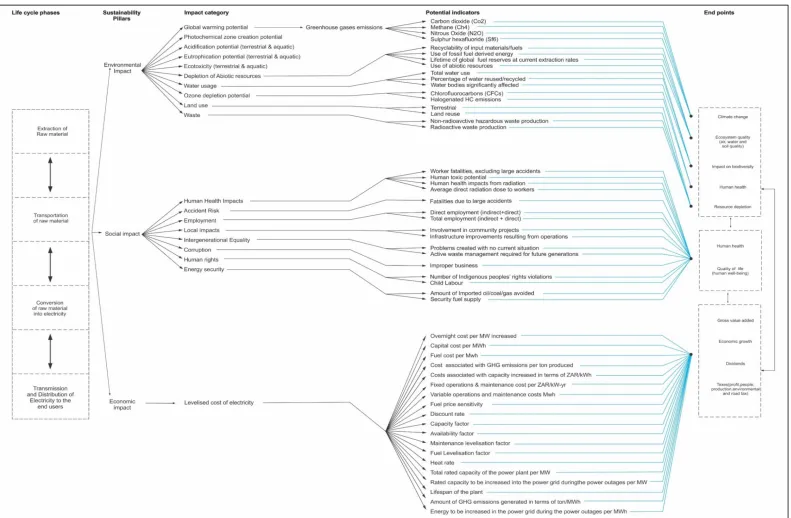
In response to ever-increasing concerns regarding ecological degradation and societal impact, numerous stakeholders such as non-governmental organisations, government officials, end-users, the mass media, and community activists have compelled business organizations, particularly multi-national companies to lessen harmful greenhouse gases emissions associated with their production activities. Energy sector is one of the biggest harmful greenhouse gases emission producer, hence, decision-makers within the energy sector are forced to promote and build environmental friendly and sustainable power generation plants. To this end, the concept of sustainability in the electricity sector has attracted so much attention from academics and industrial practitioners over the last three decades. Albeit, an important number of sustainability assessment frameworks for electricity generating technologies are found in the current literatures, three major drawbacks have emerged from those frameworks. Firstly, there is a lack of a holistic and comprehensive sustainability assessment framework for different power generation plants. Secondly, from economic aspect, the most used model (Levelised Cost of Electricity) to measure the cost performance of various electricity generating technologies is biased and is not inclusive enough, because, it only considers the capital, Operations and Maintenance, and fuel costs. Hence, snubbing crucial elements to business decision. Lastly, in the current literature, there is no a single sustainability assessment model that considers all the phases of electrical energy’s lifecycle. Considering these flaws, the novelty of this study is the development of a new, holistic theoretical sustainability assessment framework for power generation plants. The developed theoretical model includes 19 impact categories, 52 potential indictors, and 10 end points environmental, economic, and social aspects.
1.
Introduction
Energy in the form of electricity production plays a critical role in the development of a country alongside with other manufacturing firms. A sustainable plan of electrical energy generation could enhance economy, human being’s lifestyle and social wellbeing of a nation (Maxim, 2014). Over the past three decades, there has been a growing concern regarding ecological degradation and societal impact, numerous stakeholders such as non-governmental organisations, government officials, end-users, the mass media, and community activists have led to the development of the sustainable development concept that is designed with the aim of meeting the needs of the present generation without compromising the ability of future generations to meet their own needs. Thus, various business organizations, particularly multi-national companies have been compelled to lessen harmful greenhouse gases emissions associated with their production activities. Energy sector is one of the biggest harmful greenhouse gases producer, hence, decision-makers within the energy sector are also compelled to promote and build environmental friendly and sustainable power generation plants. However, complying with such requirement generally involves the measurement of financial, ecological and social performance of power generation plants. Albeit, an important amount of sustainability frameworks for electricity supply systems have been developed in the current literatures over the past decade, there is a lack of a comprehensive and integrated sustainability assessment framework for power generation plants. Study under sustainable electrical energy production diverges with regard to sundry aspects such as deepness of analysis, technological level, time-based and environmental distribution, and means employed in assessing and integrating various sustainability pillars (Santoyo-Castelazo and Azapagic, 2014). Appendixes A, B1 and B2 review a set of of 183 studies that have conducted in the field of sustainability energy development within different countries across the globe. The reviewed studies were published over 1997–2017, indicating the accrued knowledge of the past two decades.
1.1 Background
Regardless of being panned for definitional elusiveness and haziness (Lele, 1991), the notion of sustainability has become a crucial subject within the business environment. Nevertheless, the long argument around the definition of sustainability, in the researcher environment there is an increasing agreement that present study attempts ought to change towards emerging tangible means for encouraging and quantifying sustainable accomplishments (Veleva and Ellenbecker, 2001). Within the electricity sector this concern is even more serious and vital because of the massive and sundry impact the sector has got over other industries, community, and environment, generating
financial and societal benefits. However, meanwhile causing important issues and harmful externalities, such as pollution of the atmosphere and consequently contributing to global warming phenomenon. In accordance with Orsato and Wells (2007) the construction of sustainable electricity generating sources ought to cover a comprehensive model involving an equilibrium among societal, technical, ecological and financial features regarding the end-product or service development process. Despite the fact that the need for promoting and measuring sustainability practices within the electricity sector has attracted so much attention from academic and industrial practitioners over the last three decades, the current models, blueprint and frameworks, developed by both researcher within academic environment and industrial practitioners, actually, the existing frameworks within the current body of knowledge seek to study ecological, financial and societal features alongside the end-product life cycle in segregation from each other (Jasinski et al., 2016 ). Hence, in order to address the existing flaws in the current literature on sustainability appraisal in electricity sector, a critical literature review was conducted with the purpose of reviewing and classifying the existing body of knowledge resulting partly the methodical literature survey process regularly used within the management and organization researches (Tranfield et al., 2003). Precisely, a research procedure was exploited including a clear definition and detailed aims of the literature analysis, screening phase, and appraisal on the basis of segregation and insertion standards, tailed by an analysis of the recognised features of the gathered contents. The overall goal of conducting this critical appraisal of current literature was to find out to what extent sustainability analysis for different electricity generating technologies has been developed from a holistic perspective, and in which context does electricity sector regard sustainability.
2.
Theoretical framework
To commence with the critical appraisal of existing literature review on sustainability assessment of power generation plants, the ISI Web of Science database was used with ‘’sustainability in electricity sector’’ used as keywords. The time frame was from 1997-2017. The search only focused on peer-reviewed articles published in English, falling under certain subject areas. The search resulted in 389 documents that were thoroughly scrutinised by means of a of titles and abstracts with the purpose of developing additional boundaries and eliminating incorrect and/or unrelated entries (screening phase). Throughout this phase, groups of inclusion and segregation standards were established, versus which individually every singly journal article was evaluated. Precisely, articles assessed are those, which clearly considers sustainability analysis frameworks developed for power generation plants, and those that used sustainability appraisal to processes or materials related to other industries than power sector considering either single, two or all three sustainability pillars (environmental, social, economic) whilst assessing sustainability. It should be pointed out that studies that did not meet these norms were not taken into account. This stage generated 183 studies focusing on power generation plants and 20 studies focusing on other industries that electricity sector, were judged to be important for additional thorough scrutiny. Afterward, in order to respond to the main goal of this study, which is of developing a new, integrated sustainability assessment framework for power generation plants, the 183 studies were labelled on the basis of a set of standards, involving the general type of sustainability analysis used, the lifecycle phases (i.e, extraction of raw material, transportation of raw material, conversion of raw material into electricity, transmission and distribution of electricity to end-users); sustainability pillars taken into account (i.e. environmental, economic, and social aspects), the type of indicators used to assess the economic, environmental, and social impacts of different power generation plants. As it is demonstrated in the Appendixes A; B.1 and B.2. The outcomes of the critical appraisal of literature review generated various conclusions, first and foremost in current decade there has been a significant growth regarding the number of articles published related to sustainability in the electricity industry. Renewable Sustainable Energy Reviews was most represented in the literature review, with 61 of the 183 journal articles, followed by Energy Policy with 52 articles, Journal of Cleaner Production ranks at the third position with 28 articles, Energy with 25 articles, Applied Energy 21, Sustainability 14, Energies 10, Technological Forecasting and Social Change 9, and Renewable Energy 7 articles. Whereas, the remaining of the appropriate journals were just about equally distributed with low frequency (1-6 articles). Furthermore, the results of literature survey revealed that 77% of studies performed in electricity sector focused separately either on economic, environmental, or social aspects of power plants, while 7% attempted to combined only two aspects, and only 16% of the works attempted to incorporate all the three sustainability pillars into one framework. Supporting the idea that the electricity sector would benefit from a holistic and comprehensive framework for sustainability assessment.
3.
Conceptual framework
3.1 Economic pillar
The outcomes of the literature analysis that from economic impact, Levelised Cost of Electricity (LCOE) is a metric that is largely employed by decision makers in energy sector to measure the cost performance of various electricity generating sources options. Unfortunately, the current LCOE model is naïve and is not inclusive enough since it is a mere summation of capital, Operations and Maintenance, and fuel costs. Hence, ignoring some elements that are crucial to business decision. An additional issue that was observed with the standard LCOE model is that it is only applicable to electricity production options, which use akin technologies with the same annual energy production (Megawatt-hours) as determined by capacity factor. To provide a fair cost assessment between various power production technologies and to address gaps containing in the current LCOE model, this study has developed a novel LCOE model that incorporates critical components to business decision such as, lifecycle greenhouse costs, Transmission and Distribution costs, and rated capacity replacement costs during power crisis. Thus, the below lines will thoroughly present the LCOE as well as the novel LCOE model developed in this study based on the flaws identified in the literature survey.
3.1.1 The Levelized Cost of Electricity (LCOE)
Despite capital cost is a critical element that influences the cost associated with producing electrical energy by means of a power plant. There exist also others. As we will address them later in this chapter, such as fuel costs that is a key factor for fossil fuel-based power production stations. And also, costs related to operating and maintaining a power plant is also crucial, mainly in those that employ technologies such as gas turbines that necessitate recurrent important repairs. In what way, then, does one organised concerning merging all these factors to calculate the cost of producing a unit of electrical energy through a recommended power plant? Here the response is by employing certain form of financial modelling. Considering this, LCOE is the economic modelling that is widely used by many decisions makers. This includes computing the overall cost invested in the construction and operation of the plant throughout its whole lifespan, divided for every single year of its operation. The yearly outlays are afterward discounted to adapt them into the present worth. All the yearly discounted figures are then totalled in order to offer a figure in current's currency for the overall costs related to the power plant. This number is divided by means of the projected overall production of the plant during its lifespan and the resulting figure is the LCOE from the plant, once more in the current's values.
The LCOE approach is an important tool for an economic assessment of various electricity generation technologies and it is the most consulted method in electricity sector when investment and planning decisions are to be made (Mulongo (2017) from Guzmán, et al 2015; Hisham, 2015; Parrado et al 2015). Furthermore, it represents the most transparent approach being used for power planning and policy development (IEA/NEA, 2010). The reason for this being the most used methodology is because it allows cost comparison of several forms of electricity generation, which differ from physical principles, fuel types, and their lifespan (Mulongo (2017) from Klein 2009; Murat & Mustafa, 2009; Fluri, 2009; Francesco, 2015). When calculating the LCOE of a power plant, all discounted direct plant costs over the lifespan of the plant are divided by the discounted sum of the electricity that it would produce over its lifespan (Mulongo (2017) from Gross et al 2007; Hisham 2015; Simon et al 2013; IEA/NEA 2010; DECC 2013). In the context of financial, LCOE may also be defined as the constant level of inflows important per year in order to recover all outflows over the lifespan of a power plant (Mulongo (2017) from Roth & Ambs, 2004; NREL, 2010). In the standard method, these outflows involve capital costs, Operation & Maintenance costs (O&M), and fuel costs. In the end, the calculation enables a cost comparison among various alternatives over a constant unit cost basis; in this study ZAR/MWh has been used. Practically, there are two methods that can be used to determine LCOE of a power plant, namely the simplified LCOE method (sLCOE) and the Financial Model Approach (FMA). These two approaches are different because the sLCOE method determines “the minimum price at which electricity should be marked for an electricity generation plant to break even (either have present worth of zero)” whereas the FMA “determines the needed inflows in order to achieve a certain internal rate of return” of a particular investor (Black and Veatch, 2011). This internal rate of return depends on industry-specific project discount rates, tax liability, financing expenses and incomes requirements. Therefore, FMA approach is largely used by integrated industries, which may have to make some internal investment decisions among various power generation technologies (Black & Veatch, 2011). On the other hand, sLCOE method is mainly used by policy makers because it allows a cost comparison for several power investment technologies without taking into account a specific requirement, which differ from one industry to another industry and thus a single discount rate for all projects is used (Gross et al, 2007, Klein 2009, Simon et al 2013, Black & Veatch, 2011). For these reasons and also because industry specific data are always hard for outsiders to obtain, the sLCOE approach was adopted for this study.
A. Standard LCOE model
Capital cost,
Operation and Maintenance (O&M) cost, and Fuel cost
In the following lines, these three cost factors will be separately explored and then mixed into a standard LCOE formula.
Financing capital cost
The cost of constructing a power plant should typically be achieved at the kick-off of the project, or at least once it is terminated. In many instances, nowadays this would include rising a finance loan to be reimbursed through the purchase of the electrical energy the plant generates (Gross et al 2007; Hisham 2015; Simon et al 2013; IEA/NEA 2010). The timespan during which the loan is paid back relies upon its magnitude and on the kinds of electricity plant under construction. Generally, it is expected to be less than 2 decades. This is insignificant than the anticipated lifespan of the majority of contemporary electricity plants. Coal and gas power plants are likely to have a lifespan of about 3 decades, despite in certain circumstances this might be prolonged with an important overhaul. While, nuclear technologies are now expected to run for nearly 4 decades, some perhaps lengthier. Huge hydro-power stations are expected to have lifespan beyond 5 decades on condition that the site is well selected. In case, the time-scale of loan does not concur with an accurate lifespan for a plant, the outcome is a reimbursement timetable, which may negatively impact on the financial side of the project by means of gathering the outlay of the electrical energy it produces (Gross et al 2007; Hisham 2015; Simon et al 2013; and IEA/NEA 2010). In case, for instance, a hydro-power plant has a lifespan of 5 decades could merely gather a building loan to be repaid over 2 decades, in this case the electrical energy produced by means of this plant throughout the timeframe of the lend refund would be much significant than it may be if the lend repayment period is estimated at 4 decades. This is particularly real of RES that are normally capital demanding since lend reimbursements regularly form the main component of the cost associated with generating electrical energy (Irene et al, 2017; Ishan and Pallav, 2017; Ivan et al, 2016). On the other hand, a lend for a low-priced gas power plant would be much simpler to reimburse, albeit operating outlay might be much larger. There seems to be no resources of evading this blow of finances under the circumstances that function in economic markets currently whereby stakeholders request short refund timeframe and important revenues. Given that it influences capital investment more harshly does irrationally hinder certain RES, nevertheless, there are certain indications that this is being established now at a governmental level (Irene et al, 2017; Ishan and Pallav, 2017; Ivan et al, 2016)
Furthermore, capital cost is an important key for calculating LCOE of a power plant, and it is generally based on the Plant costs (that are described as the costs set up to build a power plant). Generally, for such analysis, the idea of overnight costs is considered, which has been defined by Klein (2009); Simon et al (2013), EUSUSTEL (2007), and Murat & Mustafa (2009) as the costs that are incurred for the construction of a power plant immediately, and it does not take into account any assumptions upon interest expenses that happen during the construction period. Often, such data is designed on the basis of currency per unit of capacity, as all costs must be levelized over a unit of electricity produce, e.g. in ZAR/MWh. According to Daniel, et al (2013); EPRI (2012); Guzmán, et al (2015); and IEA/NEA (2010) plant costs should be divided by the amount of electricity produce within a year. This is given by the 8760, that is the number of hours in one year, which are multiplied by the total size of the plant and the capacity factor of the plant stating the percentage of the time the power plant actually produces electricity. For example, a power plant that has a rated capacity of 4 800 MW, when operating with an 85% capacity factor, generates 35 740 800 MWh per year. It is important to notice that no power plant can operate at capacity factor of 100%. Since regular maintenance should be done and over time some components will be replaced, and the maintenance process will require the plant to stop (Paul, 2010; Jason, 2011). So far, this illustration is for capital cost per unit of power produce during one year. As matter of fact, a power plant runs over decades. That is why a Capital Recovery Factor (CRF) must be taken into consideration. Leland & Anthony (2012) describe CRF as the equivalent annual amount that the asset, process, or system has to earn each year just to recover the initial investment at a specified discount rate over its expected life. The CRF thus converts a flow of annual payments over the lifespan of the plant into a present value. It depends on the discount rate applied to the project and plant operation time. Thus, the standard capital cost per unit of electricity produced is calculated according to the below equation:
𝐶𝐶𝐶𝐶/𝑀𝑀𝑀𝑀ℎ=� �(𝐶𝐶𝑂𝑂𝑅𝑅𝑐𝑐) ×� 𝑟𝑟
(1 +𝑟𝑟)𝑙𝑙𝑡𝑡 (1 +𝑟𝑟)𝑙𝑙𝑡𝑡−1�
Where:
𝐶𝐶𝐶𝐶 : Capital cost per MWh produced
𝐶𝐶𝑂𝑂 : Overnight cost per MW increased 𝑅𝑅𝑐𝑐 : Total rated capacity of the power plant
𝑙𝑙𝑓𝑓 : Load factor
𝑟𝑟 : Discount rate
𝑙𝑙𝑡𝑡 : Lifespan of the power plant
ℎ𝑎𝑎−𝑦𝑦𝑦𝑦𝑦𝑦 : Number of hours within a year
Operation and Maintenance (O&M) cost
O&M costs are the costs that are incurred for the operation of a power plant and generally are expressed in terms of fixed or variable. Fixed O&M costs are the costs that do not depend on the generated amount of electricity (Mulongo (2017) from Klein, 2009; IEA/NEA, 2010). Generally, they are set up for the things like loan payment, required maintenance, site security and staff (Klein, 2009). Fixed O&M costs are designed on the basis of currency per unit $/kW (for South Africa is ZAR/kW) (EPRI, 2012). Like the plant costs the fixed O&M costs are as well divided by annual electricity produce in order to determine how much of them take place during one year of production (EPRI, 2012). Whilst, Variable O&M costs depend on the generated amount of electricity, these costs are set up for the things like fuel costs, additional staffing, and additional maintenance (Mulongo (2017) from Klein, 2009; EUSUSTEL, 2007). Usually, they are presented as ZAR/MWh. The O&M cost of a power plant is calculated according to the equation below:
𝑂𝑂&𝑀𝑀𝐶𝐶/𝑀𝑀𝑀𝑀ℎ=� ��𝑅𝑅 (𝐹𝐹𝑂𝑂𝑂𝑂×𝑅𝑅𝑐𝑐)
𝑐𝑐×𝑙𝑙𝑓𝑓×ℎ𝑎𝑎−𝑦𝑦𝑦𝑦𝑦𝑦�+𝑉𝑉𝑂𝑂𝑂𝑂� (2)
Where:
𝑂𝑂&𝑀𝑀𝐶𝐶 : Operations and Maintenance costs per unit of electricity produced
𝐹𝐹𝑂𝑂𝑂𝑂 : Fixed operations and maintenance costs
𝑉𝑉𝑂𝑂𝑂𝑂 : Variable operations and maintenance costs
𝑅𝑅𝑐𝑐 : Total rated capacity of the power plant 𝑙𝑙𝑓𝑓 : Load factor
ℎ𝑎𝑎−𝑦𝑦𝑦𝑦𝑦𝑦 : Numer of hours within a year
Fuel cost
Fuel cost is the cost of fuel, most often designed on the basis of currency per megawatt-hour. For a thermal power plant, it is the heat rate (Btu/kWh) multiplied by the cost of the fuel (ZAR/MMBtu). This involves upfront fuel costs, and also the on-line operating fuel usage (Mulongo (2017) from Klein, 2009). Allowance is made in the calculation for the degradation of a power plant’s heat rate over time. Fuel costs are not considered for renewable energy (Fluri, 2009). The fuel cost per unit of electricity produced is calculated according to the equation below:
𝐹𝐹𝑐𝑐/𝑀𝑀𝑀𝑀ℎ=��𝑓𝑓𝑝𝑝×𝐻𝐻𝑦𝑦𝑡𝑡� (3)
Where:
𝐹𝐹𝑐𝑐 : Fuel cost per unit of electricity produced
𝑓𝑓𝑝𝑝 : Fuel price
When we include all these components, we can therefore calculate the LCOE per unit of electricity generated according to the equation below:
𝐿𝐿𝐶𝐶𝑂𝑂𝐿𝐿/𝑀𝑀𝑀𝑀ℎ=� �(𝐶𝐶𝑂𝑂𝑅𝑅𝑐𝑐) ×� 𝑟𝑟
(1 +𝑟𝑟)𝑙𝑙𝑡𝑡 (1 +𝑟𝑟)𝑙𝑙𝑡𝑡−1�
�𝑅𝑅𝑐𝑐×𝑙𝑙𝑓𝑓×ℎ𝑎𝑎−𝑦𝑦𝑦𝑦𝑦𝑦� �+� �
(𝐹𝐹𝑂𝑂𝑂𝑂×𝑅𝑅𝑑𝑑)
�𝑅𝑅𝑐𝑐×𝑙𝑙𝑓𝑓×ℎ𝑎𝑎−𝑦𝑦𝑦𝑦𝑦𝑦�+𝑉𝑉𝑂𝑂𝑂𝑂�
+��𝑓𝑓𝑝𝑝×𝐻𝐻𝑦𝑦𝑡𝑡� (3)
This standard LCOE formula has been used by various studies such as, Black & Veatch (2011), Branker, et al (2011), Carlo (2014), Daniel, et al (2013), EPRI. (2012), Guzmán, et al (2015), Hisham (2015), IEA/NEA (2010), Khatib (2014), Lazard (2015), Parrado, et al (2015), Simon et al (2013), WEC (2013), Jason (2011), Murat & Mustafa (2009), Fluri, (2009), Francesco, (2015), Zhao, et al (2015), Umberto & Pietro (2014). Klein (2009), EUSUSTEL (2007), and DECC (2013). However, the issue with this standard LCOE model is that is simply based on the summation of capital, O&M, and fuel costs associated with the power plants, thus, ignoring some elements that are becoming more and more crucial when it comes to make business decision. Therefore, in this study, we have modified the standard LCOE formula by developing a novel LCOE model that considers the omitted factors (costs associated with GHG emissions, and costs associated with the rated capacity and energy to be increased in the power grid throughout the power outages).
B. Novel LCOE model
To provide a fair cost assessment between various power production technologies and to address gaps containing in the current LCOE model, this study has developed a novel LCOE model that incorporates critical components to business decision such as, lifecycle greenhouse costs, Transmission and Distribution costs, and rated capacity replacement costs during power crisis. Thus, the below lines will thoroughly present the LCOE as well as the novel LCOE model developed in this study based on the flaws identified in the literature survey.
𝐿𝐿𝐶𝐶𝑂𝑂𝐿𝐿/𝑀𝑀𝑀𝑀ℎ=�� �(𝐶𝐶𝑂𝑂𝑅𝑅𝑐𝑐) ×� 𝑟𝑟
(1 +𝑟𝑟)𝑙𝑙𝑡𝑡 (1 +𝑟𝑟)𝑙𝑙𝑡𝑡−1�
�𝐶𝐶𝐴𝐴𝑒𝑒𝑓𝑓𝑓𝑓×𝐻𝐻𝐴𝐴𝑒𝑒𝑓𝑓𝑓𝑓� �+� �
(𝐹𝐹𝑂𝑂𝑂𝑂×𝑅𝑅𝑑𝑑)
�𝐶𝐶𝐴𝐴𝑒𝑒𝑓𝑓𝑓𝑓×𝐻𝐻𝐴𝐴𝑒𝑒𝑓𝑓𝑓𝑓�+𝛾𝛾×𝑉𝑉𝑂𝑂𝑂𝑂�+� 𝛿𝛿×�
𝑓𝑓𝑝𝑝×𝐻𝐻𝑦𝑦𝑡𝑡
𝛽𝛽𝑒𝑒𝑓𝑓𝑓𝑓 ��
+� 𝐶𝐶𝑖𝑖×𝑀𝑀𝑝𝑝𝑖𝑖+�(𝑅𝑅𝑅𝑅𝐶𝐶�𝐶𝐶𝐴𝐴𝑒𝑒𝑓𝑓𝑓𝑓×∆𝑅𝑅) + (×𝐻𝐻𝐴𝐴𝑒𝑒𝑓𝑓𝑓𝑓�𝐿𝐿𝑅𝑅𝐶𝐶×∆𝐿𝐿) (4)
𝑖𝑖
Where:
𝐶𝐶𝐴𝐴𝑒𝑒𝑓𝑓𝑓𝑓 : Annual effective plant output
𝐻𝐻𝐴𝐴𝑒𝑒𝑓𝑓𝑓𝑓 : Annual effective plant operating hours
𝛾𝛾 : Maintenance levelisation factor 𝛿𝛿 : Fuel levelisation factor
𝛽𝛽𝑒𝑒𝑓𝑓𝑓𝑓 : Effective rated efficiency
𝐶𝐶𝐶𝐶 : Capital cost per MWh produced
𝐶𝐶𝑂𝑂 : Overnight cost per MW increased 𝑅𝑅𝑑𝑑 : Total rated capacity of the power plant
𝑟𝑟 : Discount rate
𝑙𝑙𝑡𝑡 : Lifespan of the power plant
𝑓𝑓𝑝𝑝 : Fuel price
𝐻𝐻𝑦𝑦𝑡𝑡 : Heat rate of the plant
𝑂𝑂&𝑀𝑀𝐶𝐶 : Operations and Maintenance costs per unit of electricity produced
𝑉𝑉𝑂𝑂𝑂𝑂 : Variable operations and maintenance costs
𝐶𝐶𝑖𝑖 : Cost associated with GHG emissions per ton
𝑀𝑀𝑝𝑝𝑖𝑖 : Amount of GHG emissions generatedin in terms of ton/MWh
𝑅𝑅𝑅𝑅𝐶𝐶 : Costs associated with capacity increased in terms of ZAR/kW-yr
∆𝑅𝑅 : Rated capacity to be increased in te power grid during the power outages
𝐿𝐿𝑅𝑅𝐶𝐶 : Cost associated with energy increased in terms of ZAR/kWh
∆𝐿𝐿 : Energy to be increased in the power grid during the power outages
It should be noted that the rated capacity and energy replacement accounts for the change concerning effective overall GW production and output, which should be supplied in case there is a dearth in electrical energy (MWh or GWh) ought to be made up adding in the power grid an additional plant when a deficit in capacity (MW or GW) ought to be made up through a purchase of fixed capacity from neighbouring grid. Additionally, in this new LCOE model we have added levelisation factors associated with the O&M and fuel costs is because both factors are always subjected to a growth during the lifespan of the plant.
3.2 Environmental pillar
The electricity sector is the largest source of ecological smog. Therefore, it is crucial to take into account all the impacts associated with environmental regardless of the present focus on global warming, as trade-offs regularly apply. In order to guarantee as wide analysis of ecological effects as possible, the subsequent environmental indicators are considered in this study:
A. Global Warming Potential (GWP)
GWP is a driving-factor of the energy policy. Many governments across the world is aiming to considerably reduce CO2 in the environment by 2050. Santoyo-Castelazo et al (2014); Sharon and Stephanie (2015); and Tarun and Balachandra (2015) reported that in 2013 the output of worldwide’s electrical energy and amounted to more than 32 billion tons of CO2 equal to atmosphere, or 26% of the overall CO2 emissions through financial sector in 2010 (Oliveira et al, 2015; Onat and Bayar, 2010; Xiaoyu et al, 2011; Padey et al, 2012). This is a growth of nearly 55.4% since 1990 as argued by Sastre et al (2015); Schleisner (2000); Sean et al (2015); Sebastian et al (2011); Sharon and Stephanie (2015); and Sheng et al (2016). RES is generally viewed as an alternative for mitigating the current global warming issues. Nevertheless, not all renewable energy generating source is greenhouse gas-free. For example, among the studies presented in the appendixes A some of them argue that wind turbines and photovoltaic cells do not generate carbon dioxide during their operations, however during their construction, installation and recycling process some amount of CO2 emissions are emitted in the atmosphere. This goes the same with the dams of hydropower technology, which generate some of GHG emissions during their construction as well as operation mostly due to the degeneration of organic material in the dam. Most of this takes place within anoxic areas inside the dam, leading to the development of anaerobic methane during degeneration process. Nations such as South Africa and United States that heavily rely on fossil fuels to produce electricity have Higher level of GHG emissions related to the development of wind turbines and photovoltaic cells. Hence, a conventional power grid mix for that particular country must clearly be defined regarding the type of GHG emissions. For example, GHG emissions for a specific American power grid exceed 31%, and this greater when compare to the one of Europe. In addition, GHG emissions generated through photovoltaic cells are higher due to important fossil-fuel to produce electrical energy. Some studies conducted an assessment regarding the use of only renewable energy source to generate electrical energy to operate a plant manufacturing wind turbines or photovoltaic cells. Suat and iftcioglu (2013); Suwanit and Gheewala (2011); Talavera et al (2017); Tarun and Balachandra (2015); and Thu and John (2015) state that employing photovoltaic power to provide electrical energy for manufacturing photovoltaic modules lower the overall CO2 emissions of a thin film module by 83% to only 7.1 g CO2/kWh. Xiaolong et al (2014); Xiaoye et al (2013); Xuecheng et al (2017); Yaw et al (2014); Yemane et al (2017); and Yemane and Getachew (2017) pointed out that GWP can be calculated according to the following equation:
𝐺𝐺𝑀𝑀𝐶𝐶=� 𝐺𝐺𝑀𝑀𝐶𝐶𝑖𝑖𝑌𝑌𝑖𝑖�𝑘𝑘𝑘𝑘𝐶𝐶𝑂𝑂2−𝑒𝑒𝑒𝑒/𝑘𝑘𝑀𝑀ℎ�
𝑖𝑖
𝑖𝑖
Where:
𝐺𝐺𝑀𝑀𝐶𝐶 : overall GWP of a power production plant expressed in (kg CO2-eq/kWh)
𝐺𝐺𝑀𝑀𝐶𝐶𝑖𝑖 : factor regarding GHG emission expressed in (kg CO2-eq/kg)
𝑌𝑌𝑖𝑖 : emission related to GHG
i:overall amount of GHG
B. Photochemical Oxidant Creation Potential (POCP)
POCP of ethylene is associated with the potential of volatile organic compounds (VOCs) as well as NOx, CH4 and CO in producing photochemical or summer smog. Turconi et al (2014); Valentina et al (2015); Vargas et al (2015); Viebahn and Nitsch (2007); Vuk et al (2016); Wang and Sun (2012); and Warner and Heath (2012) argued that POCP can be calculated according to the following equation:
𝐶𝐶𝑂𝑂𝐶𝐶𝐶𝐶=� 𝐶𝐶𝑂𝑂𝐶𝐶𝐶𝐶𝑖𝑖𝑌𝑌𝑖𝑖 (𝐶𝐶2𝐻𝐻4− 𝑒𝑒𝑒𝑒/𝑘𝑘𝑀𝑀ℎ) (6)
𝑖𝑖
𝑖𝑖
Where:
𝐶𝐶𝑂𝑂𝐶𝐶𝐶𝐶 : overall photochemical oxidant creation potential of a power plant (kg ethylene-eq/kWh)
𝐶𝐶𝑂𝑂𝐶𝐶𝐶𝐶𝑖𝑖 : Ability of genus (kg C2H4-eq/kg)
𝑌𝑌𝑖𝑖 : emission of particles causative to the development of summer smog (kg/kWh)
i: overall amount of particles participating to the development of summer smog
C. Acidification Potential (AP)
AP is among one of the biggest reason of growing death of marine creatures in seas and rivers, and also attrition of constructions because of emissions of acid gases such as SO2, NOx, HCl and NH3. In South Africa, the electricity sector is considered as one of the major producers of these gases since at least 95 % of electricity is generated from conventional electricity generating sources such as coal, nuclear, and gas. To this end, Carla et al (2017); Carlo et al (2016); Carlo et al (2015); Carlos et al (2016); Carrera and Mack (2012); Chao et al (2014); and Changqing et al (2016) stated that AP is calculated in accordance with the formula below:
𝐴𝐴𝐶𝐶=� 𝐴𝐴𝐶𝐶𝑖𝑖𝑌𝑌𝑖𝑖�𝑘𝑘𝑘𝑘𝑆𝑆𝑂𝑂2−𝑒𝑒𝑒𝑒/𝑘𝑘𝑀𝑀ℎ�
𝑖𝑖
𝑖𝑖
(7)
Where:
𝐴𝐴𝐶𝐶: total acidification potential of power generation plant (kg SO2-eq/kWh) 𝐴𝐴𝐶𝐶𝑖𝑖: acidification potential related to acid gas (kg SO2-eq/kg)
𝑌𝑌𝑖𝑖 : emission associated with acid gas (kg/kWh)
i: overall amount associated with acid gases
D. Eutrophication Potential
𝐿𝐿𝐶𝐶=� 𝐿𝐿𝐶𝐶𝑖𝑖𝑌𝑌𝑖𝑖�𝑘𝑘𝑘𝑘𝐶𝐶𝑂𝑂4−𝑒𝑒𝑒𝑒3− /𝑘𝑘𝑀𝑀ℎ� (8) 𝑖𝑖
𝑖𝑖
Where:
𝐿𝐿𝐶𝐶 : total eutrophication potential related to power generation plant (𝑘𝑘𝑘𝑘𝐶𝐶𝑂𝑂4−𝑒𝑒𝑒𝑒3− /𝑘𝑘𝑀𝑀ℎ)
𝐿𝐿𝐶𝐶𝑖𝑖 : eutrophication potential associated with particles (𝑘𝑘𝑘𝑘𝐶𝐶𝑂𝑂4−𝑒𝑒𝑒𝑒3− /𝑘𝑘𝑘𝑘)
𝑌𝑌𝑖𝑖 : emission associated with nutrient (kg/kWh)
i: overall amount associated with nutrients
E. Water use
In accordance with Turnpenny & Coughlan (2003) power sector uses more that 50% of the overall water consumption within the industrialised and developing countries. When a country has a dry climate, water reserve is an important means for that specific country, therefore, it should be wisely used. Most of forms of electricity producing sources need important amount of water for cooling. Literature regarding water usage and overall withdrawal throughout electrical energy production are illustrated in Tamim et al (2009); Herbert (2004) Evans et al (2009); Heidi et al (2017); Hong et al (2013); Irene et al (2017); and Juan et al (2015). The utilisation of water viewed as the evaporation or vanished from the system, which is impossible to be recovered. Furthermore, withdrawal is considered as the overall amount needed for the operation of a technology and including water accessible for recycling process. With nearly 1 g of water consumed/kWh, the consumption of water by wind is insignificant. Solar PV also consume insignificant litter of water estimated at 10 g/kWh. Because of these very insignificant figures, wind and photovoltaics are considered to be more environmental friendly and sustainable regarding the usage of water. The conclusions made based on the findings by Herbert (2004) about geothermal are very different from the results obtained by Tamim et al. (2009), who found that the usage of water turning around 1.7 kg/kWh. Water use concerning geothermal fluctuates largely, depending upon the effectiveness of water capture and recycling processes including the heat of the geothermal means. It is, therefore, possible to build a closed system with geothermal electricity production plant, which can meet the lowest limits demonstrated. In contrast, coal and gas illustrate an equal water withdrawal estimated at 78 kg water/kWh, since, both technologies consume huge amount of water for cooling process. Herbert (2004) reported that water usage for coal and gas is approximately 1.6 kg/kWh that reflect the findings published by the Australian Bureau of Statistics findings of Dennis (2006), which were evaluated at 1.5 kg/kWh for coal electricity generating source. However, it much lower than the conclusions of Tamim et al (2009), who estimated at 14–28 kg/kWh. In addition, Dennis (2006) estimated the value for gas technology at 0.6 kg/kWh that significantly much lower than coal. It should be noted that the consumption of water by Biomass is larger than coal and gas, due to the fact that the combustion process of biomass uses the same quantity of water, however, there is also the added water load of crop increase (if applicable), collecting and transportation of a low energy dense fuel and drying of a high moisture fuel. Additionally, it was estimated by Herbert (2004) that constant energy crops have a water conditions that is more 10 times greater than waste residue biomass. He also reports that the usage of water of about 1.8 kg/kWh is needed to generate electricity through biomass, which is once more less compared to the outcomes presented by Tamim et al. (2009) that ranges between 31–75 kg/kWh. Nuclear electricity generation source has a significant requirement regarding water cooling process within the reactors. Of all the power generating sources, hydropower has the highest water consumption, as it needs an important water volume to be stored. In this case, storage ends in water diminution within the dam through evaporation, the scale of which is impacted by the overall dam surface area and volume, local heat, and geography.
𝐹𝐹𝑀𝑀𝐿𝐿𝐹𝐹𝐶𝐶=� 𝐹𝐹𝑀𝑀𝐿𝐿𝐹𝐹𝐶𝐶𝑖𝑖𝑌𝑌𝑖𝑖 (𝑘𝑘𝑘𝑘 1,4− 𝑅𝑅𝐷𝐷𝐶𝐶 − 𝑒𝑒𝑒𝑒/𝑘𝑘𝑀𝑀ℎ) (9) 𝑖𝑖
𝑖𝑖
𝑀𝑀𝐿𝐿𝐹𝐹𝐶𝐶=� 𝑀𝑀𝐿𝐿𝐹𝐹𝐶𝐶𝑖𝑖𝑌𝑌𝑖𝑖 (𝑘𝑘𝑘𝑘 1,4− 𝑅𝑅𝐶𝐶𝐷𝐷 − 𝑒𝑒𝑒𝑒/𝑘𝑘𝑀𝑀ℎ) (10)
𝑖𝑖
𝑖𝑖
Where:
𝐹𝐹𝑀𝑀𝐿𝐿𝐹𝐹𝐶𝐶: overall freshwater eco-toxicity potential of power production plant (𝑘𝑘𝑘𝑘 1,4− 𝑅𝑅𝐷𝐷𝐶𝐶 −
𝑒𝑒𝑒𝑒/𝑘𝑘𝑀𝑀ℎ)
𝐹𝐹𝑀𝑀𝐿𝐿𝐹𝐹𝐶𝐶𝑖𝑖 : freshwater eco-toxicity potential of particle (𝑘𝑘𝑘𝑘 1,4− 𝑅𝑅𝐷𝐷𝐶𝐶 − 𝑒𝑒𝑒𝑒/𝑘𝑘𝑘𝑘)
𝑀𝑀𝐿𝐿𝐹𝐹𝐶𝐶: overall marine eco-toxicity potential related to power production plant (𝑘𝑘𝑘𝑘 1,4− 𝑅𝑅𝐷𝐷𝐶𝐶 −
𝑒𝑒𝑒𝑒/𝑘𝑘𝑀𝑀ℎ)
𝑀𝑀𝐿𝐿𝐹𝐹𝐶𝐶𝑖𝑖: marine eco-toxicity potential of particle (𝑘𝑘𝑘𝑘 1,4− 𝑅𝑅𝐷𝐷𝐶𝐶 − 𝑒𝑒𝑒𝑒/𝑘𝑘𝑘𝑘)
𝑌𝑌𝑖𝑖 : emission associated with particle to freshwater or seawater (kg/kWh)
i: overall amount of lethal particles
F. Land use
Land is a kerbed product, especially in nations with large population densities such as South Africa. The land needed for the construction of power plants is a significant matter for the assessment of power generation plants (Edgar and Arturo, 2013; Eduard et al, 2012; Eduard et al, 2015; Elvira et al, 2012;Begic' and Afgan, 2007 & Burcin and Adisa, 2016). The ecosystem and landsite are impacted directly by the land used to build power plant. Land use is also viewed as a social criterion to analyse the electricity generation plant. It is characterised as one of the most important aspects for the intervention site, particularly where the daily mankind activities are important issues of environmental strain (Grant et al, 2011; Gregory and Timothy, 2005; Guezuraga et al, 2012; Gujba et al, 2010; and Guofu et al, 2016).
The Quality of life of human beings is often influenced by power supply systems as it might have been deployed for the development of parks and recreation centres. The diggings, channels and other work essential for power plants operation threaten the vegetation, the nature and the ecology in general. Different forms of power generating resources need different land whilst the products are same. Mainly power generating stations with biomass and biofuels necessitate the huge amount of land. The size of terrain is an important component about the direct and indirect footprint zone needed. It determines the size of the soil needed for building or implementing a power generation technology. Three sustainability are involved under this category: land use, greenfield land use and terrestrial eco-toxicity. Land use is a measure of the overall land used during the entire life cycle and the period for which it is not available for other usage. Laurence and Adisa (2011) and Laurence and Adisa (2014) argued that these indicators are calculated according to the equations below:
Impact of land use (ILU) is calculated
𝐼𝐼𝐿𝐿𝐼𝐼=𝛽𝛽×𝑙𝑙 (𝑚𝑚2𝑦𝑦𝑟𝑟/𝑘𝑘𝑀𝑀ℎ) (11)
Greenfield land use (GLU)
GLU is referred to the ratio of the size of greenfield land that is used to build an electricity generation plant, associated with the absolute volume of zone that is planned to be used by the plant. It is computed in accordance with the formula below:
𝐺𝐺𝐹𝐹𝐼𝐼=𝐺𝐺𝐹𝐹𝐴𝐴𝐹𝐹𝐿𝐿𝐴𝐴 (100%) (12)
Terrestrial eco-toxicity potential (TETP)
𝐹𝐹𝐿𝐿𝐹𝐹𝐶𝐶=� 𝐹𝐹𝐿𝐿𝐹𝐹𝐶𝐶𝑖𝑖𝑌𝑌𝑖𝑖 (𝑘𝑘𝑘𝑘 1,4− 𝑅𝑅𝐶𝐶𝐷𝐷 − 𝑒𝑒𝑒𝑒/𝑘𝑘𝑀𝑀ℎ) (13) 𝑖𝑖
𝑖𝑖
Where:
ILU: overall effect of power plant on land occupied over time (m2 .yrs/kWh) 𝛽𝛽 : the size of land used (m2 )
𝑙𝑙 : lifespan during which land is in used (years)
GFU: ratio of greenfield land deployed to build an electricity generation plant (%) GFA : the size of greenfield land occupied (m2)
TLA : overall size of land consumed by an electricity generation plant (m2)
TETP: overall terrestrial eco-toxicity potential of power plant (𝑘𝑘𝑘𝑘 1,4− 𝑅𝑅𝐶𝐶𝐷𝐷 − 𝑒𝑒𝑒𝑒/𝑘𝑘𝑀𝑀ℎ)
𝐹𝐹𝐿𝐿𝐹𝐹𝐶𝐶𝑖𝑖: terrestrial eco-toxicity potential associated with harmful particle (𝑘𝑘𝑘𝑘 1,4− 𝑅𝑅𝐶𝐶𝐷𝐷 − 𝑒𝑒𝑒𝑒/𝑘𝑘𝑘𝑘)
𝑌𝑌𝑖𝑖 : emission of particle toward land (kg/kWh)
i: overall amount of harmful particle discharged into the land
Lastly, it has been noticed that there is no a single sustainability assessment framework for different electricity generating technologies in the current literature that considers the entire lifecycle stages such as Extraction of RAW Material, Transportation of Raw Material, Conversion of Raw into Electricity, and Transmission and Distribution of Electricity to end-users.
3.3 Social pillar
The tradition of social aspect research has always been steered by the concerns of how to evaluate ‘‘quality of lifestyle’’ and how the elements impacting on quality of lifestyle would be sufficiently evaluated. In accordance with Bauer (1966), social metrics are described as ‘‘data, numerical series and all other forms of evidence allowing us to evaluate where we are and are going regarding our ethics and objectives (Bauer, 1966). Additionally, accentuating on the empirical aspects of metrics, Parris and Kates (2003) describe them as ‘‘quantitative indicators chosen to evaluate development toward or away from a determined objective’’. Garrelts and Flitner (2007) emphasize on the date function of social criteria. They claim that these metrics must be chosen to convey a wider issue with only few figures, therefore evading data excess. Though initially social criterias were developed to evaluate society’ economic growth, the GNP as the major instance, social metrics are currently being approved in a comprehensive sense and are also used to appraise the technical effects, including the political stratagems. Evans et al (2009); Heidi et al (2017); and Hong et al (2013) pointed out that social aspect as being simply expressive because various studies only gather information without a fundamental theoretic concept, which preferably should lead in choosing criterion and indicators. This issue is prevalent because social metrics should not be stemmed from an overarching societal theory. A broadly acknowledged model for measuring social performance does not exist. There are various models that can be employed for social criteria, such as the quality of lifestyle, lifestyle schemas or cultural and value-related concepts. However, no fundamental theory exists allowing us to define social aspect from a comprehensible theory of what matters in society.
A. Job creation.
production of fuel as well as waste management. Because, the jobs created by means of a power station differs significantly depending on life cycle phase, it is important to address this sustainability indicator in terms of person-yrs (per overall electrical energy produced) instead of total amount of employments (per overall electrical energy produced) (Sharon and Stephanie, 2015; Stamford and Azapagic, 2012; Tarun and Balachandra, 2015; Widodo and Nok, 2016). For example, in case 2 000 persons are hired for a period of 8 years throughout the construction of a power plant, and 1 000 individuals are hired throughout the operations stage of the plant over 40 years. This gives the overall jobs created per individual-yrs is 56 000 divided by the overall electrical energy generated during the entire lifetime of the power plant. Alternatively, it might be easily to aggregate the amount of employment to 3 000 and divided by the amount of power produced, irrespective of the period of the contract, therefore offering merely biased employment data. To avoid this, we proposed to calculate both indicators according to the formulas below:
Direct job
𝑅𝑅𝐷𝐷=∑ 𝑅𝑅𝐷𝐷𝑖𝑖𝑡𝑡𝑖𝑖𝑖𝑖𝑖𝑖
𝐶𝐶𝑡𝑡𝑡𝑡𝑡𝑡 (𝑝𝑝𝑒𝑒𝑟𝑟𝑝𝑝𝑝𝑝𝑝𝑝 − 𝑦𝑦𝑟𝑟𝑝𝑝/𝑀𝑀𝑀𝑀ℎ) (14)
Indirect job
𝐼𝐼𝐷𝐷=∑ 𝐼𝐼𝐷𝐷𝑖𝑖𝐶𝐶𝑡𝑡𝑡𝑡𝑡𝑡𝑖𝑖𝑖𝑖 𝑡𝑡𝑖𝑖 (𝑝𝑝𝑒𝑒𝑟𝑟𝑝𝑝𝑝𝑝𝑝𝑝 − 𝑦𝑦𝑟𝑟𝑝𝑝/𝑀𝑀𝑀𝑀ℎ) (15)
Overall Job creation
𝑂𝑂𝐷𝐷=𝑅𝑅𝐷𝐷+𝐼𝐼𝐷𝐷 (𝑝𝑝𝑒𝑒𝑟𝑟𝑝𝑝𝑝𝑝𝑝𝑝 − 𝑦𝑦𝑟𝑟𝑝𝑝/𝑀𝑀𝑀𝑀ℎ) (16)
Where:
𝑅𝑅𝐷𝐷 : direct jobs creation during the life cycle of power plant (person-yrs/MWh)
𝑅𝑅𝐷𝐷𝑖𝑖 : direct jobs creation over the life cycle phase
i: number of individual hired
𝑡𝑡𝑖𝑖 : time associated with jobs during the life cycle phase (years)
𝐶𝐶𝑡𝑡𝑡𝑡𝑡𝑡 : overall electricity produced throughout the lifespan of power plant (GWh)
𝐼𝐼𝐷𝐷𝑖𝑖 : indirect jobs creation over the life cycle stage
𝐼𝐼𝐷𝐷 : indirect jobs creation during the life cycle of power plant (person-yrs/MWh)
B. Human Toxicity Potential (HTP)
Power production causes numerous kinds of HTP, varying from place of work accidents to the more extensive harms related to harmful emissions. Therefore, in order to measure HTP as efficiently as possible, we suggest the subsequent three indicators, relevant during the entire life cycle of a power plant:
Employee Death Toll (EDT), Human toxicity potential (HTP), and Heavy Accidents Risk (HAP)
C. Employee Death Toll (EDT)
𝐿𝐿𝑅𝑅𝐹𝐹=� 𝐿𝐿𝑅𝑅𝐹𝐹𝑖𝑖(𝑝𝑝𝑝𝑝/𝑀𝑀𝑀𝑀ℎ) (17) 𝑖𝑖
𝑖𝑖
Where:
𝐿𝐿𝑅𝑅𝐹𝐹 : overall number of crew mortalities
𝐿𝐿𝑅𝑅𝐹𝐹𝑖𝑖 : number of crew mortalities over the life cycle phase per MWh of electricity generated
D. Human toxicity potential (HTP)
We refer HTP to the likely detriment to people generated by lethal emissions produced over the life cycle of power plant. Akin to the ecological eco-toxicity addressed within the section on environmental indicators, it is calculated in accordance with the formula below:
𝐻𝐻𝐹𝐹𝐶𝐶=� 𝐻𝐻𝐶𝐶𝐴𝐴𝑎𝑎𝑖𝑖×𝐷𝐷𝑎𝑎𝑖𝑖+� 𝐻𝐻𝐶𝐶𝑀𝑀𝑤𝑤𝑖𝑖
𝑖𝑖
𝑖𝑖 𝑖𝑖
𝑖𝑖
×𝐷𝐷𝑊𝑊𝑖𝑖+� 𝐻𝐻𝐶𝐶𝑆𝑆𝑦𝑦𝑖𝑖×𝐷𝐷𝑦𝑦𝑖𝑖 (𝑘𝑘𝑘𝑘 1,4− 𝑅𝑅𝐶𝐶𝐷𝐷 − 𝑒𝑒𝑒𝑒/𝑘𝑘𝑀𝑀ℎ) (18)
𝑖𝑖
𝑖𝑖
Where:
𝐻𝐻𝐶𝐶𝐴𝐴𝑎𝑎𝑖𝑖 , 𝐻𝐻𝐶𝐶𝑀𝑀𝑤𝑤𝑖𝑖, 𝐻𝐻𝐶𝐶𝑆𝑆𝑦𝑦𝑖𝑖, : toxicity potentials concerning harmful particles discharged in the environment
(kg 1,4-DCB eq/kg).
𝐷𝐷𝑎𝑎𝑖𝑖, 𝐷𝐷𝑊𝑊𝑖𝑖,𝐷𝐷𝑦𝑦𝑖𝑖 : emissions from various harmful particles (kg/kWh).
i: overall amount of harmful particles to people
E. Heavy Accident Potential (HAP)
We refer HAP to the death rate caused by huge accidents throughout the life cycle of power plant and expressed per kWh of electrical energy produced. Heavy accidents in electricity sector are likely most linked to the community view regarding power production plants. For instance, the Chernobyl that is considered as the major disaster that occurred at the nuclear reactor in Ukraine in 1986. The environment was seriously polluted by the plumes of radionuclides, and this caused serious damages to human health and the environment. Furthermore, nuclear waste that is radioactive and hazardous to human health can last for many decades. This indicators is calculate according to the formula below:
𝐻𝐻𝐴𝐴𝐶𝐶=� 𝐻𝐻𝐴𝐴𝐶𝐶𝑖𝑖
𝑖𝑖
𝑖𝑖
(𝑝𝑝𝑝𝑝/𝑀𝑀𝑀𝑀ℎ) (19)
Where:
HAP: overall amount of mortalities (no./MWh)
𝐻𝐻𝐴𝐴𝐶𝐶𝑖𝑖 : amount of crew mortalities during the life cycle phase per unit of electrical energy generated
i: overall amount of life cycle phases
F. Impact on domestic community
This category is used to evaluate the impacts of an electricity generation plant on indigenous community. Some of the likely impacts involve jobs offer to indigenous inhabitants, and also involvement in their development and wellbeing. In light of this, the subsequent three indicators are developed out of this category that were proposed by various studies.
Percentage of expenditure on domestic suppliers determines the rate of outlay toward domestic community and is associated with the overall expense per annum
Direct investment in domestic community aims at promoting impartial delivery of means through direct returns to the local community [38]. This includes investments in local schools, sickbays, public services, ecological projects, etc. This social metric is addressed as proportion investment associated with the overall firm income.
Preferably, these social metrics should take into account the building, operation and mothballing phases, however it is dubious that data regarding all three phases are easily accessible at the same moment and information concerning the building and mothballing might not be accessible at all. In addition, various firms might be concerned with these three life cycle phases making it complex to get significant data. Thus, it is proposed that these metrics will merely consider the operation phase of an electricity production unit.
Percentage of crew employed from domestic community
𝐶𝐶𝐶𝐶𝐿𝐿𝑅𝑅𝐶𝐶=𝑅𝑅𝐶𝐶𝐿𝐿𝐶𝐶𝐿𝐿 × 100 (20)
Percentage of expenditure on domestic suppliers
𝐶𝐶𝐿𝐿𝑅𝑅𝑆𝑆=𝐴𝐴𝐿𝐿𝑅𝑅𝑆𝑆
𝐿𝐿𝑡𝑡𝑡𝑡𝑡𝑡 × 100 (21)
Direct investment in domestic community
𝑅𝑅𝐼𝐼𝑅𝑅𝐶𝐶=𝐼𝐼𝑅𝑅𝐶𝐶𝑅𝑅𝑡𝑡𝑡𝑡𝑡𝑡× 100 (22)
Where:
𝐶𝐶𝐶𝐶𝐿𝐿𝑅𝑅𝐶𝐶 : Percentage of crew employed from domestic community over the operation phase of the
electricity generation plant
𝐶𝐶𝐿𝐿 : number of crew employed from domestic community per MWh produced
𝑅𝑅𝐶𝐶𝐿𝐿 : overall amount of crew directly hired per GWh produced over the lifespan of the plant
PEDS : percentage of expenditure on domestic suppliers
𝐴𝐴𝐿𝐿𝑅𝑅𝑆𝑆: annual expense on domestic suppliers (£/yrs)
𝐿𝐿𝑡𝑡𝑡𝑡𝑡𝑡 : overall annual expenditure associated with the O&M of the plant (ZAR/yrs)
𝑅𝑅𝐼𝐼𝑅𝑅𝐶𝐶 : Direct investment in domestic community each year (%)
𝐼𝐼𝑅𝑅𝐶𝐶 : yearly investment in domestic community (ZAR/yrs)
𝑅𝑅𝑡𝑡𝑡𝑡𝑡𝑡 ∶ overall yearly income (ZAR/yrs)
G. Human rights violation and bribery
𝐶𝐶𝐶𝐶𝐼𝐼=�𝐶𝐶𝐶𝐶𝐼𝐼𝐶𝐶𝑐𝑐 𝑐𝑐
𝑐𝑐
(𝑝𝑝𝑠𝑠𝑝𝑝𝑟𝑟𝑒𝑒 0−10) (23)
Where:
𝐶𝐶𝐶𝐶𝐼𝐼: Corruption Perceptions Index (score 0-10)
𝐶𝐶𝐶𝐶𝐼𝐼𝑐𝑐 : regarding country within the life cycle of a power plant
𝐶𝐶 : overall amount of countries
Conclusion
In response to ever-increasing concerns regarding ecological degradation and societal impact, numerous stakeholders such as non-governmental organisations, government officials, end-users, the mass media, and community activists have compelled business organizations, particularly multi-national companies to lessen harmful greenhouse gases emissions associated with their production activities. Energy sector is one of the biggest harmful greenhouse gases emission producer, hence, decision-makers within the energy sector are forced to promote and build environmental friendly and sustainable power generation plants. To this end, the concept of sustainability in the electricity sector has attracted so much attention from academics and industrial practitioners over the last three decades. Albeit, an important number of sustainability assessment frameworks for electricity generating technologies are found in the current literatures, three major drawbacks have emerged from those frameworks. Firstly, there is a lack of a holistic and comprehensive sustainability assessment framework for different power generation plants. Secondly, from economic aspect, the most used model (Levelised Cost of Electricity) to measure the cost performance of various electricity generating technologies is biased and is not inclusive enough, because, it only considers the capital, Operations and Maintenance, and fuel costs. Hence, snubbing crucial elements to business decision. Lastly, in the current literature, there is no a single sustainability assessment model that considers all the phases of electrical energy’s lifecycle. These gaps were identified through a thorough review of significant studies on the three sustainability pillars: environmental, economic, and social aspects, as well as on the system boundaries considered while performing these assessments (Appendixes A, B1, and B2). The review of current literature included both the sustainability assessments applied to power supply systems and those applied to other systems than energy systems. At least a set of 183 studies conducted in the electricity sector. It should be noted that only the best works that have been published in the recognised international journals were reviewed for both studies associated with power sector and other than electricity sector. The result of critical review of the 183 previous studies demonstrated that 77% of studies performed in electricity sector focused separately either on economic, environmental, or social aspects of power plants, while 7% attempted to combined only two aspects, and only 16% of the works attempted to incorporate all the three sustainability pillars into one framework. Furthermore, the result of critical review of previous studies indicate significant gaps at the level of the system boundaries considered during the sustainability assessment.
Thus, to address the above flaws, the present study makes the following contributions to sustainability assessment of electricity supply system body of knowledge:
• First, by reviewing an extensive amount of studies concerning sustainability analysis in energy sector, the present study produces an improved understanding of how current literatures measure sustainability of power generation plants.
• This study has developed a novel comprehensive economic analysis model for measuring the economic performance of different power generation plants.
• The present study has developed a holistic and integrated sustainability assessment framework through a selection of a set of sustainability analysis measures from the literature and processing them by means of an-in-depth critical analysis of existing literatures. After that, a set of Considering these flaws, this study contributes to the current body of knowledge on sustainability in energy sector by developing a new, holistic sustainability assessment framework for power generation plants. The developed model includes 19 impact categories, 52 potential indictors, and 10 end points environmental, economic, and social aspects.
• The developed model can be employed as a decision-making means at the initial phases of the electricity producing plant development process.
Appendix A. Distribution of literature review papers based on one sustainability dimension
Scope of the study
System Boundaries Sustainability Pillars
Authors Journals ERM TRM CRE TDE LCA LCC SLCA Countries
Abbaspour et al (2011) Energy Sources × × Iran
Alvaro et al (2015) Journal of Cleaner Production × × Brazil
Anders and Hertwich (2012) Renewable and Sustainable Energy Reviews × × Not specified
Andrew et al (2011) Renewable Energy × × Thailand
Arvesen et al (2015) Applied Energy × × × Norway
Athanasios and Dimitrios (2014) Energy Policy × × Not specified
Ays et al (2017) Journal of Cleaner Production × × Not specified
Bohm et al (2007) International journal of greenhouse gas control × × Not specified
Bonou et al (2016) Applied Energy × × Europe
Bridget et al (2009) Environmental science technology × × New Zealand
Burcin and Adisa (2015) Journal of Cleaner Production × × × Turkey
Burcin and Adisa (2016) Renewable Energy × × Turkey
Cameron et al (2015) Renewable Energy × × × × Thailand
Carlos et al (2016) Applied Energy × × Not specified
Carrera and Mack (2012) Energy Policy × × European
Changqing et al (2016) Journal of Cleaner Production × × × × China
Chao et al (2014) Journal of Cleaner Production × × × China
Cristina et al (2016) Journal of Environmental Management × × Norway
Dalia and Ilona (2014) Renewable Energy × × Lithuania
De Feo et al (2016) Environmental Technology × × Not specified
Diego et al (2016) Journal of Cleaner Production × × Norway
Diego et al (2017) Renewable and Sustainable Energy Reviews × × Spain
Diego et al (2017) Applied Energy × × Not specified
Diogo et al (2014) Renewable and Sustainable Energy Reviews × × × Brazil
Edgar and Arturo (2013) Energy Procedia × × Mexico
Eduard et al (2012) Renewable Energy × × Not specified
Eduard et al (2015) Journal of Industrial Ecology × × Not specified
Elvira et al (2012) Energy × × × Sweden
Elvira et al (2015) Energy × × Italy
Ernesto et al (2016) Journal of Cleaner Production × × Cuba
Fatemeh et al (2017) International Journal of Green Energy × × × × Iran
Felix and Gheewala (2012) Energy for Sustainable Development × × Tanzania
Francisca et al (2016) Energy for Sustainable Development × × × Spain
Fthenakis and Kim (2007) Energy Policy × × Not specified
Gagnon et al (2002) Energy Policy × × × × Not specified
Garcia et al (2014) Applied Energy × × × Portugal
Garrett and Rønde (2013) International Journal of Life Cycle Assessment × × Not specified
Geoffrey and Aine (2017) Energy × × × United Kingdom
Giuliano (2014) Management of Environmental Quality × × Not specified
Grant et al (2011) Energy Policy × × Scotland
Guezuraga et al (2012) Renewable Energy × × Not specified
Guofu et al (2016) Applied Energy × × China
Hans and Anders (1999) Drying Technology × × × Not specified
Hatice et al (2016) Journal of Cleaner Production × × × × Turkey
Hondo (2005) Energy × × × Japan
Hrayshat (2009) Energy Sources × × Jordan
Ishan and Pallav (2017) Renewable and Sustainable Energy Reviews × × Not specified
Ivan et al (2016) Journal of Cleaner Production × × Brazil
Janie and Anthony (2017) Applied Energy × × Not specified
Jelena et al (2012) Management of Environmental Quality × × Latvia
Jin and Bin (2016) Applied Energy × × × × × Not specified
João et al (2015) Energy Policy × × Not specified
John et al (2011) Environmental Science Technology × × United States
Juliana et al (2016) IJournal of Energy and Environment × × × × Brazil
Jungbluth et al (2005) Journal of Life Cycle Assessment × × Not specified
Justin et al (2010) Electric Power Systems Research × × Portugal
Karin and Christian (2016) Renewable and Sustainable Energy Reviews × × × UAE
Karin et al (2014) Energy Policy × × × Europe
Kathrin et al (2013) Journal of Greenhouse Gas Control × × Europe
Kerstin and Sergio (2013) Renewable Energy × × Brazil
Khan et al (2005) Renewable Energy × × Not specified
Krishnaiah et al (2012) Energy Sources × × India
Kuldeep et al (2014) Environmental development × × × × Not specified
Lakhani et al (2014) Applied Energy × × United States
Lamnatou and Chemisana (2017) Renewable and Sustainable Energy Reviews × × Not specified
Le Quyen and Anthony (2016) Procedia CIRP × × Vietnam
Letitia and Calin-Cristian (2017) Journal of Cleaner Production × × × × Not specified
Letitia et al (2017) Journal of Cleaner Production × × × Not specified
Longlong et al (2014) Energy Procedia × × × Japan
Luis et al (2015) Energy for Sustainable Development × × Chile
Manfred (2008) Energy Conversion and Management × × Not specified
Marco and Enrica (2016) Energy Policy × × United Kingdom
Marios et al (2016) Solar Energy Materials & Solar Cells × × × Not specified
Martinez et al (2009) Renewable Energy × × Not specified
Maxim (2014) Energy Policy × × × Not specified
Meier et al (2005) Energy Policy × × United States
Messagie et al (2014) Applied Energy × × × Belgium
Michael et al (2013) Environmental science technology × × United States
Ming et al (2016) Renewable and sustainable energy reviews × × China
Mirko and Riccardo (2014) Journal of Cleaner Production × × Italy
Morrison and jay (2017) Journal of Cleaner Production × × × × United States
Murat and Mustafa (2009) Applied Energy × × Turkey
Murat and Omer (2011) Energy × × Not specified
Naser and Timothy (2008) Energy Policy × × Not specified
Nelson et al (2006) Renewable Energy × × Not specified
Ning et al (2017) Resources, Conservation and Recycling × × × × China
Nishimura et al (2010) Applied Energy × × Japan and China
Oliveira et al (2015) Energy Conversion and Management × × Belgium
Onat and Bayar (2010) Renewable Sustainable Energy Reviews. × × Not specified
Parrado et al (2015) Energy × × Chile
Paudel and Sarper (2013) Energy × × United States
Paul et al (2012) Energies × × Australia
Pehnt (2006) Renewable Energy × × Not specified
Pehnt et al (2008) Energy × × Germany
Peishi et al (2017) Energy Procedia × × Not specified
Peng et al (2013) Renewable and Sustainable Energy Reviews × × Not specified
Ravi and Bhat (2010) International Journal of Green Energy × × India
Ravina et al (2015) Journal of Cleaner Production × × Mauritius
Rita et al (2014) Applied Energy × × × Portugal
Rongrong et al (2016) Energy Conversion and Management × × Not specified
Samiha and Bryan (2017) Renewable and Sustainable Energy Reviews × × Not specified
Santoyo-Castelazo et al (2011) Energy × × Mexico
Santoyo-Castelazo et al (2014) Energy Conversion Management × × Mexico
Sara et al (2017) Renewable and Sustainable Energy Reviews × × Canada
Sastre et al (2015) Applied Energy × × × Spain
Sean et al (2015) Journal of Energy Storage × × Canada
Seyed et al (2015) J. Human and Ecological Risk Assessment × × Iran
Sheng et al (2016) Energy Conversion and Management × × China.
Slobodan et al (2016) Energy Sources × × × Serbia
Stacey and Garvin (2012) Journal Industrial Ecology × × Not specified
Stephanie et al (2010) Energy × × × Not specified
Suat and iftcioglu (2013) international journal of hydrogen energy × × Not specified
Talavera et al (2017) Energy × × Europe and USA
Thu and John (2015) S. Energy Technologies and Assessments × × Denmark
Tomasini et al (2017) Applied Thermal Engineering × × Not specified
Tomoki and Toru (2015) Applied Energy × × Japan
Tonini and Thomas (2012) Applied Energy × × Denmark
Toolseeram (2008) Journal of Cleaner Production × × Mauritius
Toshiyuki and Mika (2015) Energy Economics × × United States
Turconi et al (2013) Renewable and Sustainable Energy Reviews × × × Not specified
Turconi et al (2014) Journal of Life Cycle Assessment × × × Denmark
Turconi et al (2014) Applied Energy × × × Ireland
Turconi, et al (2014) Applied Energy × × × Denmark
Valentina et al (2015) Biomass and Bioenergy × × × × Italy
Vargas et al (2015) Applied Thermal Engineering × × Mexico
Viebahn and Nitsch (2007) journal of greenhouse gas control × × Germany
Vuk et al (2016) Energy Conversion and Management × × Serbian
Wang and Sun (2012) Renewable Energy × × Not specified
Wei-Cheng and Heng-Yi (2017) Journal of Cleaner Production × × Taiwan
Xiaoyu et al (2011) Applied Energy × × China
Yaw et al (2014) Renewable and Sustainable Energy Reviews × × Not specified
Yemane et al (2017) Applied Energy × × Canada
Yemane et al (2017) Journal of Cleaner Production × × Not specified
Yuan et al (2015) Energy × × × China
Yu-Fong et al (2017) Renewable Energy × × Not specified
Yuxuan and Tianye (2012) Renewable Energy × × China
Zhao et al (2015) Energy × × China
Zhao et al (2016) Energy Sources × × China