How to Test, Analyze, and Reduce Memory
Interference Delay in Modern COTS Multicore
Systems?
Nizar Msadek
University of Luxembourg
Interdisciplinary Centre for Security, Reliability and Trust (SnT) Esch-sur-Alzette, Luxembourg
Email: [email protected]
Abstract: In modern Commercial Off-The-Shelf (COTS) multicore systems, cores can produce several simultaneous memory requests. The processing of such requests over the memory controller negatively impacts the interference delay triggered by running parallel tasks on the platform. In this paper, we propose a software-based testing approach for analyzing memory interference delay, when cores are exposed to extensive read/write requests that access in parallel their Cache Coherent Interconnect. The hardware targeted in this work is the well-known LayerScape QorIQ LS2085A, which can be approached as a potential successor to the Freescale QorIQ P4080. The test analysis was conducted based on a bare-metal operating system that we developed to guarantee a deterministic execution environment at all time points. Our testing was accomplished using a set of carefully designed synthetic benchmarks as well as TACLeBench benchmarks.
Keywords:Memory Delay; Multicore Systems; Interference Delay; Real-Time Systems; Testing
1. Introduction
While the processing of many simultaneous memory requests generally improves the overall memory performance, there remains a challenge to understand precise timing anomalies related to memory in a context where several applications run concurrently. This is because each memory request is likely to be interfered by other requests. Accordingly, analyzing interference delays in modern COTS multicore systems is an important topic in the real-time research community. The targeted hardware in the present study is the well-documented QorIQ LS2085A, a potential successor to Freescale QorIQ P4080. We examine its memory interference delays as well as their impact on the overall system performance. Our study is elaborated based on the publicly available information provided in [1] [2] [3] [4] [5] [6] [7] [8]. Specifically, our contributions are as follows:
(i) To the best of our knowledge, this is the first analysis study examining memory interference delay with respect to the LS2085A platform.
(ii) We provide a comprehensive analysis of the LS2085A platform to know all essential information about the board, including memory hierarchy, I/O interfaces, and cores.
(iii) In order to support the underlying platform, we design a bare metal operating system in which no preemptions and/or other side effects may disturb the measurements at runtime.
(iv) We experimentally analyze the platform using carefully designed synthetic benchmarks as well as TACLeBench benchmarks.
The paper is organized as follows: Section 2 provides background on the QorIQ LS2085A platform. Section 3 outlines the control mechanisms used for efficient synchronization of cores at runtime. Section 4 presents evaluation results. Section 5 discusses related work. Finally, concluding remarks are presented in Section 6.
48 KB
I-Cache D-Cache32 KB
48 KB I-Cache
512 KB Coherent L2 Cache ARM® A57 Core
64-bit DDR4
Cache Coherent Interconnect
SA TA 3 .0 System Control Internal BootROM Security Fuses Security Monitor Power Management SA TA 3 .0
8-lane 10 GHz SerDes 8-lane 10 GHz SerDes 48 KB
I-Cache D-Cache32 KB
48 KB I-Cache
512 KB Coherent L2 Cache ARM® A57 Core
512 KB Coherent L2 Cache
32 KB D-Cache
48 KB
I-Cache D-Cache32 KB I-Cache48 KB
1 MB Coherent L2 Cache ARM® A57 Core ARM® A57 Core
1 MB Platform Cache 32-bit DDR4 Memory Controller Memory Controller 64-bit DDR4 Memory Controller P C Ie P C Ie PC Ie (S R -IO V) P C Ie
SMMU SMMU SMMU
System Interfaces IFC Flash QuadSPI Flash eSDHC 2x DUART 4x I2C 4x FlexTimer
2x USB 3.0 + PHY
SPI
Service Processor
DCE Security Engine
4 MB PEB memory WRIOP Queue / Buffer Manager PME Advanced IO Processor (AIOP) Management Complex DPAA2 Hardware Layer 2 Switch Assist
8x 1/10G + 8x 1G
9x WDOG
4x GPIO
QDMA
Figure 1.QorIQ LS2085A Board Block diagram (according to [3])
2. Architectural Description
Modern COTS-based multicore systems support a high degree of level memory parallelism through a variety of sophisticated components. This section provides the background on these components and reviews existing techniques for achieving shared-memory parallelism. The LayerScape QorIQ LS2085A [1] [2] computing platform is considered a prominent example of modern COTS MPSoC that enables the realization of smarter and predictable safety-critical systems of tomorrow. It is based on ARM technology [9] and belongs to the QorIQ LS2 family of communication processors [10]. It is also a successor to the Freescale QorIQ P4080. Figure 1 provides an overview of the LayerScape QorIQ LS2085A. Its main parts are further detailed in the below sections.
2.1. Overview and Memory Hierarchy
The QorIQ LS2085A board consists of eight Cortex-A57 cores running at 2 GHz. Each core has separate L1 data/instruction caches and one unified L2 cache per two cores. The data cache has a capacity of 32 KB, whereas the instruction cache has a capacity of 48 KB. The size of L2 caches is larger than the level one caches, equivalent to 1 MB. The cores communicate among themselves and with the main memory over the Cache Coherent Interconnect (CCI). The CCI allows for two memory controllers to connect DDR4 RAM to the cores. Each controller sits behind 1 MB of global L3 cache.
2.2. Cache Coherent Interconnect
* * *
Miscellaneous
Level 2 memory system Load
store
Adv SIMD and FP
Cryptography†
Dispatch stages Rename
Virtual to physical register pool
Return stack
Instruction fetch
L2-TLB
Debug ETM
Data TLB
Data cache
Decode Writeback
Slave
Processor arbitration (1stlevel)
Instruction cache
Instruction TLB Debug
and CTI
L2 arbitration (2ndlevel)
Auto prefetch engine Fill / Evict
buffers Master
System registers Registerfile
ACP Memory
interface
Trace CPU InterfaceGIC
Interrupts TimerEvents
Generic Timer
Ind Pred
Integer execute
Cortex-A57 MPCore
*Depending on the implementation, this feature might not be available
Branch prediction
L2 data RAM (512KB to 2MB)
Snoop TAG RAM Snoop
PMU
ACE or CHI
APB ATB AXI4-Stream
Message interrupts Trace
output Debug
AXI
* Core 0 Core 1
Core 2 Core 3
Figure 2.Block diagram of a Cortex-A57 core according to [6]
2.3. Cortex-A57
ARM Cortex-A57 [6] is a high-performance, low-power core that belongs to the latest family of A5X-Series. Its implementation is based on ARMv8-A architecture [7] and integrates eight cores in a single multicore device, with L1 and L2 cache subsystems. Figure 2 gives an overview of its main different parts. The QorIQ LS2085A platform considered in this study differs from the implementation depicted in Figure 2 in the number of cores (i.e., eight cores are used instead of four).
2.3.1. Instruction Fetch
Lookaside Buffer (TLB) that disposes of native support for 4KB, 64KB, and 1MB page sizes. The 2-level dynamic predictor is equipped with a Branch Target Buffer (BTB) for fast target generation.
2.3.2. Instruction Decode
The Instruction Decode Engine (IDE) supports both A32 and A64 instruction sets (see Section 3 for further details) as well as the advanced SIMD and Floating-Point instruction sets. It also features a modern technique for register renaming that facilitates out-of-order executions by removing Write-After-Write (WAW) and Write-After-Read (WAR) hazards [11].
2.3.3. Instruction Dispatch
The Instruction Dispatch Engine (IDiE) performs checks on the decoded instructions. This is an important task that allows to control in a deterministic way when the pipelines are executed and when the results are retried. The Dispatch Engine supports different types of general purpose registers for both AArch32 and AArch64 states (see Section 3) as well as for the advanced SIMD and floating-pint operations.
2.3.4. Integer Execute
The Integer Execute Engine (IEE) is responsible for executing all integer type instructions that include:
• Two symmetric Arithmetic Logical Unit (ALU) pipelines • Integer multiply-accumulate and ALU pipeline
• Iterative integer divide hardware
• Branch and instruction condition codes resolution logic • Result forwarding and comparator logic
2.3.5. Load/Store Engine
The load/Store Engine (LSE) is responsible for managing all load and store operations. It maintains coherency between the L1 and L2 memory systems, and uses a 32KB 2-way set-associative cache with a 64-byte cache line. The latter is characterized by an optional Error Correction Code (ECC) protection per 32-bits. The Load/Store Engine also contains a 32-entry fully-associative L1 data referred as to TLB, which provides support for 4KB, 64KB, and 1MB page sizes.
2.3.6. L2 Memory System
The L2 memory system maintains L1 instruction and data cache misses from each core. It coordinates requests from the AXI4-Stream, the ACE/CHI master interface and the ACP slave interface. L2 memory features the following capabilities:
• L2 cache with:
– 512KB, 1MB, or 2MB configurable size
– 16-way set-associative cache with data ECC protection per 64-bits
• Duplicate copy of L1 data cache Tag RAMs from each core for handling snoop requests • 4-way set-associative of 1024-entry L2 TLB in each core
• Automatic hardware prefetcher with programmable instruction fetch and load/store data prefetch distances
3. System Control
Register Width Description
R0 – R14 32-bit general-purpose registers SP 32-bit stack pointer, alias for R13 LR 32-bit link register, alias for R14 PC 32-bit exposed program counter S0 – S31 32-bit floating-point registers D0 – D31 64-bit floating-point/SIMD registers Q0 – Q31 128-bit SIMD registers
Table 1.AArch32 Registers
Register Width Description
W0 – W30 32-bit general-purpose registers X0 – X30 64-bit general-purpose registers LR 64-bit link register, alias for X30 SP 64-bit stack pointer
XZR 64-bit zero register
V0 – V31 128-bit floating-point/SIMD registers
Table 2.AArch64 Registers
Inst. Aarch32 Aarch64
I.1 ADD R1, R2, R3 ADD W1, W2, W3
I.2 VCMP.F64 D0, D1 FCMP D0, D1
VMRS APSR_nzcv, FPSCR
Table 3.Example of processing instructions in Aarch32 and AArch64 (according to[15]).
existing 32-bit code. This Cortex-A57 core is also equipped with a fully out-of-order execution pipeline which enables to process up to 128 instructions in parallel [11]. Each instruction can be broken into micro operations which are dispatched to multiple arithmetic, branch, floating-point, and load/store execution units. The following section provides an overview of the register allocation as well as the processing instructions of both AArch32/AArch64 states.
3.1. Register Allocation
Tables 1 and 2 illustrate the user-visible registers available on AArch32 and AArch64 execution states. The AArch32 execution state provides fifteen 32-bit registers which are referred to as R0-R14 and sixteen 128-bit single-instruction multiple-data registers labeled as Q0-Q15. The SIMD registers are sometimes referred to as NEON registers and can be used in pairs of 64-bit registers from D0 to D31. For instance, D0 and D1 are the lower and higher parts of Q0. It is important to note that all registers delivered by AArch32 are also accessible when the core is operating at AArch64 execution state. Detailed descriptions of the different techniques for mapping registers from AArch32 to AArch64 have been extensively documented elsewhere [13] [14] [4], and do not form part of the scope of this paper. The AArch64 execution state has the additional thirty-one 64-bit registers labeled as X0-X30, and thirty-two 128-bit NEON registers as V0-V31. All registers are accessible at all times, and in all Exception levels. The XZR register is tasked to hold the constant 0 when it is used as a source register, and to discard the result if it is used as a destination register. The Stack Pointer (SP) is mostly used as a load/store base register, and in a small cases for arithmetic instructions to provide access to the current stack pointer. For more details on this topic, please refer to [5].
3.2. Processing Instructions
and another to load the result into the condition flag register. The same operation, however, on AArch64 would require only one instruction.
3.3. Enabling/Disabling Caches
Some ARMv7-A based cores such as Cortex-A9 require the use of software in order to disable all caches in the system [8]. The use of such software is no longer necessary for the ARMv8-A based Cortex-A57 since the hardware is able to disable automatically the caches after each reset. Nevertheless, in the event of a core powerdown process [8], enabling and disabling caches would prove useful. Therefore, the Cortex-A57 offers a set of operations to interact with caches as shown in Listings 1 and 2.
1 ** read SCTLR_EL1 into x1
2 MRS x1, SCTLR_EL1
3 ** set bit 2 and enable data caching
4 ORR x1, x1, #(0x1 << 2)
5 ** set bit 12 and enable instruction caching
6 ORR x1, x1, #(0x1 << 12)
7 ** write x1 to SCTLR_EL1 back
8 MSR SCTLR_EL1, x1
Listing 1: how caches are enabled
1 ** read SCTLR_EL1 into x1
2 MRS x1, SCTLR_EL1
3 ** clear bit 2 and disable data caching
4 EOR x1, x1, #(0x1 << 2)
5 ** clear bit 12 and disable instruction caching
6 EOR x1, x1, #(0x1 << 12)
7 ** write x1 to SCTLR_EL1 back
8 MSR SCTLR_EL1, x1
Listing 2: how caches are disabled
The System Control Register (SCTLR) controls the enabling and disabling of caches. If bit 2 and 12 are set, all access permissions are granted and thus the I/D caches are activated. Conversely, if bit 2 and 12 are cleared then caches will be deactivated.
3.4. I/O interfaces
LS2085A architecture provides support for different I/O interfaces, which are used to connect with master and slave devices. Master devices are essentially controlled by master interfaces. These interfaces are able to perform memory accesses via the Coherent Interconnect. Examples of such master interfaces include the Peripheral Component Interconnect Express (PCI/PCIe) and the Serial AT Attachment (SATA). Because of their direct link with the Interconnect, master interfaces can potentially impact the interference delays of cores at runtime. The slave interfaces cannot initiate memory access on their own as is the case of master interfaces. They are rather triggered by software. Slave interfaces include Dual asynchronous receiver/transmitter (DUART), Serial Peripheral Interface (SPI), and Inter-Integrated Circuit (I2C).
3.5. Synchronization Mechanisms
Synchronization between cores in their access memory is necessary for maximizing utilization at runtime. Cortex-A57 attempts to perform this – among others – by optimizing the order of instruction executions and data accesses, e.g., by optimizing the sequence of instructions as presented in Listings 3.
1 ** Load from Normal/Cacheable memory leads to a cache miss
3 ** Store to Normal/Non-cacheable memroy
4 STR X2, [X3]
Listing 3: In-Order execution of instructions
Let us assume that the first instruction we wish to execute leads to a cache miss. As a result, the processor would wait many cycles for the load to complete before executing the store instruction. In Cortex-A57, this delay can be significantly reduced. To do so, the processor recognizes where no dependence exists between the instructions and then executes the store instruction before the load instruction. In some cases, however, these speculative reads or out-of-order executions are not desirable since they can lead to unintended program behavior. For this purpose, synchronization mechanisms are needed. Some of them are introduced as follows:
3.5.1. Primitive Instructions
Cortex-A57 core provides primitive instructions to perform atomic memory accesses, including
LoadandStore exclusiveinstructions (LDXR/STXR). These are typically used to ensure that multiple processes do not interfere with each other when accessing the same physical address. The LDXR/STXR pair works as follows: LDXR loads a value from a memory address and tries to claim an exclusive lock on this address. When the lock succeeds, the STXR sets afterwards the new value on that location. Both LDXR/STXR instructions are typically used as a basis to implement spinlocks or mutexes (see below the SubsectionMutexes).
3.5.2. Barriers
there are different types of barriers supported by the ARM Cortex-A57 core:
• Data Memory Barrier (DMB) forces that all memory accesses before the DMB instruction terminate before any memory access after the DMB instruction starts.
• Data Synchronization Barrier (DSB)terminates when all instructions before the DSB instruction terminate.
• Instruction Synchronization Barrier (ISB) flushes the CPU pipeline in such a way that all instructions coming after the ISB are fetched from cache or memory, once the ISB has been completed.
3.5.3. Mutexes
The aforementioned instructions will be made clear using a mutex as an example. A mutex is a flag that enables to access a program block in an atomic fashion. The below listings outlines the implementation of mutex lock/unlock in the Cortex-A57 core using LDXR/STXR.
1 LOCKED EQU 1
2 UNLOCKED EQU 0
3
4 lock_mutex
5 ** Check if locked
6 LDXR w1, [w0]
7 ** Compare with "locked"
8 CMP w1, #LOCKED
9 ** Mutex is locked, go into standby
10 WFEEQ
11 ** On waking recheck the mutex
12 BEQ lock_mutex
13
14 ** Attempt to lock mutex
16 ** Attempt to lock mutex
17 STXR w2, w1, [w0]
18 ** Check whether store completed
19 CMP w2, #0x0
20 ** If store failed, try again
21 BNE lock_mutex
22 ** Required before accessing protected resource
23 DMB
24 RET lr
Listing 4: Exemplified implementation of a mutex lock
Thelock_mutexfunction is responsible for acquiring the mutex or blocking until it is acquired. If the mutex is blocked, then all processes must wait for an event WFEEQ before retrying. The function first executes aLoad-Exclusiveinstruction to get the address passed in W0. The value of this address is then compared withlocked. If the mutex is locked, the process is momentarily halted before invoking the functionlock_mutexagain, otherwise, it performs aStore-Exclusiveof the value locked. In the case that theStore-Exclusiveoperation succeeds, the process will execute a DMB and return.
1 unlock_mutex
2 ** Ensure accesses to protected resource have completed
3 DMB
4 ** Write "unlocked" into lock field
5 MOV w1, #UNLOCKED
6 STR w1, [w0]
7 cbnz
8 ** Ensure update of the mutex occurs before others wake
9 DSB
10 ** Send event to other CPUs
11 SEV
12 RET lr
Listing 5: Exemplified implementation of a mutex unlock
The task ofunlock_mutexis to release the mutex and send an event of type SEV in order to notify all processes of the change. Afterwards, the function executes a DMB operation to ensure that all memory accesses are done in that point of time. It writesunlockedand stores the value ofunlockedin W1. It should be noted that for the store operation a normal STR instruction is used. This is because only one process is currently holding the mutex. In such a case, a DSB is needed to ensure update before other processes wake. Processes are then notified and the program return.
4. Evaluation
This section introduces the methodology used to evaluate the target LS2085 platform. A bare-metal operating system was developed in order to guarantee a deterministic execution environment at all time points. This was a necessary step to avoid any side effects that might occur during the evaluation, and which may impact the overall measurement setup. Using this operating system, a series of measurements were conducted. The focus lies basically on determining the interference delays and memory accesses of cores. The methodology for investigating these measurements contains the following two steps:
• Micro-Benchmarking:in the first step an exploring evaluation is used to examine fundamental properties of the LS2085 platform and its limitations in providing these properties.
4.1. Micro-Benchmarking
Following a description of the evaluation setup, measurement results are presented and followed by a discussion on the Micro-Benchmarking.
4.1.1. Evaluation Setup
The evaluation setup adopted in the present study is similar to that proposed in [16]. A synthetic interference application was created to constantly trigger load/store instructions for all cores. The application runs on a bare-metal operating system in such a way that no preemptions can disturb the measurements during runtime. The body of the application contains a main loop which is executed within one thread per core. Algorithm 1 shows its implementation in pseudocode. At the beginning,
Algorithm 1General Measurement Loop
1: for0 toNMEAS do
2: callenable/disable_caches()
3: callbarrier()
4: calltime()
5: callmeas_loop(OPERATION,NBYTES,GAP)
6: calltime()
7: end for
all caches are enabled or disabled depending on the conducted experiment. Then, a barrier is used to start the cores at the same time and thus in parallel. This barrier is implemented according to the concepts presented in Section 3.5. Once the synchronization is complete, the measurement function
meas_loopis executed and the time intervals are calculated for each core based on their Time Base Register. The following provides an overview of the parameter settings used:
• NMEAS:stands for the number of replayed scenarios in which the measurements are reported. For this evaluation setup, NMEAS is set to 100 since no significant changes in the results have been observed for larger values of NMEAS.
• Operation: serves to specify the type of operation needed for each conducted experiment. To ensure that the LS2085 platform is evaluated under a great variety of conditions, cores were divided into master and slave cores. For all conducted experiments, only one master is responsible for executing and reporting the results whereas the slaves execute only the routine, and thus in parallel with the master. Since the synthetic application can only issue read or write requests, we decided to consider the following type of operations:
– WM/WS:Write (Master) with concurrent write (Slaves)
– WM/RS:Write (Master) with concurrent read (Slaves)
– RM/WS:Read (Master) with concurrent write (Slaves)
– RM/RS:Read (Master) with concurrent Read (Slaves)
• GAP:is essential to control the cache line size. Obviously, the choice of this parameter is only relevant when the caches are activated. For a cache line size of 64B, an offset of 64B is needed – called GAP (see [16] for further details).
In themeas_loop, two macros were used to trigger both of load and store instructions. An exemplary instrumentation of the read macro is shown in Listing 6. Please note that before calling this macro, the registers x0, x1, and x2 are initially filled with begin/end address as well as the gap value, respectively.
Listing 6: Macro code for read memory requests
1 asm volatile(
2 "MOV x9, x0\n\t"
4 "LDRB w10, [x9 , #0x000]\n\t"
5 "LDRB w10, [x9 , #0x040]\n\t"
6 "LDRB w10, [x9 , #0x080]\n\t"
7 "LDRB w10, [x9 , #0x0c0]\n\t"
8 "LDRB w10, [x9 , #0x100]\n\t"
9 "LDRB w10, [x9 , #0x140]\n\t"
10 "LDRB w10, [x9 , #0x180]\n\t"
11 "LDRB w10, [x9 , #0x1c0]\n\t"
12 "ADD x9, x9, x2\n\t"
13 "CMP x1, x9\n\t"
14 "BHI read_loop\n\t"
15 "NOP");
In the first line, the begin address is moved to x9. Then, aread_loopis called between line 3 and 14 to trigger continuously read accesses in register w10. For each iteration, a gap is added to increment the value of address begin and a comparison is then performed in line 13 to check the end. If the end is reached the macro terminates, otherwise theread_loopis called again. In almost the same manner as the read macro, the write macro has been implemented.
Listing 7: Macro code for write memory requests
1 asm volatile(
2 "MOV x9, x0\n\t"
3 "MOV x10, #0x2a\n\t"
4 "write_loop:\n\t"
5 "STRB w10, [x9 , #0x000]\n\t"
6 "STRB w10, [x9 , #0x040]\n\t"
7 "STRB w10, [x9 , #0x080]\n\t"
8 "STRB w10, [x9 , #0x0c0]\n\t"
9 "STRB w10, [x9 , #0x100]\n\t"
10 "STRB w10, [x9 , #0x140]\n\t"
11 "STRB w10, [x9 , #0x180]\n\t"
12 "STRB w10, [x9 , #0x1c0]\n\t"
13 "ADD x9, x9, x2\n\t"
14 "CMP x1, x9\n\t"
15 "BHI write_loop");
The only difference with the previous example – Listing 6 – is that the store instructions are used instead of loads to permanent trigger the write accesses. Listing 7 shows an exemplary instrumentation of its code.
4.1.2. Evaluation Results
3 4 5 2
4 6 8
·107
Active cores Max. Interfer ence Delay per Cor e [cycles] WM/WS WM/RS RM/WS RM/RS
(a) Disabled caches
1 2 3 4 5 6 7 8
2 4 6
·107
Active cores Max. Interfer ence Delay per Cor e [cycles]
(b) Enabled caches
Figure 3.Maximal interference delay measured with disabled/enabled caches
1 2 3 4 5 6 7 8
0.2 0.4 0.6 0.8
1 ·10
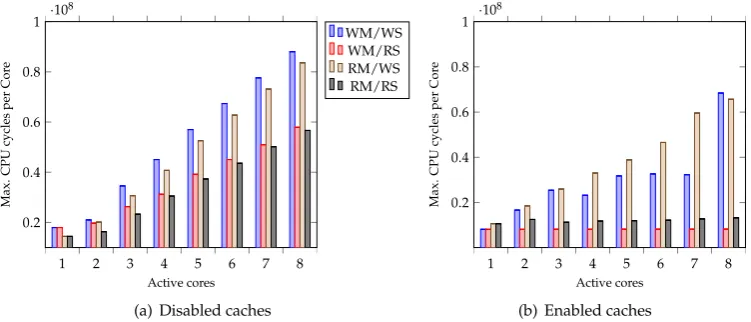
8 Active cores Max. CPU cycles per Cor e WM/WS WM/RS RM/WS RM/RS
(a) Disabled caches
1 2 3 4 5 6 7 8
0.2 0.4 0.6 0.8
1 ·10
8 Active cores Max. CPU cycles per Cor e
(b) Enabled caches
Figure 4.Maximum number of CPU cycles measured with disabled/enabled caches
four experiments examine the max/min performance values evaluated with disabled/enabled caches under the consideration of all Read/Write combinations:
• Experiment 1.a - 1.b: Maximal interference delay measured with disabled/enabled caches (see Figure 3)
• Experiment 2.a - 2.b: Maximum CPU cycles measured with disabled/enabled caches (see Figure 4)
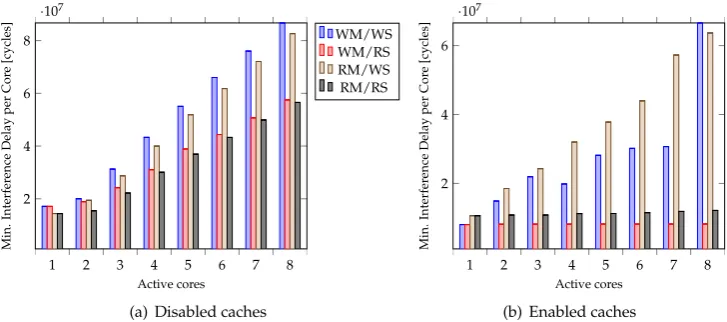
• Experiment 3.a - 3.b: Minimal interference delay measured with disabled/enabled caches (see Figure 5)
• Experiment 4.a - 4.b: Minimum CPU cycles measured with disabled/enabled caches (see Figure 6)
4.1.3. Discussion of the Evaluation Results
1 2 3 4 5 6 7 8 2
4 6 8
·107
Active cores
Min.
Interfer
ence
Delay
per
Cor
e
[cycles]
WM/WS WM/RS RM/WS RM/RS
(a) Disabled caches
1 2 3 4 5 6 7 8
2 4 6
·107
Active cores
Min.
Interfer
ence
Delay
per
Cor
e
[cycles]
(b) Enabled caches
Figure 5.Minimal interference delay measured with disabled/enabled caches
1 2 3 4 5 6 7 8
0.2 0.4 0.6 0.8
1 ·10
8
Active cores
Min.
CPU
cycles
per
Cor
e
WM/WS WM/RS RM/WS RM/RS
(a) Disabled caches
1 2 3 4 5 6 7 8
0.2 0.4 0.6 0.8
1 ·10
8
Active cores
Min.
CPU
cycles
per
Cor
e
(b) Enabled caches
a result to produce also more interference delays and CPU time (see experiment 2.a - 2.b) to achieve coherency.
4.2. Comparative Benchmarking
The above introduced setup is now extend by a set of benchmarks to further analyze the performance of the QorIQ LS2085A. This section includes a description of the extended methodology, the experiment results and a discussion.
4.2.1. Extended Setup
the aim was to examine the performance of the LS2085A with respect to different benchmarks from the TACLeBench collection [17]. For this purpose, the latest version1of the TACLeBench was used. It consists of a collection of 102 self-contained algorithms - i.e., meaning that no extra dependencies are needed for standard libraries or specific operating systems. This characteristic makes the TACLeBench collection indeed very suitable for our conducted experiments. However, evaluating all the 102 algorithms would go beyond the scope of this paper, we decided therefore to restrict ourselves only to some of them. We selected those algorithms which have a runtime higher than 10000 and less than 1000000 clock cycles. Table 4 gives an overview of the resulted set.
Name SLOC Description Application Area
binarysearch 47 Binary search of 15 integers Controlling
fac 21 Factorial function Optimization
prime 41 Prime number test Safety/Security
bitcount 164 Couting number of bits in an integer array Data Loading
fft 78 1024-point FFT, 13 bits per twiddle Audio/Image Processing
insertsort 35 Insertion sort Controlling
matrix1 28 Generic matrix multiplication Optimization
md5 344 Message digest algorithm Safety/Security
sha 382 NIST secure hash algorithm Safety/Security
Table 4.Benchmark characterization, showing the code size, description and exemplary application areas.
In order to guarantee that all these benchmarks are evaluated under different Read/Write conditions, we decided to consider the following two operations:
• BM/WS:Selected Benchmark (Master) with concurrent write (Slaves) • BM/RS:Selected Benchmark (Master) with concurrent read (Slaves)
For each operation, one benchmark is selected and executed on a master core (BM) iteratively within a loop of 100 iterations. The synthetic application is solely used to intensify the effect of Read/Write interferences (WS,RS) at runtime. It is executed in parallel on the remaining cores – called slaves – until the selected benchmark terminates. And finally, the master takes on the role of reporting the measurements as done before by the micro-benchmarking setup.
4.2.2. Evaluation Results
In the following the results of the performance measurements according to the benchmarks that were introduced in Section 4.2.1 are presented. These benchmarks are evaluated within different scenarios of disabled/enabled caches and each of them for both combinations of BM/WS and BM/RS operations. All of the conducted experiments were replayed 100 times and the maximum values are reported first due to their relevance in determining the WCETs. Nevertheless for the sake of completeness, the
minimum results have also been added at the end. The aspects of interest include the interference delays and cpu cycles. These aspects are always shown on the y-axis depending, on the conducted experiment. Values on the x-axis stand for the selected benchmark with respect to its number of active cores. The representation of four and six cores were omitted for simplicity purposes, since they bring no additional information in interpreting the output results. Therefore, the term of 1 reflects that only one core is active and 8 that all cores are active. The first six experiments examine the maximal interference delays for all benchmarks – evaluated with disabled/enabled caches under the consideration of all Read/Write combinations – whereas the last six experiments consider the performance measurements related to CPU performance.
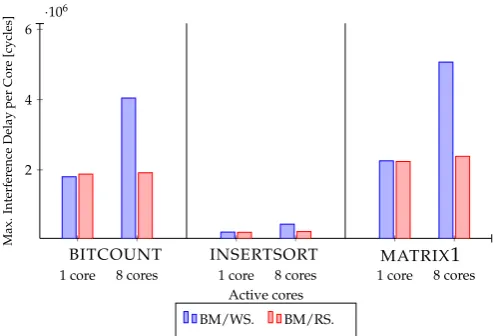
• Experiment 5.a - 5.c: Maximal interference delay measured with disabled caches. (see Figures 7, 8 and 9)
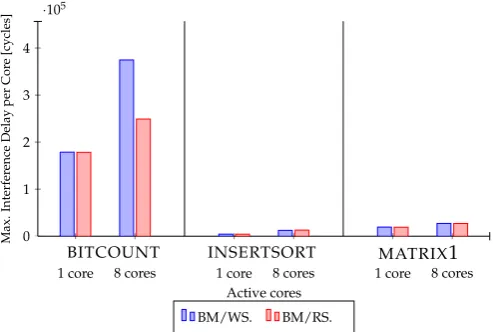
• Experiment 6.a - 6.c: Maximal interference delay measured with enabled caches. (see Figures 10, 11, and 12)
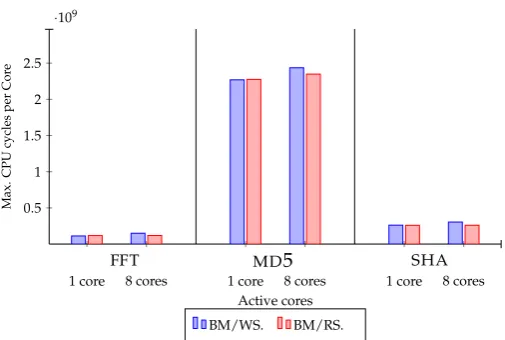
• Experiment 7.a - 7.c: Maximum CPU cycles measured with disabled caches. (see Figures 13, 14, and 15)
• Experiment 8.a - 8.c: Maximum CPU cycles measured with enabled caches. (see Figures 16, 17, and 18)
BINARYSEARCH FAC PRIME
1 core 8 cores 1 core 8 cores 1 core 8 cores
0.5 1 1.5
·105
Active cores
Max.
Interfer
ence
Delay
per
Cor
e
[cycles]
BM/WS. BM/RS.
Figure 7.Experiment 5.a: Maximal interference delay measured with disabled caches for one and eight active cores. The considered benchmarks are binarysearch, fac, and prime.
BITCOUNT INSERTSORT MATRIX1
1 core 8 cores 1 core 8 cores 1 core 8 cores
2 4 6
·106
Active cores
Max.
Interfer
ence
Delay
per
Cor
e
[cycles]
BM/WS. BM/RS.
FFT MD5 SHA
1 core 8 cores 1 core 8 cores 1 core 8 cores
0.5 1 1.5 2 2.5
·109
Active cores
Max.
Interfer
ence
Delay
per
Cor
e
[cycles]
BM/WS. BM/RS.
Figure 9.Experiment 5.c: Maximal interference delay measured with disabled caches for one and eight active cores. The considered benchmarks are fft, md5, and sha.
BINARYSEARCH FAC PRIME
1 core 8 cores 1 core 8 cores 1 core 8 cores
0 0.2 0.4 0.6 0.8 1 1.2
·105
Active cores
Max.
Interfer
ence
Delay
per
Cor
e
[cycles]
BM/WS. BM/RS.
Figure 10. Experiment 6.a: Maximal interference delay measured with enabled caches for one and eight active cores. The considered benchmarks are binarysearch, fac, and prime.
BITCOUNT INSERTSORT MATRIX1
1 core 8 cores 1 core 8 cores 1 core 8 cores
0 1 2 3 4
·105
Active cores
Max.
Interfer
ence
Delay
per
Cor
e
[cycles]
BM/WS. BM/RS.
FFT MD5 SHA
1 core 8 cores 1 core 8 cores 1 core 8 cores
1 2 3
·107
Active cores
Max.
Interfer
ence
Delay
per
Cor
e
[cycles]
BM/WS. BM/RS.
Figure 12. Experiment 6.c: Maximal interference delay measured with enabled caches for one and eight active cores. The considered benchmarks are fft, md5, and sha.
BINARYSEARCH FAC PRIME
1 core 8 cores 1 core 8 cores 1 core 8 cores
0.6 0.8 1 1.2 1.4 1.6
·105
Active cores
Max.
CPU
cycles
per
Cor
e
BM/WS. BM/RS.
Figure 13.Experiment 7.a: Maximum number of CPU cycles measured with disabled caches for one and eight active cores. The considered benchmarks are binarysearch, fac, and prime.
BITCOUNT INSERTSORT MATRIX1
1 core 8 cores 1 core 8 cores 1 core 8 cores
0 2 4 6
·106
Active cores
Max.
CPU
cylces
per
Cor
e
BM/WS. BM/RS.
FFT MD5 SHA
1 core 8 cores 1 core 8 cores 1 core 8 cores
0.5 1 1.5 2 2.5
·109
Active cores
Max.
CPU
cycles
per
Cor
e
BM/WS. BM/RS.
Figure 15.Experiment 15.c: Maximum number of CPU cycles measured with disabled caches for one and eight active cores. The considered benchmarks are fft, md5, and sha.
BINARYSEARCH FAC PRIME
1 core 8 cores 1 core 8 cores 1 core 8 cores
0 0.5 1 1.5
·104
Active cores
Max.
CPU
cycles
per
Cor
e
BM/WS. BM/RS.
Figure 16.Experiment 8.a: Maximum number of CPU cycles measured with enabled caches for one and eight active cores. The considered benchmarks are binarysearch, fac, and prime.
BITCOUNT INSERTSORT MATRIX1
1 core 8 cores 1 core 8 cores 1 core 8 cores
0 1 2 3 4
·105
Active cores
Max.
CPU
cycles
per
Cor
e
BM/WS. BM/RS.
FFT MD5 SHA
1 core 8 cores 1 core 8 cores 1 core 8 cores
1 2 3
·107
Active cores
Max.
CPU
cycles
per
Cor
e
BM/WS. BM/RS.
Figure 18.Experiment 8.c: Maximum number of CPU cycles measured with enabled caches for one and eight active cores. The considered benchmarks are fft, md5, and sha.
Now the minimum performance values are presented. The first six experiments examine the minimal interference delays for all benchmarks evaluated with disabled/enabled caches under the consideration of all Read/Write combinations:
• Experiment 9.a - 9.c: Minimal interference delay measured with disabled caches. (see Figures A.1, A.2, and A.3)
• Experiment 10.a - 10.c: Minimal interference delay measured with enabled caches. (see Figures A.4, A.5, and A.6)
In Experiments 11.a - 12.c the minimum number of CPU cycles is examined
• Experiment 11.a - 11.c: Minimum CPU cycles with disabled caches. (see Figures A.7, A.8, and A.9)
• Experiment 12.a - 12.c: Minimum CPU cycles measured with enabled caches. (see Figures A.10, A.11, and A.12)
4.2.3. Discussion of the Evaluation Results
As shown in Experiments 5.a - 5.c, the benchmarks differ in how they affect the interference delays. Some are more sensitive than others:MD5 disposes of the highest interference delay,FAChas the lowest one, and the other benchmarks lie in between. This can be seen as evident, since each benchmark has its own characteristic in terms of code structure/size, iteration loop, and input data. Moreover, the number of active cores plays an important role in influencing these delays. The more cores are used, the larger the interferences are. We found as well that the interference delays correlate closely with the used type of Read/Write operations. The WS operations generate in general more slowdown than RS operations. This can be explained by the fact that processing several concurrent write operations would extensively modify data and has as a result to produce also more interference delays and CPU time (see Experiment 7.a 7.c) to achieve coherency. Furthermore, it can be seen from experiments 6.a -6.c that enabling caching has a positive impact on increasing cache hits, and thus enables to reduce overhead delay in the Cache Interconnect. In Experiments 7.a - 7.c, the impact of this delay reduction on the CPU time was also considered. As expected, the result reveal a good reduction of CPU time, since the coherency was maintained more quickly than with disabled caching and therefore no extra effort is needed from the CPU. Similarly to the maximum delays, the minimum delays in Experiments 9.a - 12.c were investigated and the same conclusion as above was drawn.
5. Related Work
for creating more predictable real-time systems. At the beginning, many computer scientists treat the cost to access memory as a constant. They regard the main memory as a single shared resource by the cores [18] [19] [20] [21]. However, modern COTS-based multicore systems are composed of complex memory components and the memory access cost is far from being a simple constant, since it can change drastically depending on the parameters set by the memory controller to activate components in the system.
The methodology presented in this study differs from state of the art approaches in two fundamental points: 1) we do not consider the main memory as a single shared resource by the cores, and 2) it is not limited to a specific memory component. Moreover, our methodology is software-based, generic, and applicable to any kind of COTS-based multicore Systems. Thus, we want to compare it to approaches that employ similar constraints. The methodology closest to us is [22]. The authors propose an analytical model to examine interference delay in modern multicore systems. Their analysis is based on simulations with assumed non-blocking caches and a DRAM controller that prioritizes reads over writes. However, as these assumptions are not always realistic, they cannot be used to analyze precisely interference delay as we do in this work. Our analysis, in contrast, is conducted on a real COTS multicore platform with a set of carefully designed synthetic benchmarks as well as TACLeBench benchmarks. Moreover, we consider different testing scenarios to generate memory requests at runtime.
6. Conclusion
This is the first study on analyzing memory interference delay in the LayerScape QorIQ LS2085A platform. Through micro- and macro-benchmarking, the paper has shown that enabled caching produces less overhead delay than with disabled caching. This is due to the impact of cache hits which eliminates the need to contact the main memory frequently. The paper also experimentally demonstrates that the memory interference delay does not only correlate with the number of used cores, but also with the used type of Read/Write operations. The WS operations generate more slowdown than RS operations. This is explained by the fact that processing several concurrent write operations modifies extensively data and has as a result to produce more interference delays and CPU time. The analysis results in this study can be used in future research designed to estimate more accurately WCETs in industrial multicore scenarios.
References
1. N. Semiconductors, “Ls2085a/ls2088a reference design board errata,”Board Errata, vol. Rev. 1, no. 27, pp. 1–27, April 2017.
2. N. Semiconductors, “Qoriq ls2085a/ls2088a reference design board getting started guide: Supports ls2085a/ls2088ardb revision f and earlier,” Getting Started Guide, vol. Rev. 1, no. 29, pp. 1–29, March 2017.
3. N. Semiconductors, “Design board reference manual,”QorIQ LS2085A/LS2088A Reference, vol. Rev. 1, no. 113, pp. 1–113, March 2017.
4. ARM,Programmer’s Guide for ARMv8-A, version 1.0 ed. ARM manual, 2015.
5. ARM,ARMv8 Instruction Set Overview, prd03-genc-010197 15.0 ed. ARM Manual, 2014.
6. ARM,ARM Cortex-A57 MPCore Processor, revision: r1p1 ed. http://www.arm.com: Technical Reference
Manual, 2013.
7. ARM,ARM Architecture Reference Manual for ARMv8-A, revision: 09-2017 ed. ARMv8-A Reference Manual,
2017.
8. ARM,Bare-metal Boot Code for ARMv8-A Processors, version 1.0 ed. ARM Application Note, 2017.
9. G. Blake, R. G. Dreslinski, and T. Mudge, “A survey of multicore processors,”IEEE Signal Processing Magazine, vol. 26, no. 6, pp. 26–37, November 2009.
11. S. Flur, K. E. Gray, C. Pulte, S. Sarkar, A. Sezgin, L. Maranget, W. Deacon, and P. Sewell, “Modelling the armv8 architecture, operationally: Concurrency and isa,”SIGPLAN Not., vol. 51, no. 1, pp. 608–621, Jan. 2016. [Online]. Available: http://doi.acm.org/10.1145/2914770.2837615
12. A. Jalali, R. Azarderakhsh, M. M. Kermani, and D. Jao, “Supersingular isogeny diffie-hellman key exchange on 64-bit arm,”IEEE Transactions on Dependable and Secure Computing, vol. PP, no. 99, pp. 1–1, 2017. 13. A. Antras, C. Gorgovan, J. Garside, J. Goodacre, and M. Luján, “Hypermambo-x64: Using virtualization to
support high-performance transparent binary translation,”SIGPLAN Not., vol. 52, no. 7, pp. 228–241, Apr. 2017. [Online]. Available: http://doi.acm.org/10.1145/3140607.3050756
14. H. Seo, Z. Liu, Y. Nogami, J. Choi, and H. Kim, “Binary field multiplication on armv8,” Security and
Communication Networks, vol. 9, no. 13, pp. 2051–2058, 2016, sec.1462. [Online]. Available: http://dx.doi.org/
10.1002/sec.1462
15. A. Antras, C. Gorgovan, J. Garside, and M. Luján, “Low overhead dynamic binary translation on arm,”
SIGPLAN Not., vol. 52, no. 6, pp. 333–346, Jun. 2017. [Online]. Available: http://doi.acm.org/10.1145/
3140587.3062371
16. J. Nowotsch, “Interference-sensitive worst-case execution time analysis for multi-core processors,” doctoralthesis, Universität Augsburg, 2014.
17. H. Falk, S. Altmeyer, P. Hellinckx, B. Lisper, W. Puffitsch, C. Rochange, M. Schoeberl, R. B. Sorensen, P. Wägemann, and S. Wegener, “TACLeBench: A Benchmark Collection to Support Worst-Case Execution Time Research,” in16th International Workshop on Worst-Case Execution Time Analysis (WCET 2016), ser. OpenAccess Series in Informatics (OASIcs), M. Schoeberl, Ed., vol. 55. Dagstuhl, Germany: Schloss Dagstuhl–Leibniz-Zentrum fuer Informatik, 2016, pp. 2:1–2:10. [Online]. Available: http://drops.dagstuhl. de/opus/volltexte/2016/6895
18. Z. P. Wu, Y. Krish, and R. Pellizzoni, “Worst case analysis of dram latency in multi-requestor systems,” in
2013 IEEE 34th Real-Time Systems Symposium, Dec 2013, pp. 372–383.
19. S. Rixner, W. J. Dally, U. J. Kapasi, P. Mattson, and J. D. Owens, “Memory access scheduling,”SIGARCH
Comput. Archit. News, vol. 28, no. 2, pp. 128–138, May 2000. [Online]. Available: http://doi.acm.org/10.
1145/342001.339668
20. A. Schranzhofer, J. Chen, and L. Thiele, “Timing analysis for tdma arbitration in resource sharing systems,”
in2010 16th IEEE Real-Time and Embedded Technology and Applications Symposium, April 2010, pp. 215–224.
21. G. Yao, R. Pellizzoni, S. Bak, E. Betti, and M. Caccamo, “Memory-centric scheduling for multicore hard real-time systems,”Real-Time Systems, vol. 48, no. 6, pp. 681–715, Nov 2012. [Online]. Available: https: //doi.org/10.1007/s11241-012-9158-9
22. H. Yun, R. Pellizzon, and P. K. Valsan, “Parallelism-aware memory interference delay analysis for cots multicore systems,” in2015 27th Euromicro Conference on Real-Time Systems, July 2015, pp. 184–195.
Appendix Further Results
BINARYSEARCH FAC PRIME
1 core 8 cores 1 core 8 cores 1 core 8 cores
0.5 1 1.5
·105
Active cores
Min.
Interfer
ence
Delay
per
Cor
e
[cycles]
BM/WS. BM/RS.
BITCOUNT INSERTSORT MATRIX1
1 core 8 cores 1 core 8 cores 1 core 8 cores
1 2 3 4 5
·106
Active cores
Min.
Interfer
ence
Delay
per
Cor
e
[cycles]
BM/WS. BM/RS.
Figure A.2.Experiment 9.b: Minimal interference delay measured with disabled caches for one and eight active cores. The considered benchmarks are bitcount, insertsort, and matrix1.
FFT MD5 SHA
1 core 8 cores 1 core 8 cores 1 core 8 cores
0.5 1 1.5 2 2.5
·109
Active cores
Min.
Interfer
ence
Delay
per
Cor
e
[cycles]
BM/WS. BM/RS.
Figure A.3.Experiment 9.c: Minimal interference delay measured with disabled caches for one and eight active cores. The considered benchmarks are fft, md5, and sha.
BINARYSEARCH FAC PRIME
1 core 8 cores 1 core 8 cores 1 core 8 cores
1,000 1,500 2,000 2,500
Active cores
Min.
Interfer
ence
Delay
per
Cor
e
[cycles]
BM/WS. BM/RS.
Figure A.4.Experiment 10.a: Minimal interference delay measured with enabled caches for one and eight active cores. The considered benchmarks are binarysearch, fac, and prime.
BITCOUNT INSERTSORT MATRIX1
1 core 8 cores 1 core 8 cores 1 core 8 cores
0 1 2 3 4
·105
Active cores
Min.
Interfer
ence
Delay
per
Cor
e
[cycles]
BM/WS. BM/RS.
FFT MD5 SHA
1 core 8 cores 1 core 8 cores 1 core 8 cores
1 2 3
·107
Active cores
Min.
Interfer
ence
Delay
per
Cor
e
[cycles]
BM/WS. BM/RS.
Figure A.6.Experiment 10.c: Minimal interference delay measured with enabled caches for one and eight active cores. The considered benchmarks are fft, md5, and sha.
BINARYSEARCH FAC PRIME
1 core 8 cores 1 core 8 cores 1 core 8 cores
0.4 0.6 0.8 1 1.2 1.4
·105
Active cores
Min.
CPU
cycles
per
Cor
e
BM/WS. BM/RS.
Figure A.7.Experiment 11.a: Minimum number of CPU cycles measured with disabled caches for one and eight active cores. The considered benchmarks are binarysearch, fac, and prime.
BITCOUNT INSERTSORT MATRIX1
1 core 8 cores 1 core 8 cores 1 core 8 cores
0 1 2 3 4 5
·106
Active cores
Min.
CPU
cylces
per
Cor
e
BM/WS. BM/RS.
Figure A.8.Experiment 11.b: Minimum number of CPU cycles measured with disabled caches for one and eight active cores. The considered benchmarks are bitcount, insertsort, and matrix1.
FFT MD5 SHA
1 core 8 cores 1 core 8 cores 1 core 8 cores
0.5 1 1.5 2 2.5
·109
Active cores
Min.
CPU
cycles
per
Cor
e
BM/WS. BM/RS.
BINARYSEARCH FAC PRIME
1 core 8 cores 1 core 8 cores 1 core 8 cores
0 500 1,000 1,500 2,000 2,500
Active cores
Min.
CPU
cycles
per
Cor
e
BM/WS. BM/RS.
Figure A.10.Experiment 12.a: Minimum number of CPU cycles measured with enabled caches for one and eight active cores. The considered benchmarks are binarysearch, fac, and prime.
BITCOUNT INSERTSORT MATRIX1
1 core 8 cores 1 core 8 cores 1 core 8 cores
0 1 2 3 4
·105
Active cores
Min.
CPU
cycles
per
Cor
e
BM/WS. BM/RS.
Figure A.11.Experiment 12.b: Minimum number of CPU cycles measured with enabled caches for one and eight active cores. The considered benchmarks are bitcount, insertsort, and matrix1.
FFT MD5 SHA
1 core 8 cores 1 core 8 cores 1 core 8 cores
1 2 3
·107
Active cores
Min.
CPU
cycles
per
Cor
e
BM/WS. BM/RS.
![Figure 1. QorIQ LS2085A Board Block diagram (according to [3])](https://thumb-us.123doks.com/thumbv2/123dok_us/1004611.1600314/2.595.98.499.94.372/figure-qoriq-ls-a-board-block-diagram-according.webp)
![Figure 2. Block diagram of a Cortex-A57 core according to [6]](https://thumb-us.123doks.com/thumbv2/123dok_us/1004611.1600314/3.595.122.476.85.539/figure-block-diagram-cortex-a-core-according.webp)